Introduction
The STEM Education Centers KPI Dashboard in Power BI is a powerful tool designed to help educational institutions and administrators monitor key performance indicators effectively. By utilizing data captured in an Excel file, this dashboard provides clear insights into monthly and yearly progress against targets, enabling timely decision-making for continuous improvement in STEM education centers.
Key Features of STEM Education Centers KPI Dashboard in Power BI
Click to Buy STEM Education Centers KPI Dashboard in Power BI
- Integration with Excel as a data source for ease of data input and management.
- Three dynamic dashboard pages to explore summary metrics, trends, and detailed definitions.
- Interactive slicers for Month and KPI Group selection for targeted data analysis.
- Visual indicators such as up and down arrows with color coding for quick status identification.
- Capability to drill through KPI details for deeper understanding of each metric.
- User-friendly layout that supports both high-level summary views and granular analysis.
Dashboard Pages Explanation
1. Summary Page
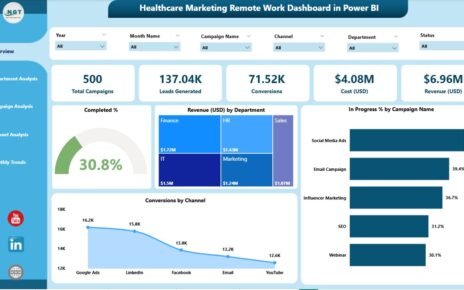
This is the main interface of the STEM Education Centers KPI Dashboard in Power BI. It offers a comprehensive snapshot of all KPIs, allowing users to filter by Month and KPI Group using slicers positioned at the top.
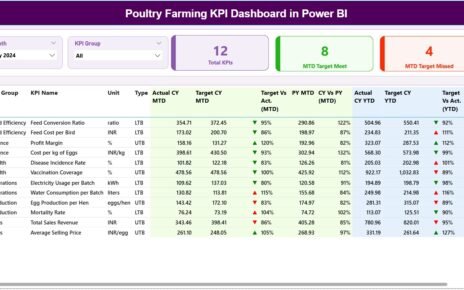
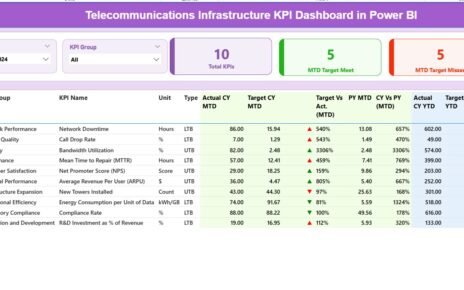
- KPI Cards: Display total KPI count, MTD (Month-to-Date) target meets, and MTD target misses.
- KPIs Detailed Table: Shows extensive data including KPI Number, Group, Name, Unit, Type (LTB or UTB), and performance figures.
- MTD and YTD values: Actual vs Target metrics along with icons indicating performance status (green up arrow for achieving targets, red down arrow for missing targets).
- Comparative Percentages: Calculations for Target vs Actual and Current Year vs Previous Year both on MTD and YTD basis, offering trend insight and performance analysis.

2. KPI Trend Page
Click to Buy STEM Education Centers KPI Dashboard in Power BI
This page focuses on graphical representations of KPI trends. It displays two combo charts illustrating Actual Numbers for the Current Year, Previous Year, and Targets on both MTD and YTD timelines.
- KPI Slicer: Located on the left to enable KPI selection for tailored trend visualization.
- Combo Charts: Help in visualizing performance against targets and historical data comparisons to identify progress or areas needing attention.

3. KPI Definition Page
Accessible via drill-through from the Summary Page, this hidden page offers in-depth KPI details, including formulas and definitions for each metric.
- Drillthrough Functionality: Allows users to get exact KPI meaning, calculation method, and categorization aiding better contextual understanding.
- Navigation: Users can return to the Summary Page using a provided back button in the top-left corner.

Excel Data Structure for the Dashboard
Click to Buy STEM Education Centers KPI Dashboard in Power BI
The data that feeds this dashboard is maintained in an Excel file with three key worksheets:
- Input_Actual Sheet: Contains the actual KPI numbers by Name, Month (represented by the first date of the month), MTD values, and YTD values.

- Input_Target Sheet: Contains corresponding target data similarly structured by KPI Name, Month, MTD targets, and YTD targets.

- KPI Definition Sheet: Includes metadata such as KPI Number, Group, Name, Unit, Formula used, Definition, and KPI Type whether it is Lower The Better (LTB) or Upper The Better (UTB).

Advantages of STEM Education Centers KPI Dashboard in Power BI
Click to Buy STEM Education Centers KPI Dashboard in Power BI
- Real-Time KPI Monitoring: Keep track of monthly and yearly performance quickly and efficiently.
- Enhanced Data Visualization: Interactive charts and color-coded icons help users understand trends and statuses at a glance.
- User-Friendly Navigation: Drillthrough and slicers enable faster insights tailored to user interest.
- Improved Decision Making: Clear visualization of target achievement supports timely interventions and strategic planning.
- Excel Integration: Familiar data entry method for users, simplifying maintenance and updates.
Opportunities for Improvement
- Automated Data Refresh: Integration with live data sources could eliminate the need for manual Excel updates.
- Mobile Optimization: Enhancing dashboard responsiveness for mobile devices to support on-the-go access.
- Advanced Analytics: Incorporating predictive analytics or AI insights to foresee future trends or anomalies.
- Custom Alerts: Setting up notifications for KPIs that exceed thresholds to improve proactive management.
Best Practices
- Maintain Accurate Data: Regularly update Excel source files to ensure dashboard reliability.
- Use Consistent KPI Definitions: Avoid confusion by standardizing KPI terms and measurement units.
- Leverage Slicers Wisely: Use month and KPI group slicers to filter data effectively for meaningful analysis.
- Train Users: Provide guidance on interpreting dashboard elements like icons, percentages, and trends.
- Backup Data: Manage versions of your Excel data input file to prevent data loss.
FAQs
Click to Buy STEM Education Centers KPI Dashboard in Power BI
- Q: How do I update the data in the dashboard?
A: Update the relevant Excel sheets with actual, target, and KPI definition data, then refresh the Power BI report. - Q: Can I add more KPIs to the dashboard?
A: Yes, add new KPIs in the KPI Definition worksheet and update actual and target data accordingly. - Q: Is this dashboard suitable for mobile viewing?
A: Currently optimized for desktop, mobile responsiveness can be improved with design adjustments. - Q: What do LTB and UTB types mean?
A: LTB means ‘Lower the Better’ where a lower KPI value is desired; UTB means ‘Upper the Better’ where higher values indicate success. - Q: How do I navigate back from the KPI Definition page?
A: Use the back button available on the top left corner of the KPI Definition page.
Conclusion
Click to Buy STEM Education Centers KPI Dashboard in Power BI
The STEM Education Centers KPI Dashboard in Power BI offers an effective, user-friendly way to visualize, analyze, and manage key educational performance metrics. Its integration with Excel for data input, combined with powerful Power BI visualizations and insights, enables stakeholders to stay informed and make data-driven decisions. By following best practices and continuously enhancing the dashboard, STEM education centers can leverage this tool to drive measurable improvements in their programs.
For more information and a visual walkthrough, visit Microsoft’s official Power BI documentation for deeper insights into building KPI dashboards: https://docs.microsoft.com/en-us/power-bi/create-reports/desktop-visualizations.
Visit our YouTube channel to watch the demo: Youtube.com/@NextGenTemplates
Click to Buy STEM Education Centers KPI Dashboard in Power BI