New: NextGenTemplates Academy - video courses on Excel formulas with AI and Pivot Tables & dashboards. Early-bird: 20% off with code EARLYBIRD20 - first 20 orders only. See the courses →
  • Learn Excel (Free Course)
    • 1. Shortcut Keys
    • 2. Fill & Flash Fill
    • 3. Find & Replace
    • 4. Sort & Filter
    • 5. Formulas & Functions
    • 6. Data Validation
    • 7. Conditional Formatting
    • 8. Basic Charts
    • 9. Advanced Charts
    • 10. Pivot Tables
    • 11. Excel Dashboards
    • 12. VBA Course
    • 13. Excel Formulas with AI
  • Templates
  • Tutorials
    • Charts and Visualization
    • VBA
    • Excel Tips and Tricks
    • Excel Dashboards
    • Power Pivot & DAX
  • Power BI
  • Template Store
    • Ready to Use Templates
  • Courses
  • Academy
    • Excel + AI Mastery: 100 Formulas
    • Excel Pivot Tables & Dashboards
  • About Us
  • Contact Us

PK: An Excel Expert

Transforming Data into Decisions

Tag: Dynamic Chart

Highlight top N in Excel
Charts and Visualization

Highlight Top and Bottom N in Excel Chart

August 11, 2024October 10, 2026 PKComments Off on Highlight Top and Bottom N in Excel Chart
This is ready to use Chart to Highlight Top or bottom N in Excel Chart. You can use it for office use. This is a totally dynamic chart. Data: To
Read More
Credit Rating Meter Chart in Excel
Charts and Visualization

Credit Rating Meter Chart in Excel

June 23, 2024October 10, 2026 PKComments Off on Credit Rating Meter Chart in Excel
In this article, we will create a visually appealing Credit Rating Meter Chart in Excel. You can display a credit score, a Civil score, or any other key performance indicator
Read More
Find Top Employee with Filter Function
Charts and Visualization Excel Tips and Tricks

Find Top Employee with FILTER and RANK Function

June 7, 2022October 10, 2026 PKComments Off on Find Top Employee with FILTER and RANK Function
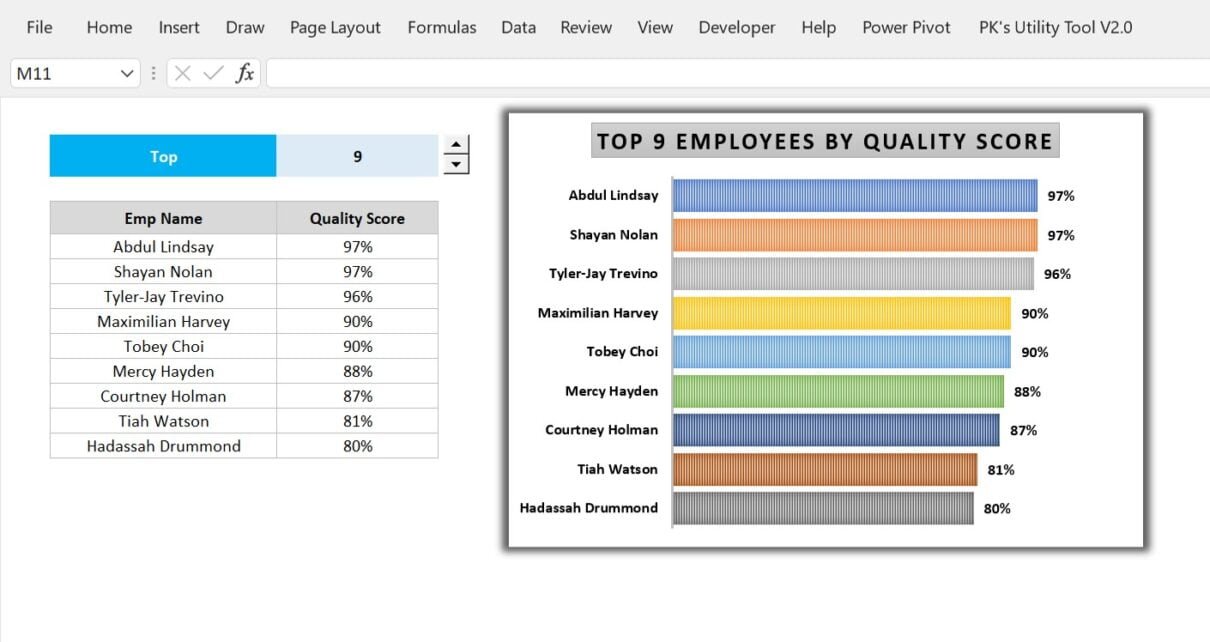
In this article, we have explained how to find top selected employee with the help of FILTER and RANK Function. You will also learn the SORT and OFFSET Function. We
Read More
Dynamic Chart with Camera
Charts and Visualization

Dynamic Graph with Camera

May 3, 2022October 10, 2026 PKComments Off on Dynamic Graph with Camera
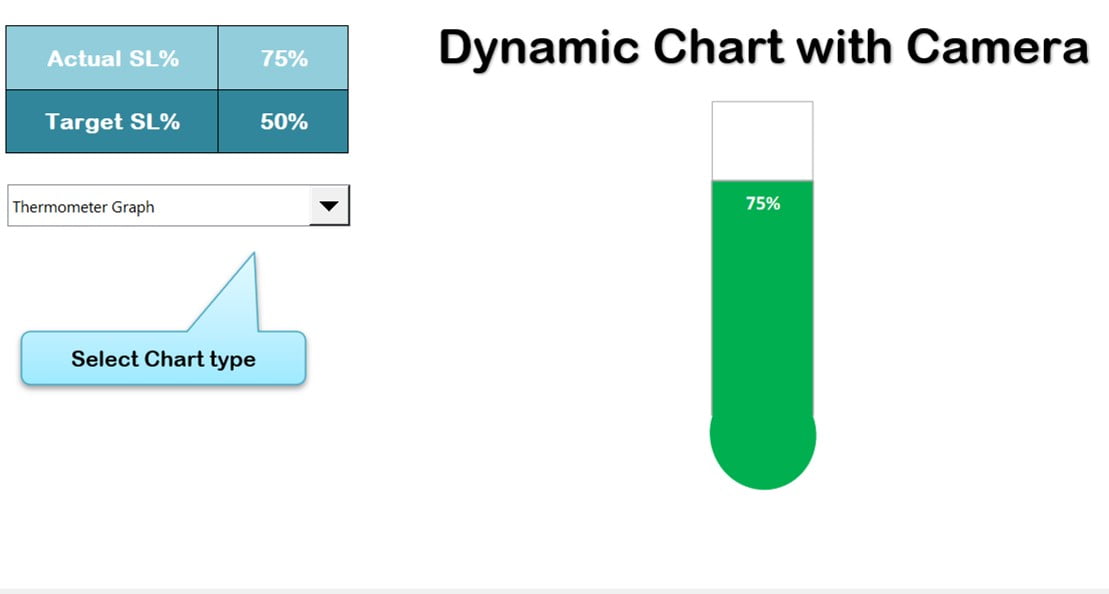
In this article, we have created a dynamic graph with Camera functionality of Excel. We have used conditional formatting in Chart. You can change the chart type using Form Control
Read More
Conditional formatting in Excel Chart
Charts and Visualization

Conditional formatting in Excel Chart

May 3, 2022March 2, 2025 PKComments Off on Conditional formatting in Excel Chart
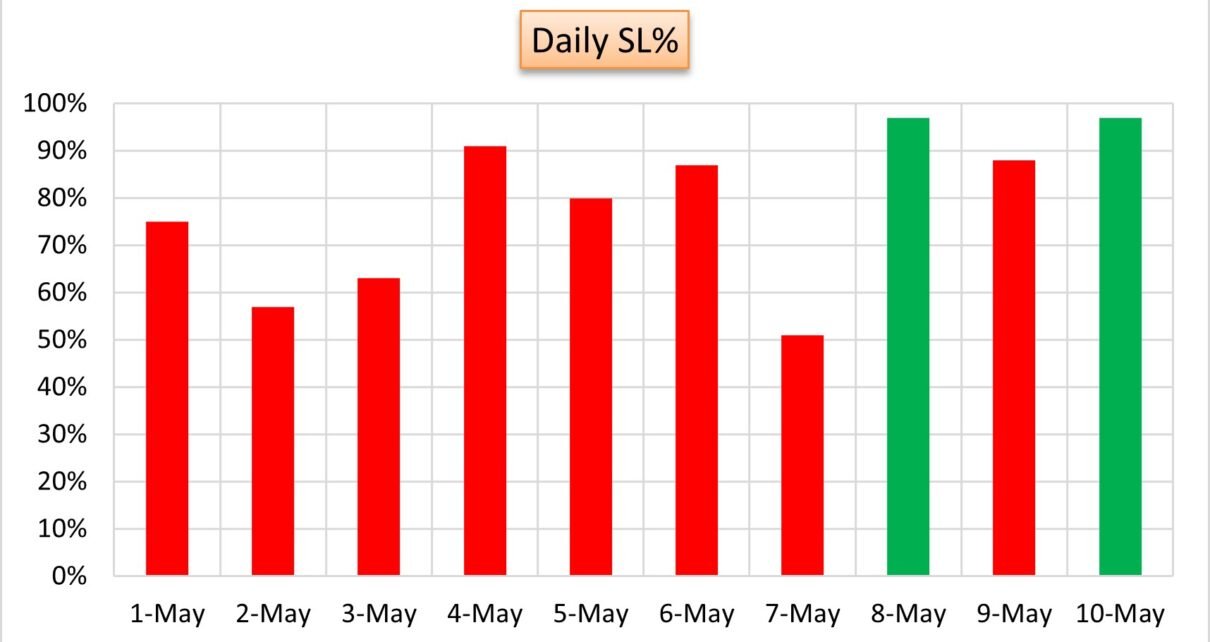
In this article, you will learn how to use Conditional formatting in Excel Chart. You can use this trick to show to Target Vs Actual number. Conditional formatting in Excel
Read More
Tooltip in Excel
Charts and Visualization

KPI Dashboard with Tooltip in Excel

August 8, 2021March 2, 2025 PKComments Off on KPI Dashboard with Tooltip in Excel
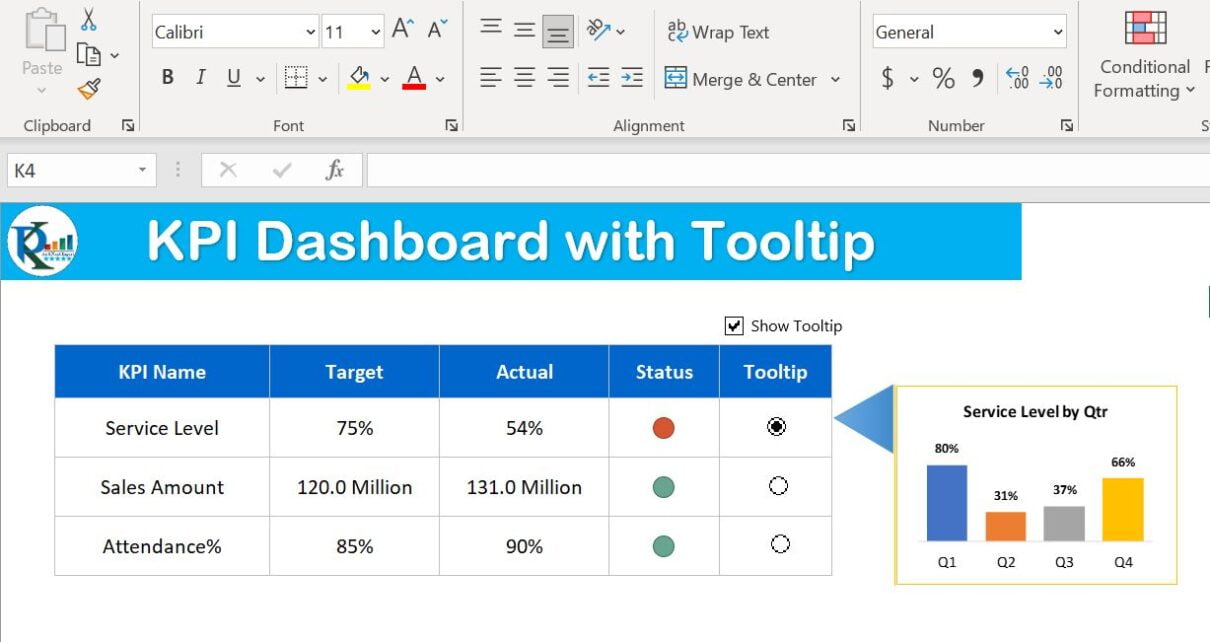
In this article, we have created Chart Tooltip in KPI Dashboard in Microsoft Excel. You can use this trick to show the details of a number with the chart. We
Read More
Cross Filter in Excel Chart
Charts and Visualization

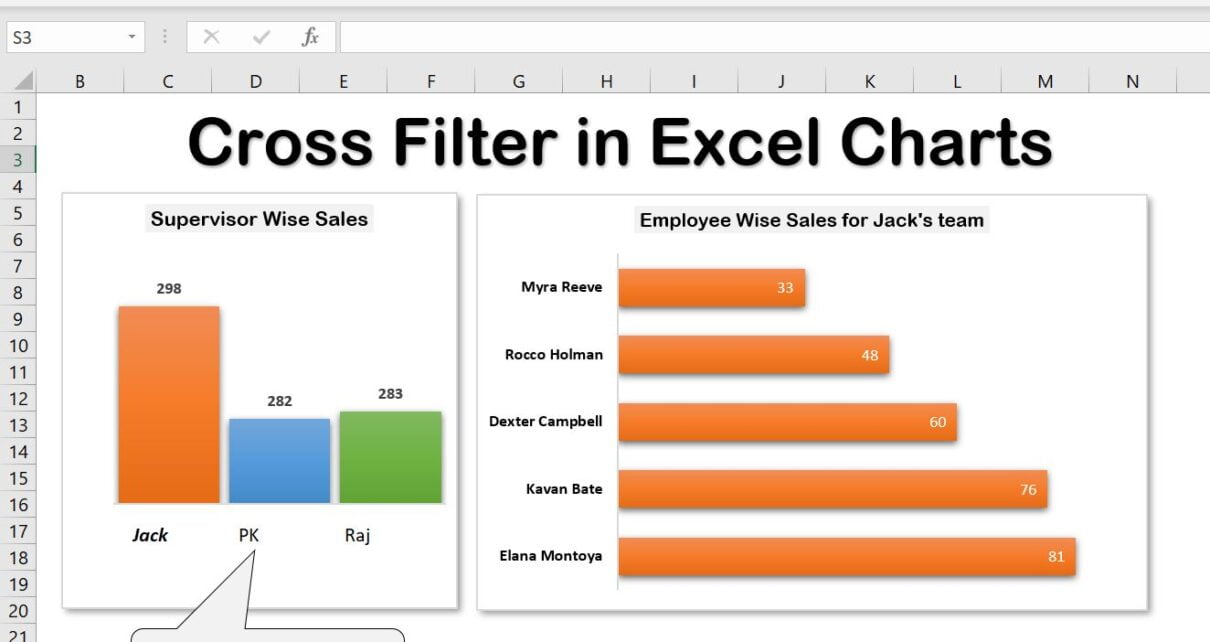
Cross Filter Functionality in Excel Chart

July 5, 2021March 4, 2025 PKComments Off on Cross Filter Functionality in Excel Chart
Excel is a powerful tool that provides a wide range of features to help you analyze and present data effectively. One of the most key features in Excel is the
Read More
Dynamic Comparison Analysis Chart
Charts and Visualization

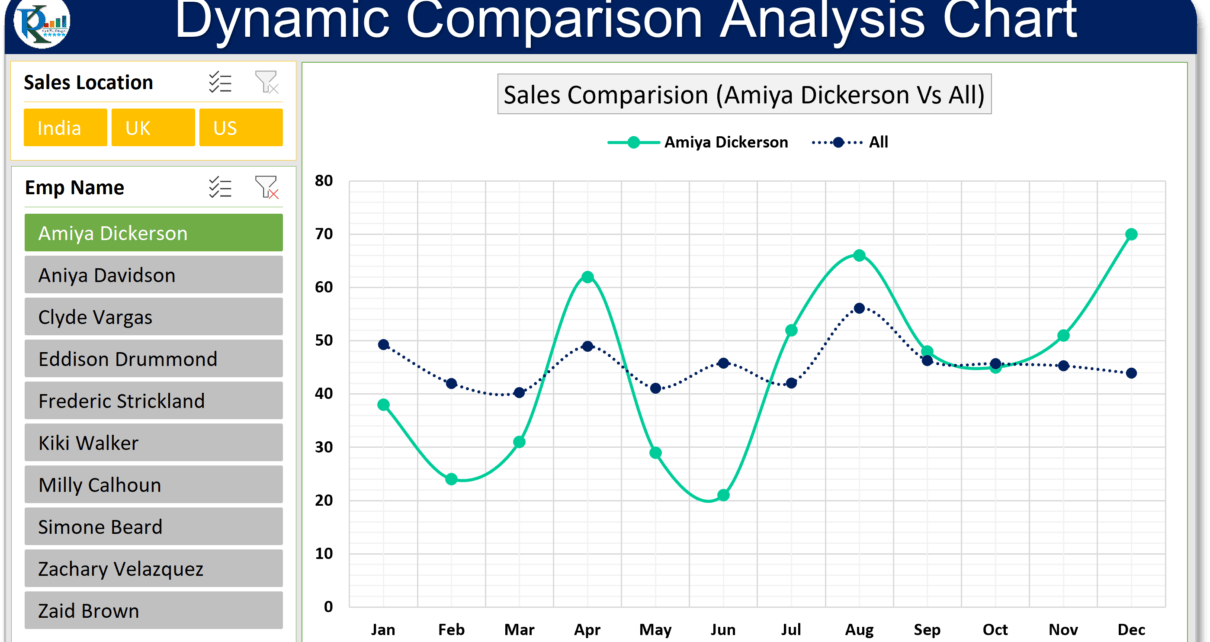
Dynamic Comparison Analysis Chart in Excel

May 3, 2021March 2, 2025 PKComments Off on Dynamic Comparison Analysis Chart in Excel
In this article, you will learn how to create a dynamic comparison Analysis Chart in Microsoft Excel. Using this chart you can compare one employee's performance with other all employees
Read More
Comparison Chart
Charts and Visualization

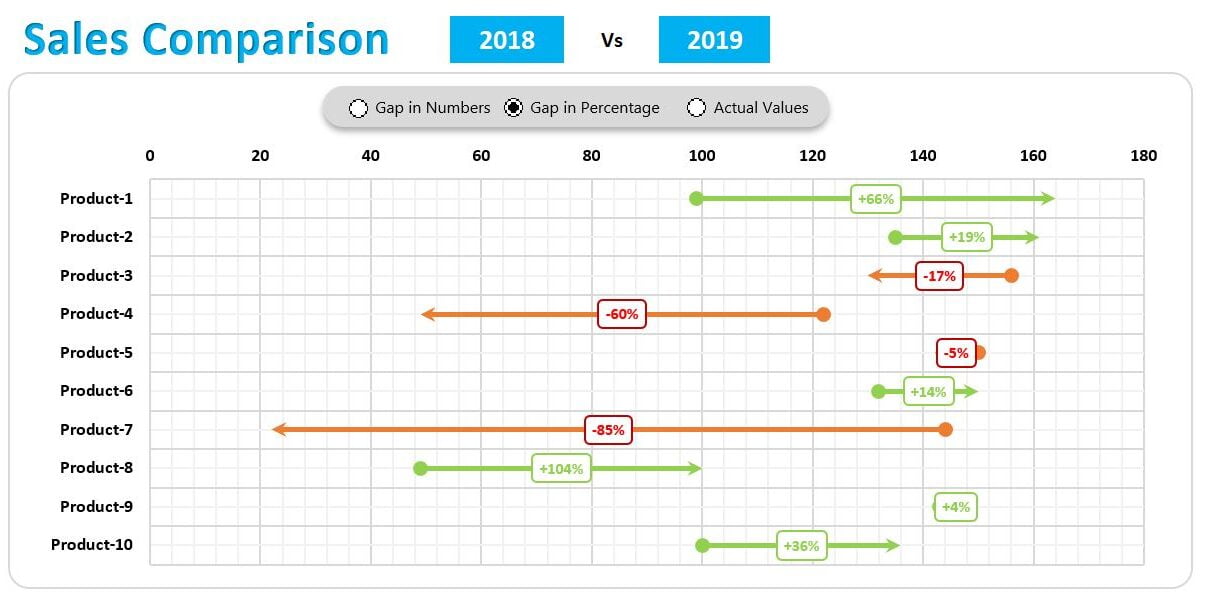
Stylish and Dynamic Comparison Chart

August 30, 2020March 2, 2025 PKComments Off on Stylish and Dynamic Comparison Chart
In the article,  we have created a stylish and dynamic comparison chart in Microsoft Excel. This chart can be used to compare the metric like -Sales, Revenue, profit, etc. between
Read More
Dynamic Filled Map
Charts and Visualization

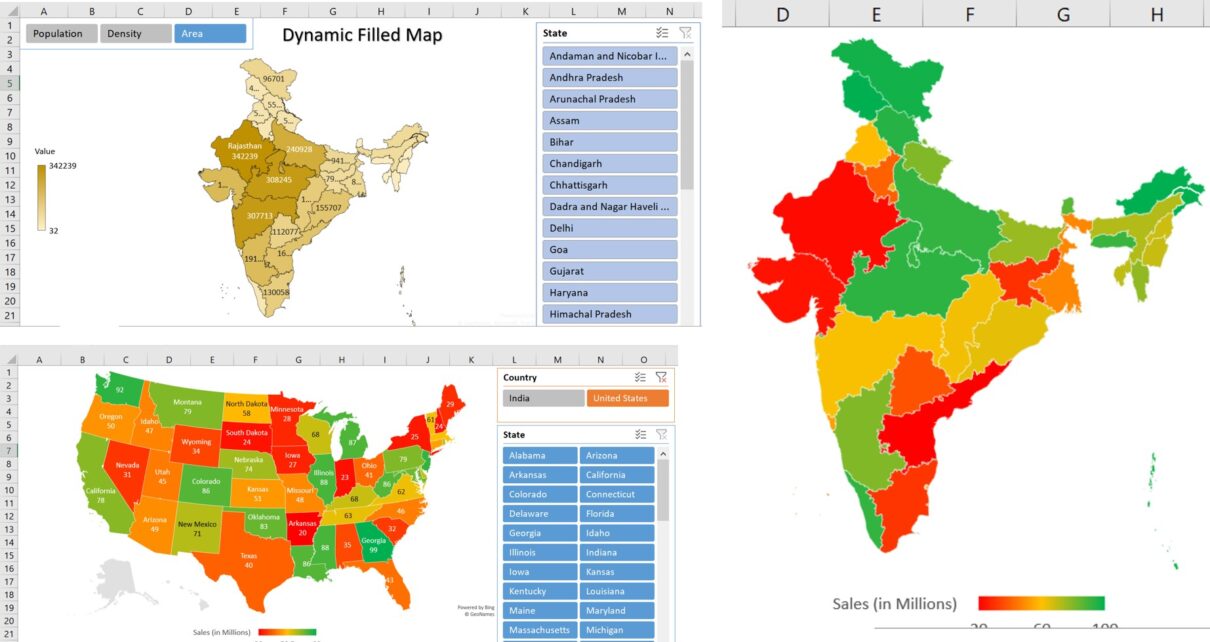
Dynamic Filled map in Excel

August 23, 2020October 10, 2026 PKComments Off on Dynamic Filled map in Excel
In the article, You will learn how to create a dynamic filled map in Microsoft Excel. Filled Map is available with Office 365 subscription. You can display the Region, country,
Read More

Posts pagination

1 2 3 Next
  • Learn Excel (Free Course)
    • 1. Shortcut Keys
    • 2. Fill & Flash Fill
    • 3. Find & Replace
    • 4. Sort & Filter
    • 5. Formulas & Functions
    • 6. Data Validation
    • 7. Conditional Formatting
    • 8. Basic Charts
    • 9. Advanced Charts
    • 10. Pivot Tables
    • 11. Excel Dashboards
    • 12. VBA Course
    • 13. Excel Formulas with AI
  • Templates
  • Tutorials
    • Charts and Visualization
    • VBA
    • Excel Tips and Tricks
    • Excel Dashboards
    • Power Pivot & DAX
  • Power BI
  • Template Store
    • Ready to Use Templates
  • Courses
  • Academy
    • Excel + AI Mastery: 100 Formulas
    • Excel Pivot Tables & Dashboards
  • About Us
  • Contact Us
Copyright © 2023 PK-AnExcelExpert.com - Privacy Policy