New: NextGenTemplates Academy - video courses on Excel formulas with AI and Pivot Tables & dashboards. Early-bird: 20% off with code EARLYBIRD20 - first 20 orders only. See the courses →
  • Learn Excel (Free Course)
    • 1. Shortcut Keys
    • 2. Fill & Flash Fill
    • 3. Find & Replace
    • 4. Sort & Filter
    • 5. Formulas & Functions
    • 6. Data Validation
    • 7. Conditional Formatting
    • 8. Basic Charts
    • 9. Advanced Charts
    • 10. Pivot Tables
    • 11. Excel Dashboards
    • 12. VBA Course
    • 13. Excel Formulas with AI
  • Templates
  • Tutorials
    • Charts and Visualization
    • VBA
    • Excel Tips and Tricks
    • Excel Dashboards
    • Power Pivot & DAX
  • Power BI
  • Template Store
    • Ready to Use Templates
  • Courses
  • Academy
    • Excel + AI Mastery: 100 Formulas
    • Excel Pivot Tables & Dashboards
  • About Us
  • Contact Us

PK: An Excel Expert

Transforming Data into Decisions

Tag: Excel KPI Dashboard

Dashboard

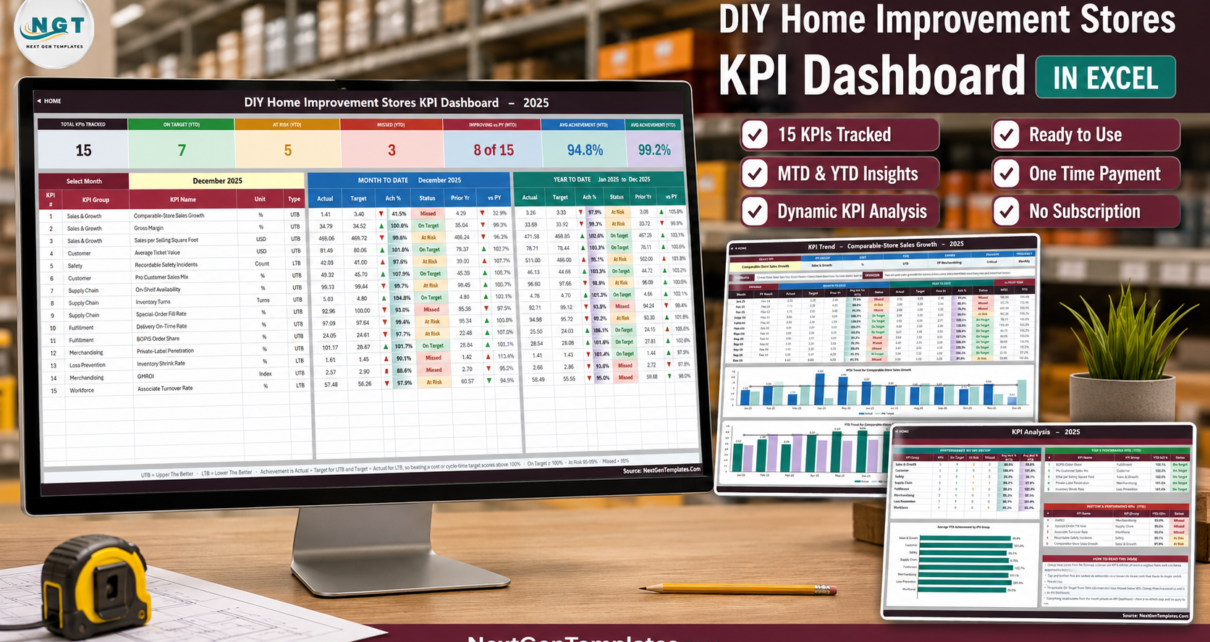
DIY Home Improvement Stores KPI Dashboard in Excel

August 26, 2026August 26, 2026 PKComments Off on DIY Home Improvement Stores KPI Dashboard in Excel
A DIY and home improvement chain generates an awkward mix of numbers. Comparable-store sales growth behaves like a supermarket metric. Special-order fill rate and job-site delivery behave like a distribution
Read More
Dashboard Templates

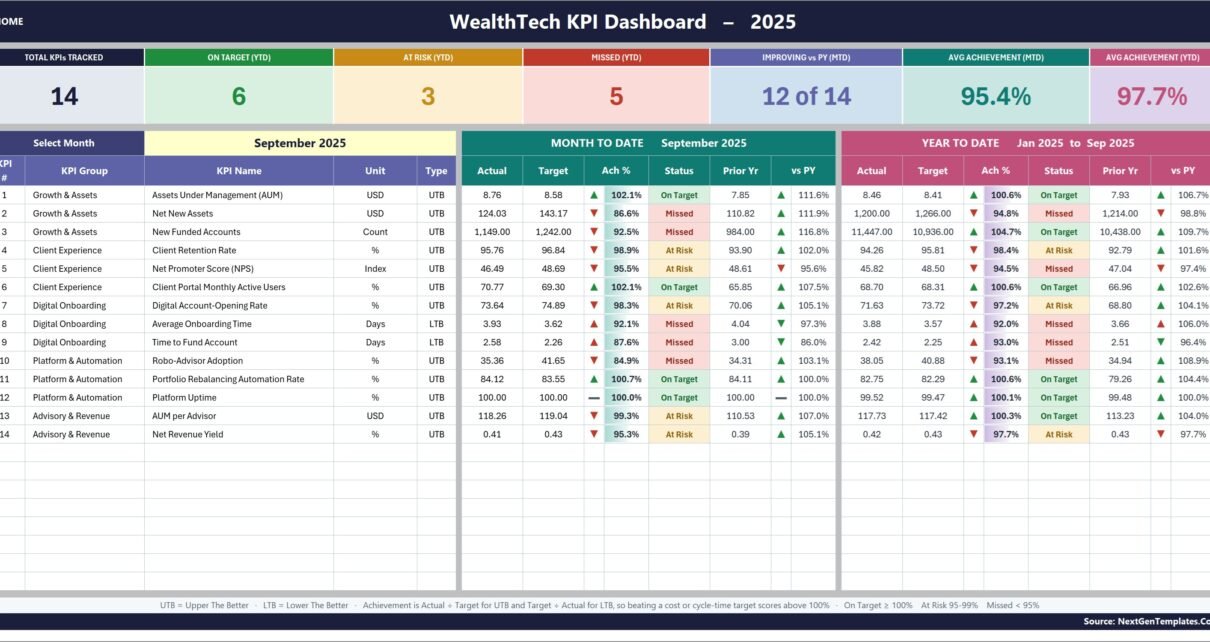
WealthTech KPI Dashboard in Excel

August 21, 2026August 21, 2026 PK0
The WealthTech KPI Dashboard in Excel organizes 14 sample indicators across 5 management groups and 12 months. In one workbook, teams can compare MTD and YTD actuals with targets and
Read More
Dashboard Templates

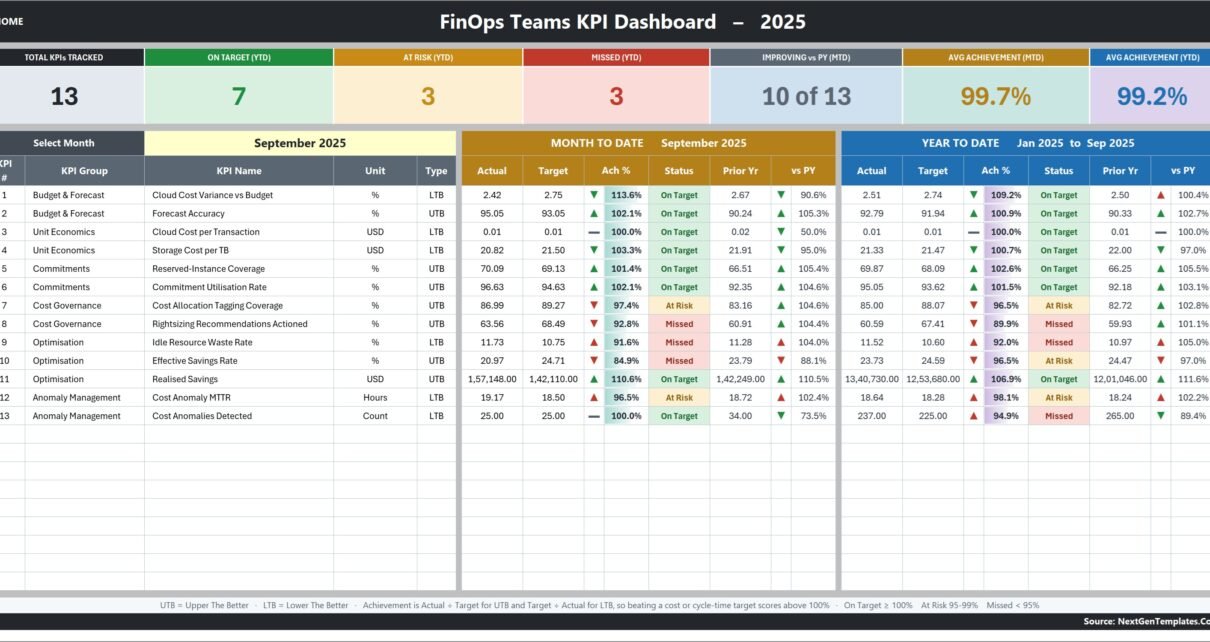
FinOps Teams KPI Dashboard in Excel

August 20, 2026August 20, 2026 PK0
A FinOps review becomes difficult when budget variance, forecast accuracy, commitment coverage, idle-resource waste, savings, and anomaly response are reported in separate files. The FinOps Teams KPI Dashboard in Excel
Read More
Dashboard Templates

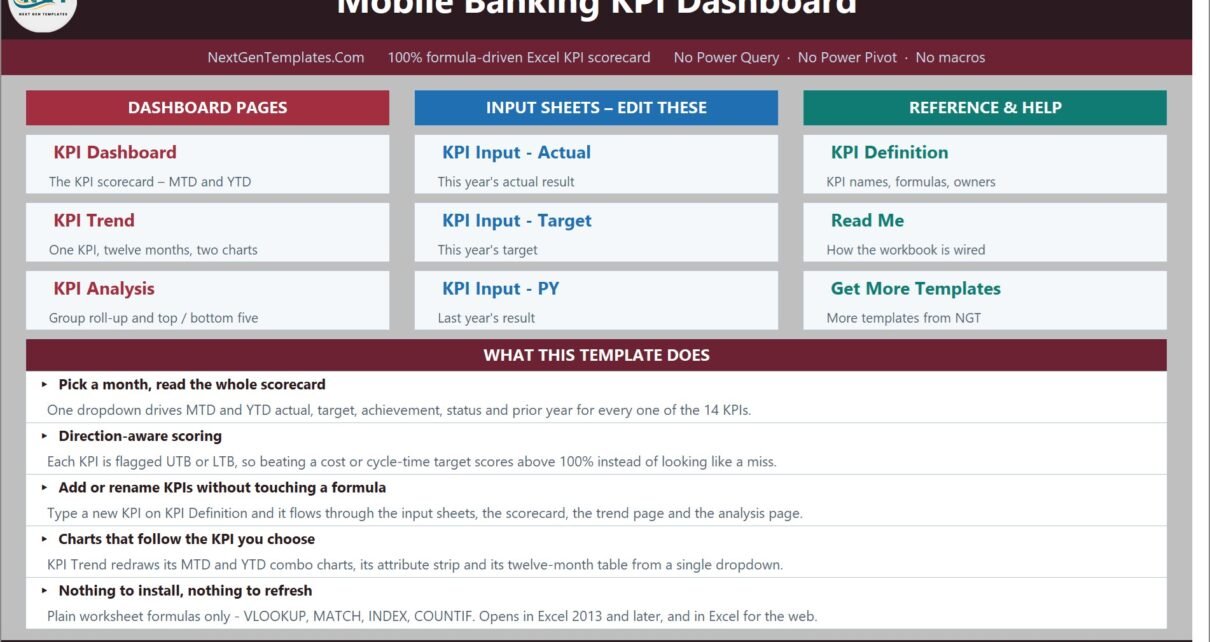
Mobile Banking KPI Dashboard in Excel

August 20, 2026August 20, 2026 PK0
Mobile banking teams can collect dozens of operational measures, yet a management review often needs a smaller, stable set. The Mobile Banking KPI Dashboard in Excel starts with 14 defined
Read More
Power BI Templates

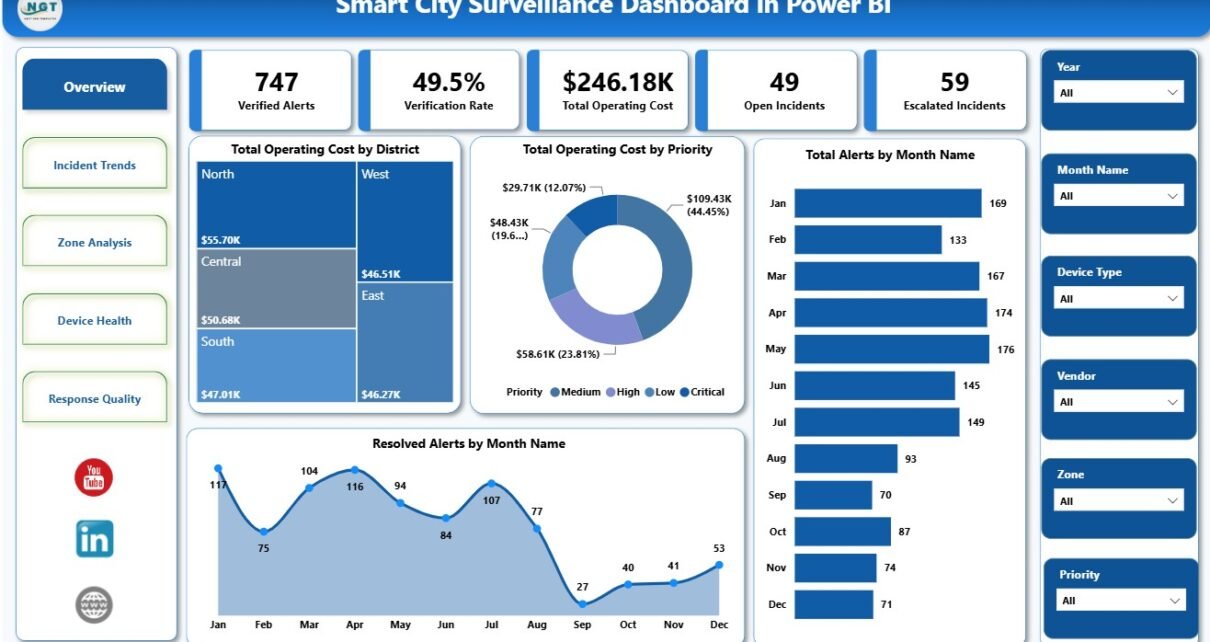
Smart City Surveillance Dashboard in Power BI

August 12, 2026August 12, 2026 PKComments Off on Smart City Surveillance Dashboard in Power BI
Smart City Surveillance Dashboard in Power BI is designed for surveillance operations, smart city control rooms, CCTV monitoring teams, public safety analysts, and security vendors that need a clean reporting
Read More
Power BI Templates

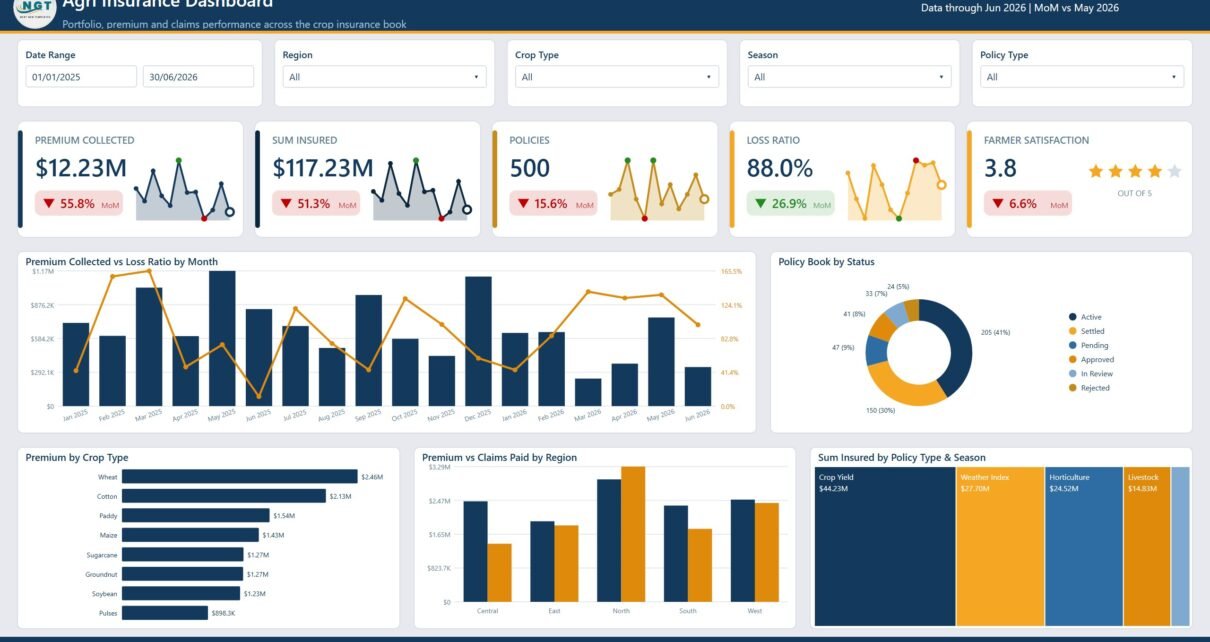
Agri Insurance Dashboard in Power BI

August 11, 2026August 11, 2026 PKComments Off on Agri Insurance Dashboard in Power BI
Agri Insurance Dashboard in Power BI is a ready-to-use reporting template for agricultural insurers, crop insurance program managers, subsidy teams, brokers, cooperatives, and analysts who need one place to review
Read More
Power BI Templates

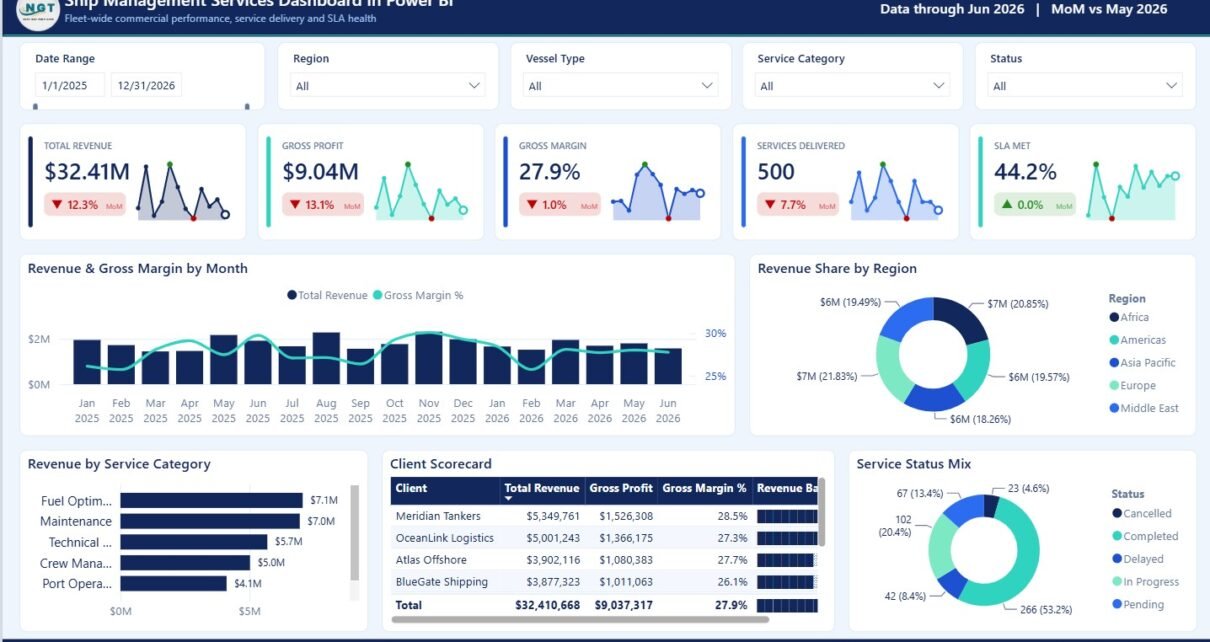
Ship Management Services Dashboard in Power BI

August 10, 2026August 10, 2026 PKComments Off on Ship Management Services Dashboard in Power BI
Ship Management Services Dashboard in Power BI helps maritime service teams review revenue, margin, service delivery, SLA compliance, fleet activity, client value, incidents, inspection scores, and monthly trends across 5
Read More
Dashboard

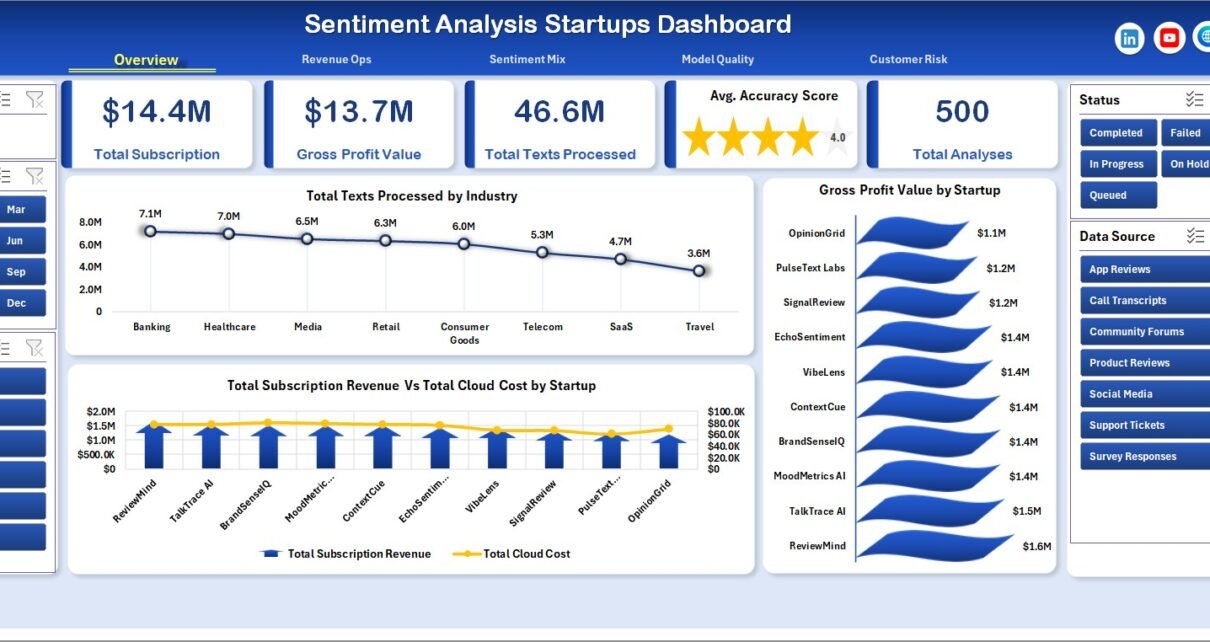
Sentiment Analysis Startups Dashboard in Excel

August 9, 2026August 9, 2026 PKComments Off on Sentiment Analysis Startups Dashboard in Excel
Sentiment Analysis Startups Dashboard in Excel is a ready-to-use Excel dashboard template for tracking startup subscription revenue, cloud cost, gross profit, text processing volume, model accuracy, sentiment mix, completion status,
Read More
Dashboard Power BI

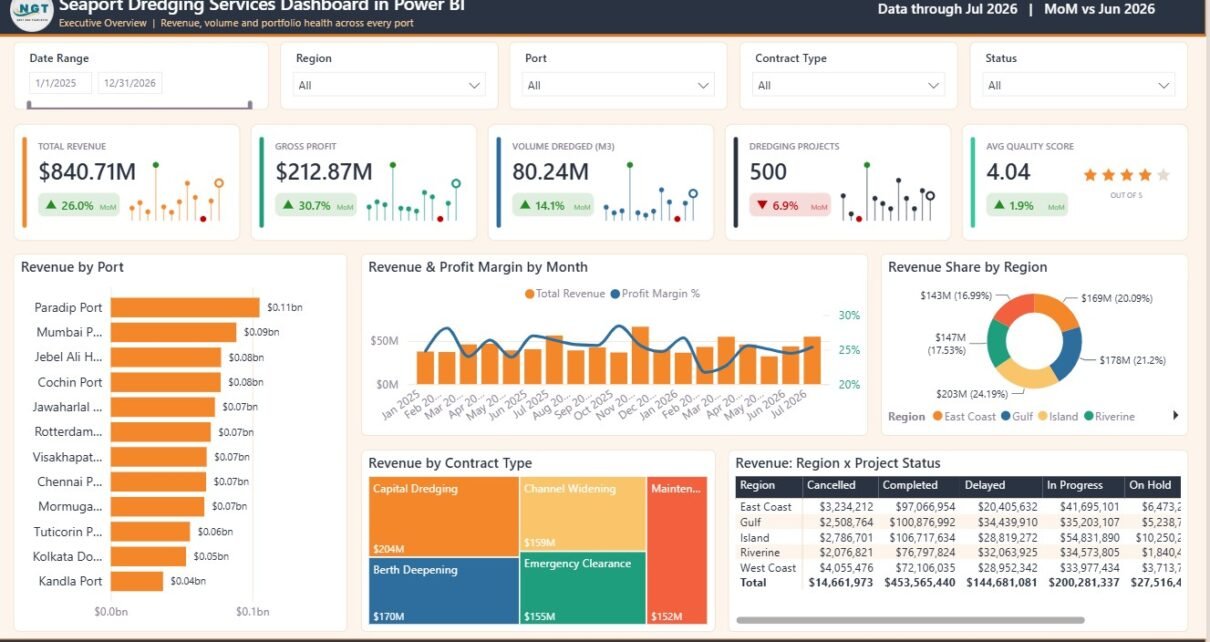
Seaport Dredging Services Dashboard in Power BI

August 9, 2026August 9, 2026 PKComments Off on Seaport Dredging Services Dashboard in Power BI
Last updated: August 9, 2026. The Seaport Dredging Services Dashboard in Power BI is a ready-to-use reporting template for dredging contractors, port authorities, marine operations teams, project controls teams, finance analysts, safety teams,
Read More
Dashboard

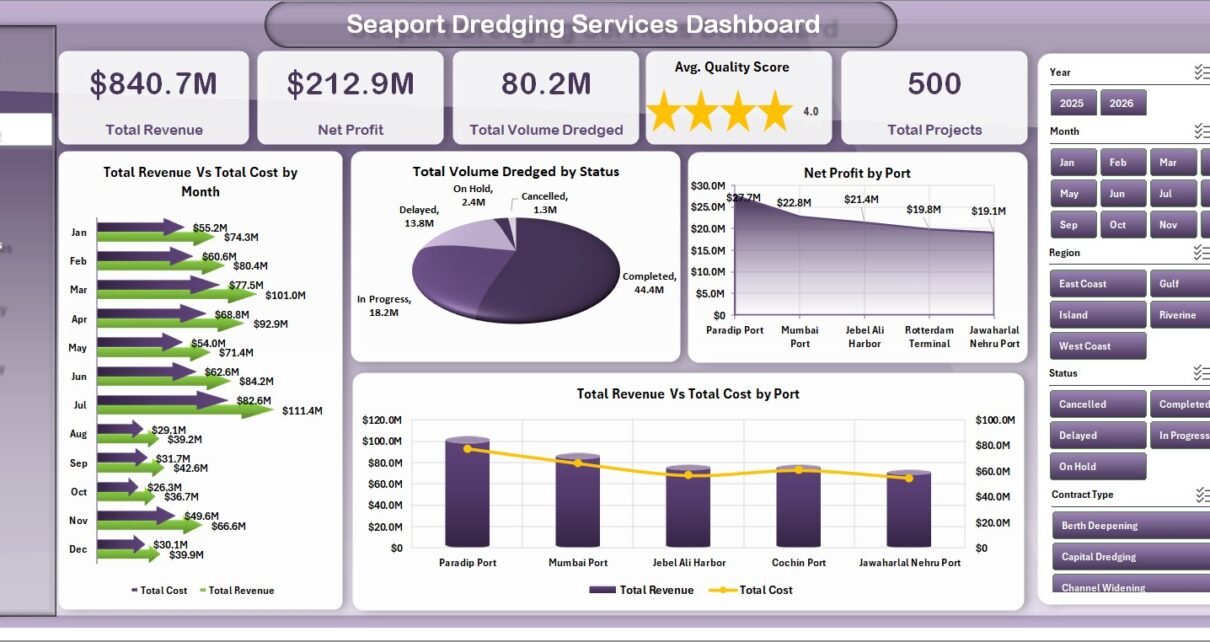
Seaport Dredging Services Dashboard in Excel

August 9, 2026August 9, 2026 PKComments Off on Seaport Dredging Services Dashboard in Excel
Last updated: August 9, 2026. The Seaport Dredging Services Dashboard in Excel is a ready-to-use reporting template for dredging contractors, port authorities, marine operations teams, and project controls professionals. It includes 7 workbook
Read More

Posts pagination

Previous 1 … 6 7 8 … 44 Next
  • Learn Excel (Free Course)
    • 1. Shortcut Keys
    • 2. Fill & Flash Fill
    • 3. Find & Replace
    • 4. Sort & Filter
    • 5. Formulas & Functions
    • 6. Data Validation
    • 7. Conditional Formatting
    • 8. Basic Charts
    • 9. Advanced Charts
    • 10. Pivot Tables
    • 11. Excel Dashboards
    • 12. VBA Course
    • 13. Excel Formulas with AI
  • Templates
  • Tutorials
    • Charts and Visualization
    • VBA
    • Excel Tips and Tricks
    • Excel Dashboards
    • Power Pivot & DAX
  • Power BI
  • Template Store
    • Ready to Use Templates
  • Courses
  • Academy
    • Excel + AI Mastery: 100 Formulas
    • Excel Pivot Tables & Dashboards
  • About Us
  • Contact Us
Copyright © 2023 PK-AnExcelExpert.com - Privacy Policy