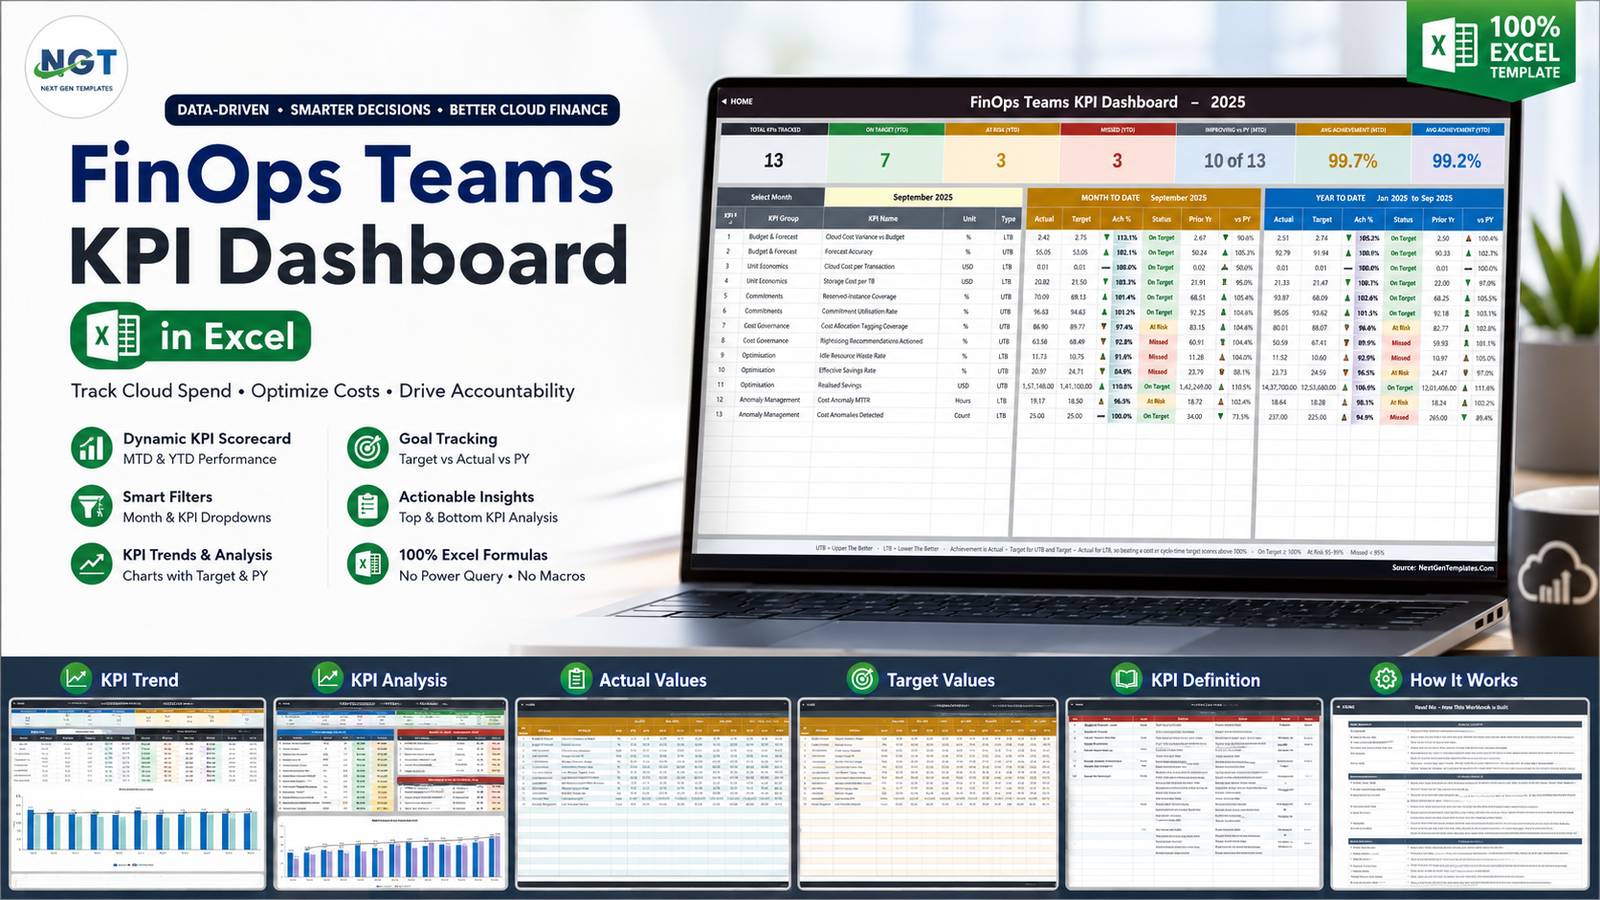
A FinOps review becomes difficult when budget variance, forecast accuracy, commitment coverage, idle-resource waste, savings, and anomaly response are reported in separate files. The FinOps Teams KPI Dashboard in Excel puts 13 sample cloud-finance KPIs into one formula-driven scorecard. It combines month-to-date and year-to-date actuals, targets, prior-year comparisons, direction-aware achievement, traffic-light status, trends, group roll-ups, and top/bottom rankings. The workbook has capacity for 22 KPIs, uses no macros or Power Query, and is designed for prepared monthly figures rather than record-level billing data.
This is the KPI scorecard-family template: a month picker and KPI picker drive a structured management review. It is different from the separate FinOps Teams analytical dashboard in Excel, which works with record-level data, pivot tables, slicers, and multiple analytical pages.
Key Features of FinOps Teams KPI Dashboard in Excel
- 13 ready KPI definitions across Budget & Forecast, Unit Economics, Commitments, Cost Governance, Optimisation, and Anomaly Management.
- Seven status cards for total tracked, on target, at risk, missed, improving versus prior year, and average MTD/YTD achievement.
- MTD and YTD columns for actual, target, achievement, status, prior year, and movement.
- UTB/LTB logic so a lower cloud cost or shorter response time can score above 100% when it beats target.
- 12-month KPI trend table with MTD and YTD actual-versus-target charts.
- Group performance analysis plus the top and bottom five YTD KPI rankings.
- Three controlled input sheets for current actuals, targets, and prior-year figures.
- Editable master list for formulas, definitions, owners, priorities, frequencies, units, and direction.
- Capacity for 22 KPIs with 13 sample rows populated.
- Standard Excel formulas without macros, Power Query, Power Pivot, or an add-in.
Dashboard Pages Explanation
Home and Workbook Map
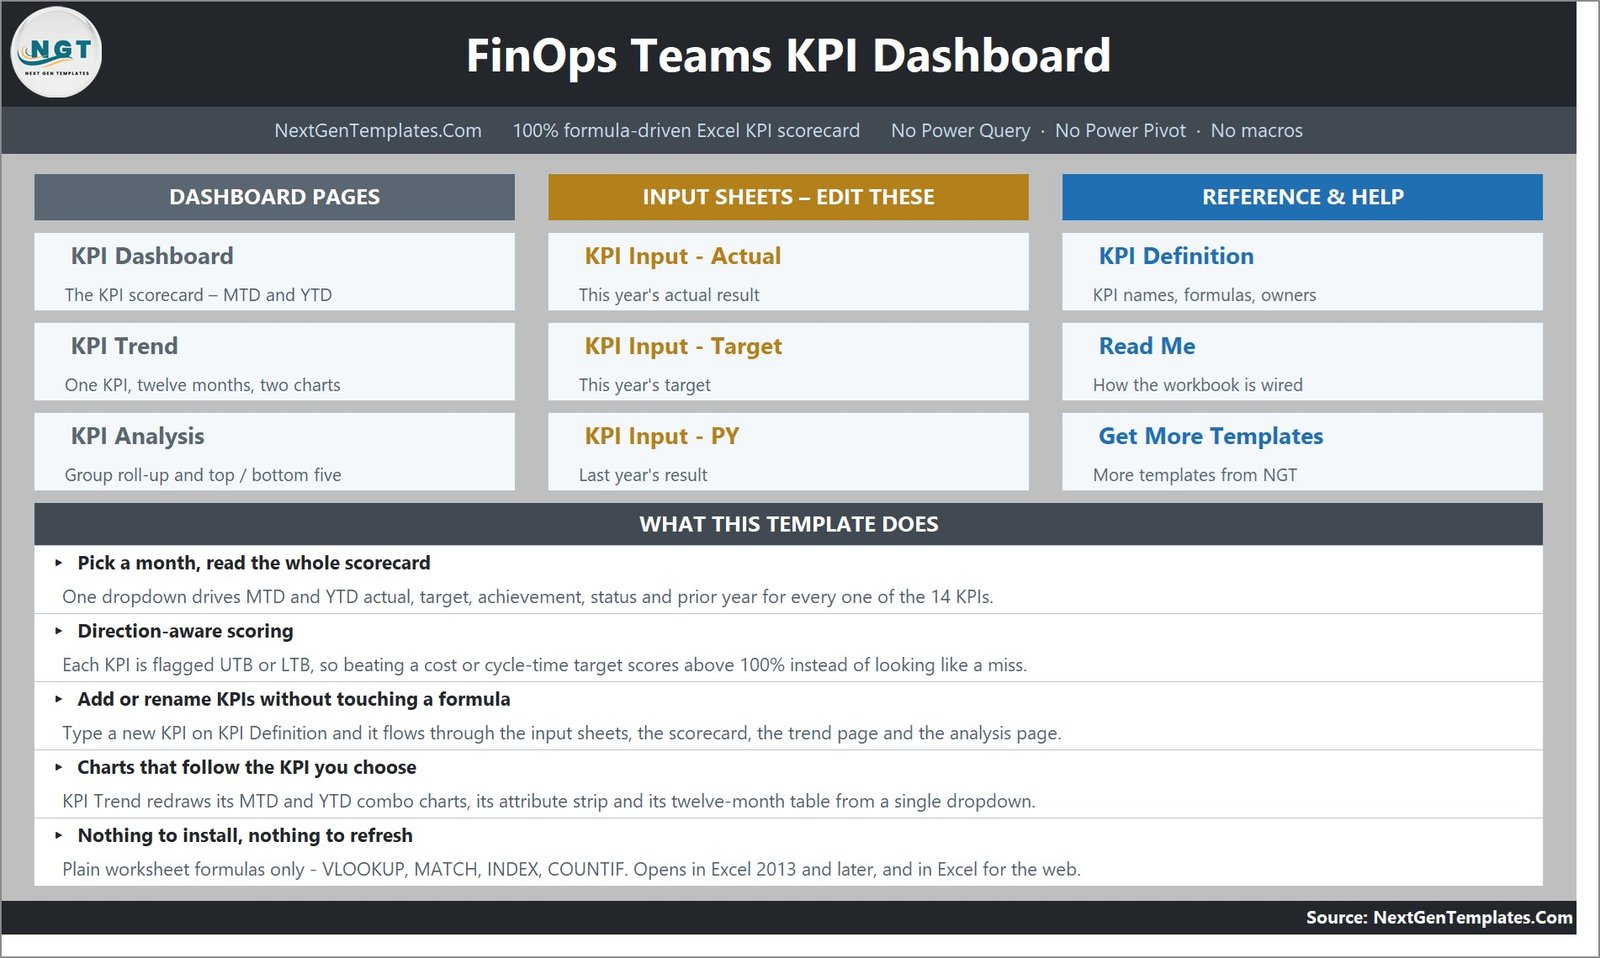
The opening map separates dashboard pages, input sheets, and reference/help sheets. It explains that one month selection drives the full scorecard and that the KPI master list feeds every working page.
KPI Dashboard
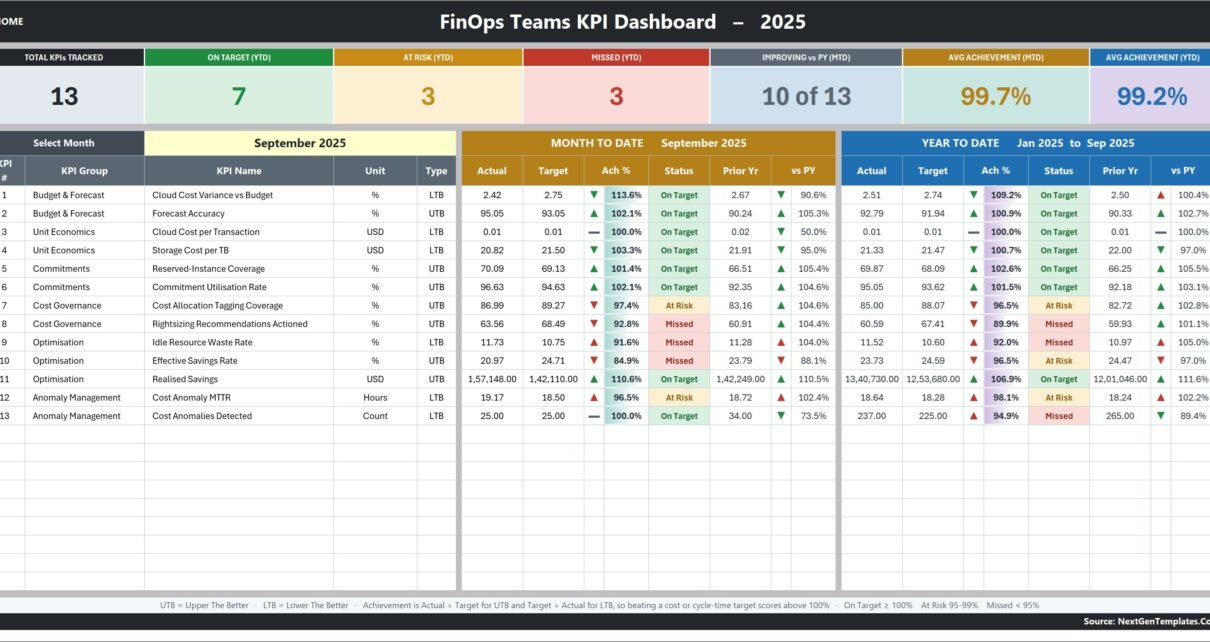
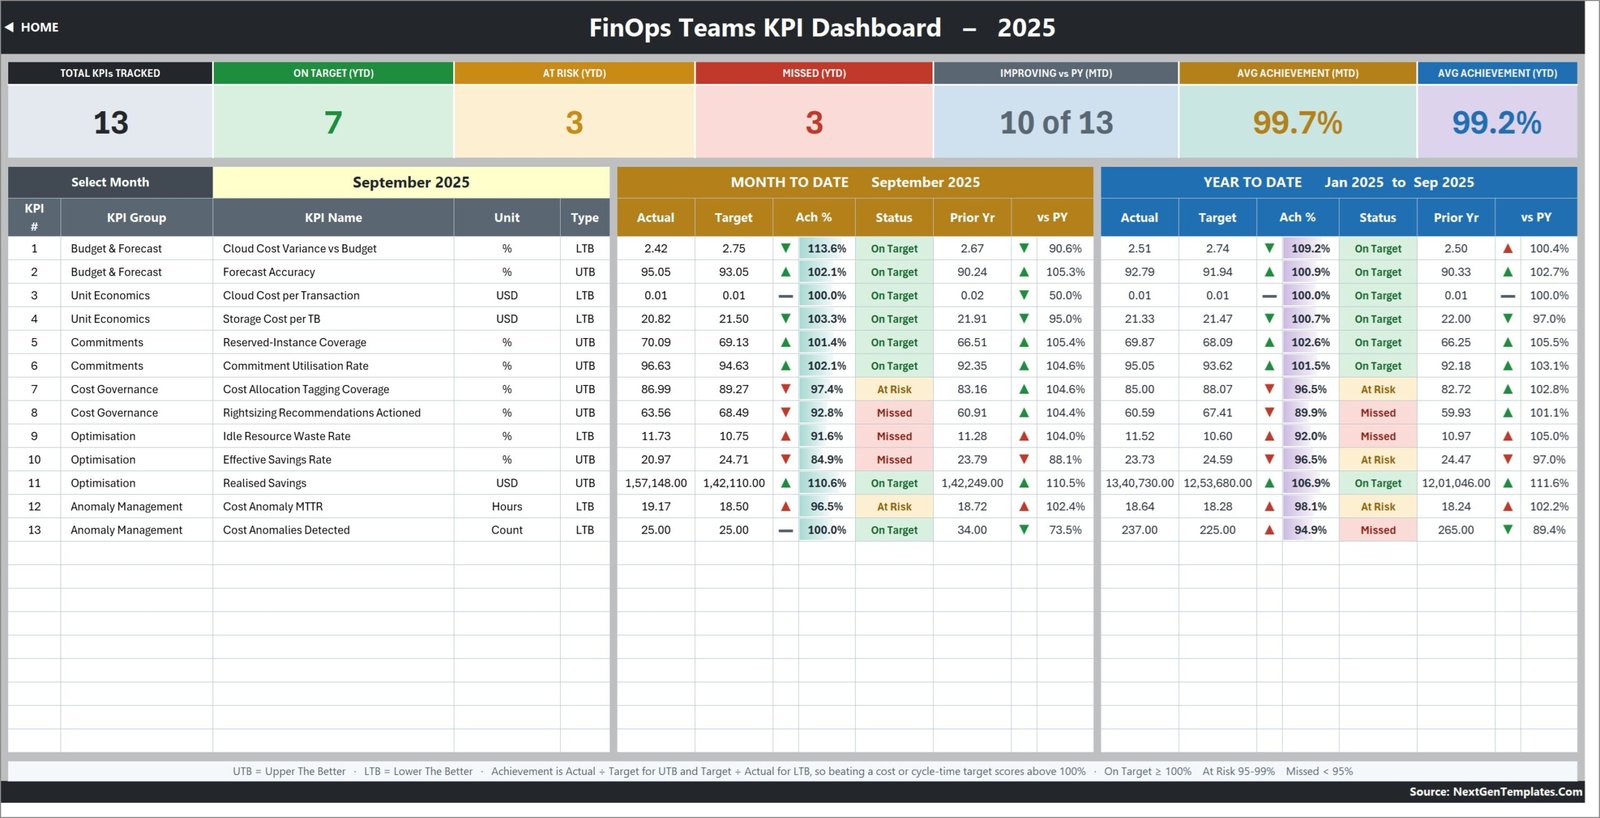
The main scorecard starts with seven executive cards, then lists every KPI in one table. The sample September 2025 view contains 13 KPIs: seven are on target, three are at risk, and three are missed. MTD and YTD blocks each show Actual, Target, Achievement %, Status, Prior Year, and movement versus prior year.
The included KPIs cover Cloud Cost Variance vs Budget, Forecast Accuracy, Cloud Cost per Transaction, Storage Cost per TB, Reserved-Instance Coverage, Commitment Utilisation Rate, Cost Allocation Tagging Coverage, Rightsizing Recommendations Actioned, Idle Resource Waste Rate, Effective Savings Rate, Realised Savings, Cost Anomaly MTTR, and Cost Anomalies Detected.
KPI Trend
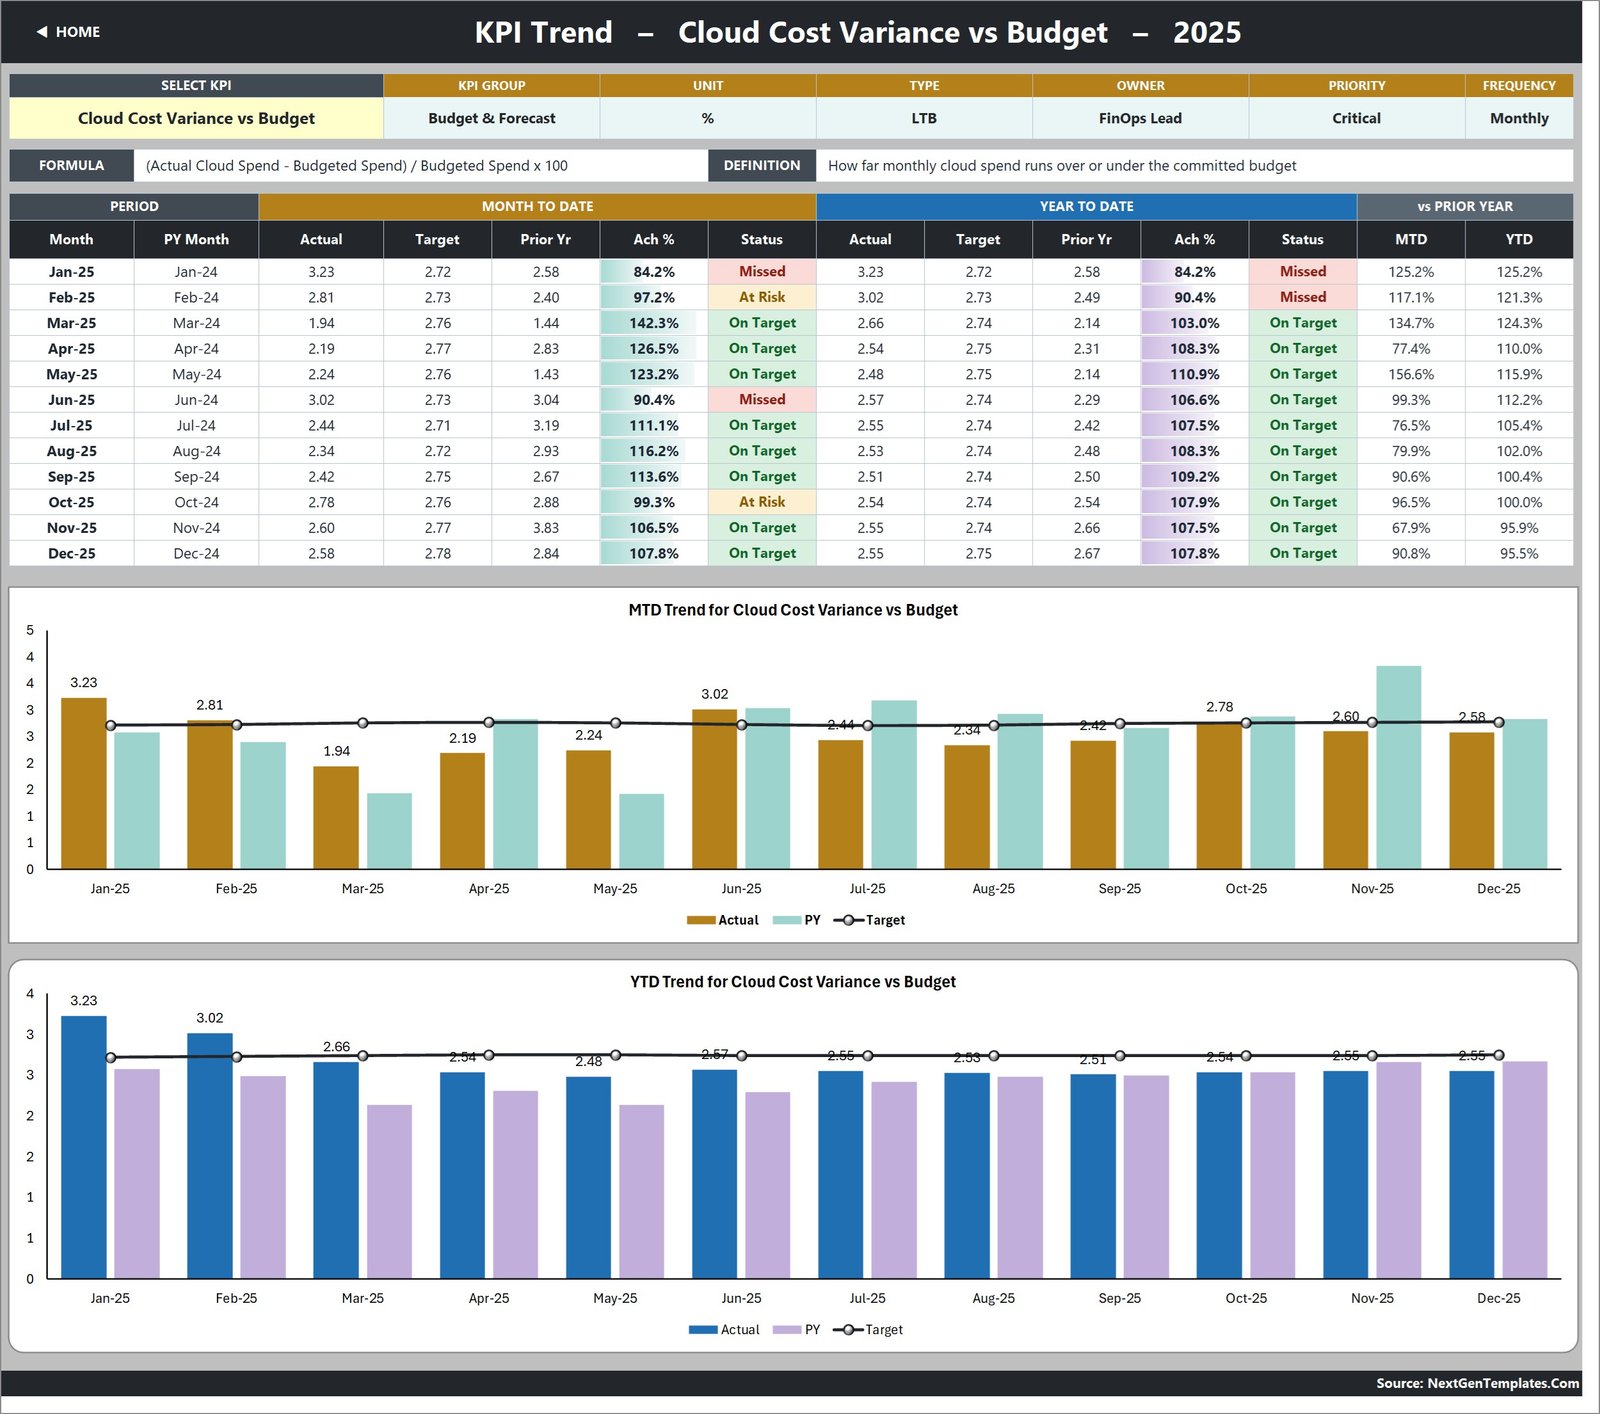
Select a KPI from the dropdown to update the group, unit, UTB/LTB type, owner, priority, frequency, formula, definition, 12-month data table, and two charts. The sample view uses Cloud Cost Variance vs Budget, showing MTD and YTD actuals beside prior year with a target line.
KPI Analysis
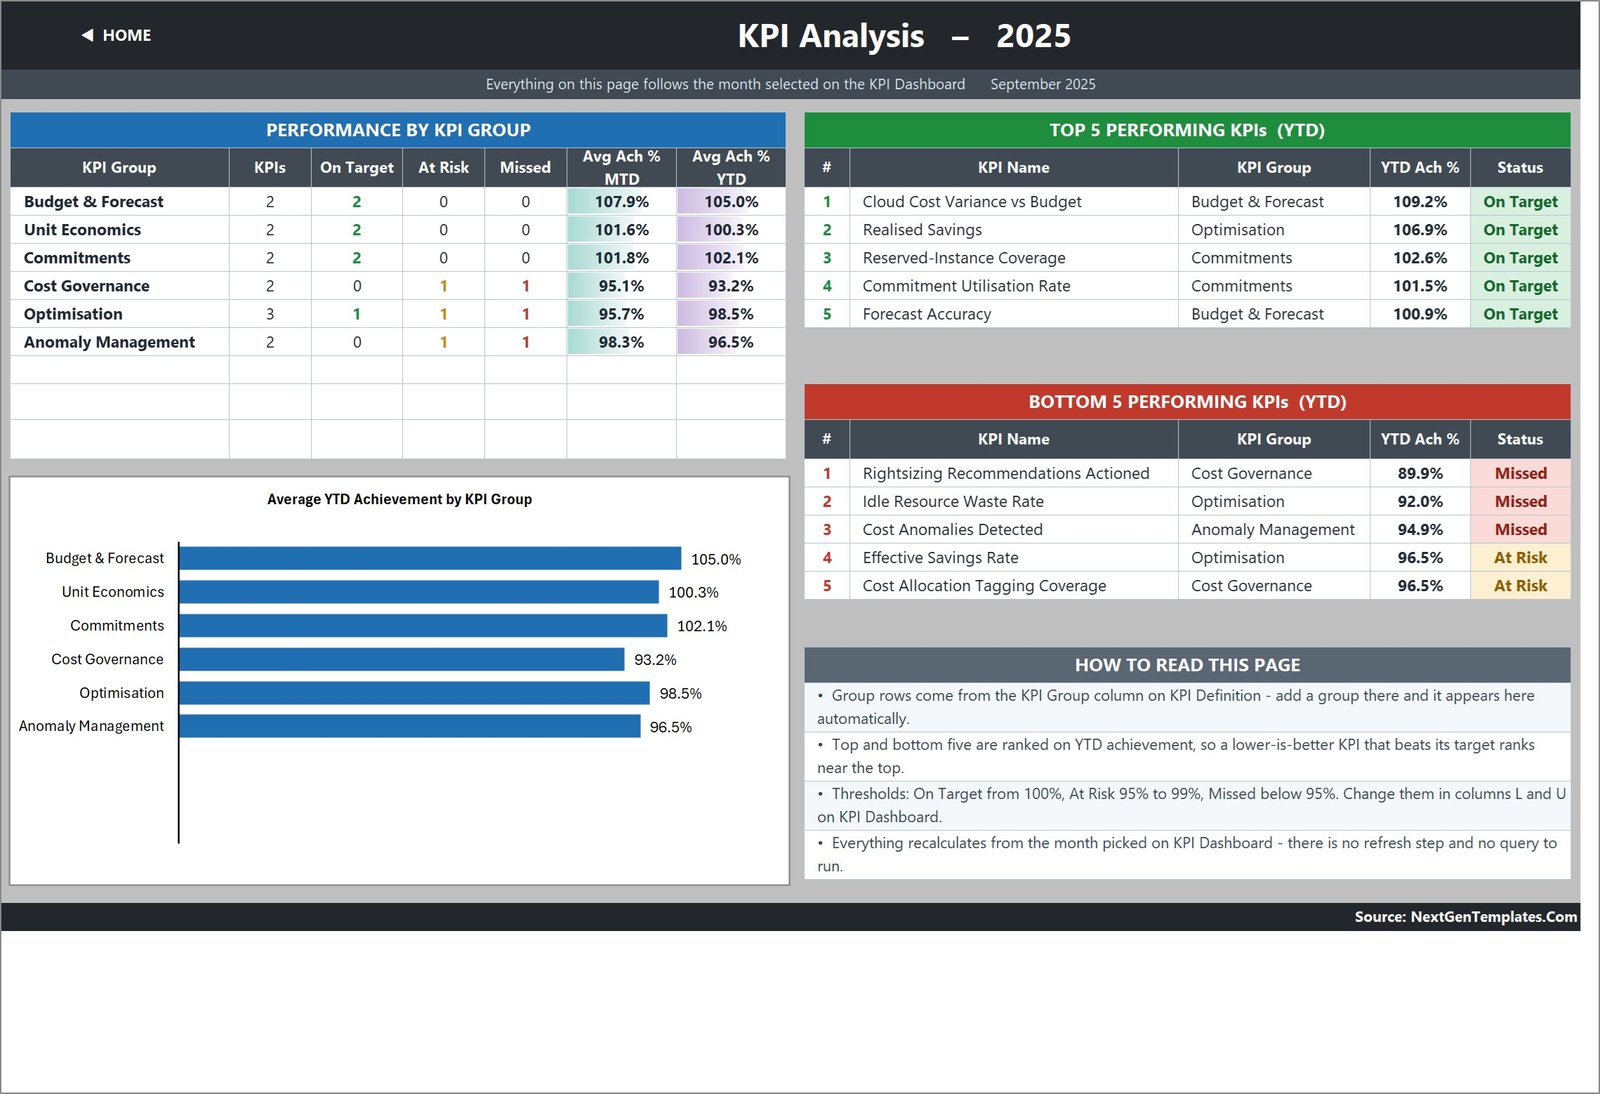
This page follows the month chosen on KPI Dashboard. The left panel compares average MTD and YTD achievement by KPI group. The right panels rank the top five and bottom five KPIs for YTD performance. Direction-aware achievement means an LTB metric that beats its target is not wrongly placed near the bottom.
KPI Input – Actual
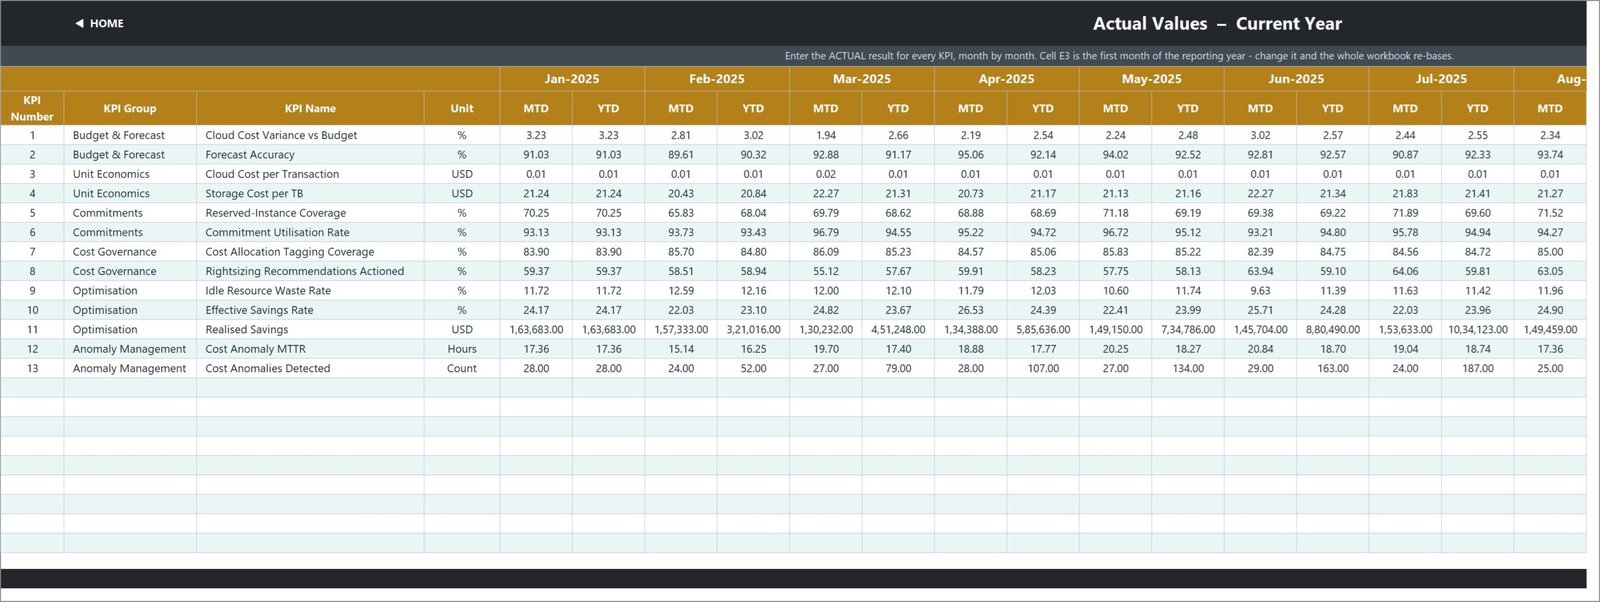
Enter current-year actual results month by month. Each month has separate MTD and YTD columns. Cell E3 establishes the first reporting month, so changing it rebases month headers across the workbook.
KPI Input – Target
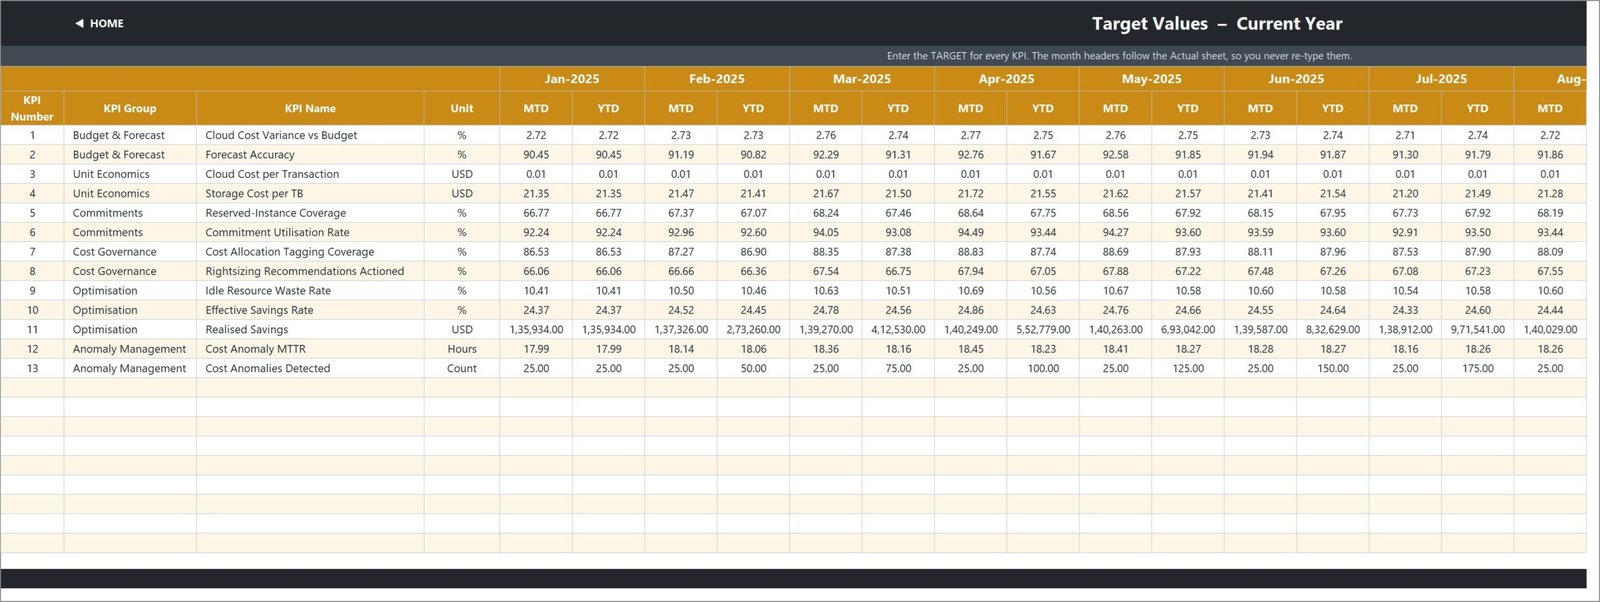
The target sheet mirrors the KPI list and reporting calendar. It keeps target assumptions separate from actual performance and follows the Actual sheet’s month headers.
KPI Input – Prior Year
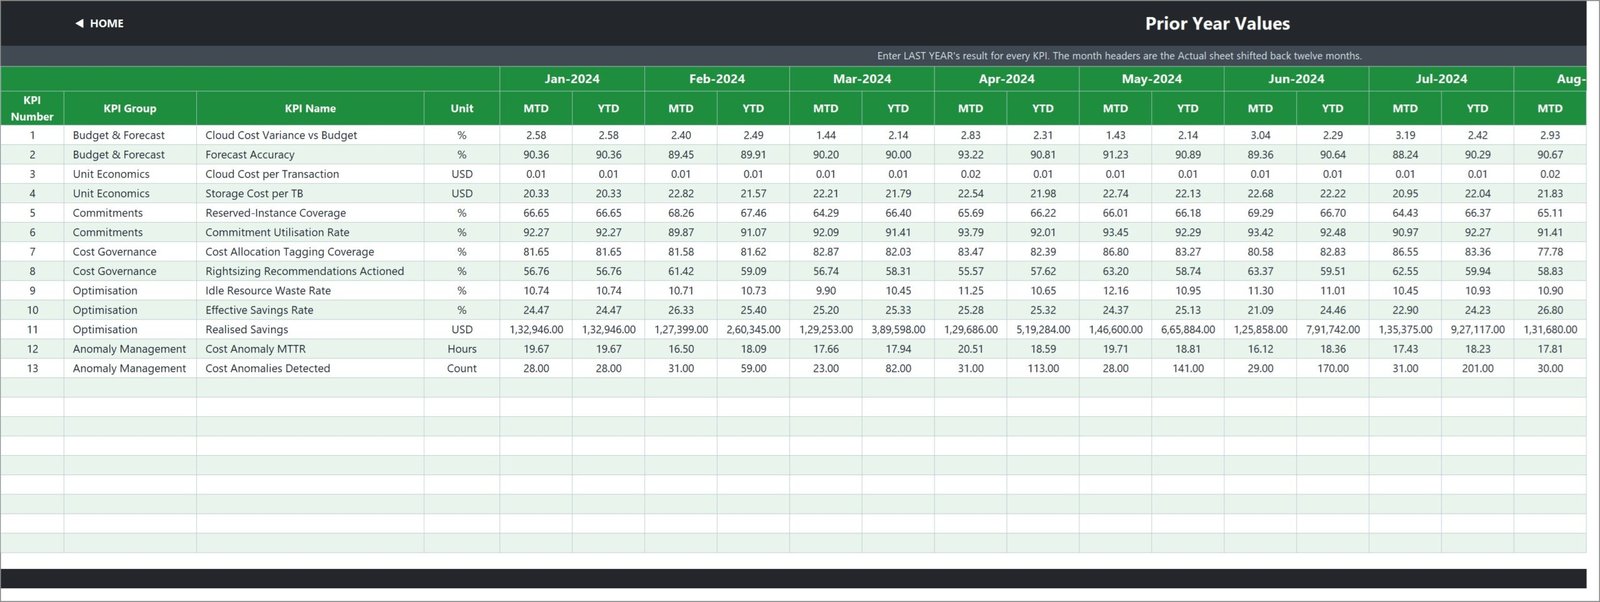
The prior-year sheet stores the MTD and YTD comparison series. These values feed the dashboard movement arrows and the trend page’s prior-year columns.
KPI Definition
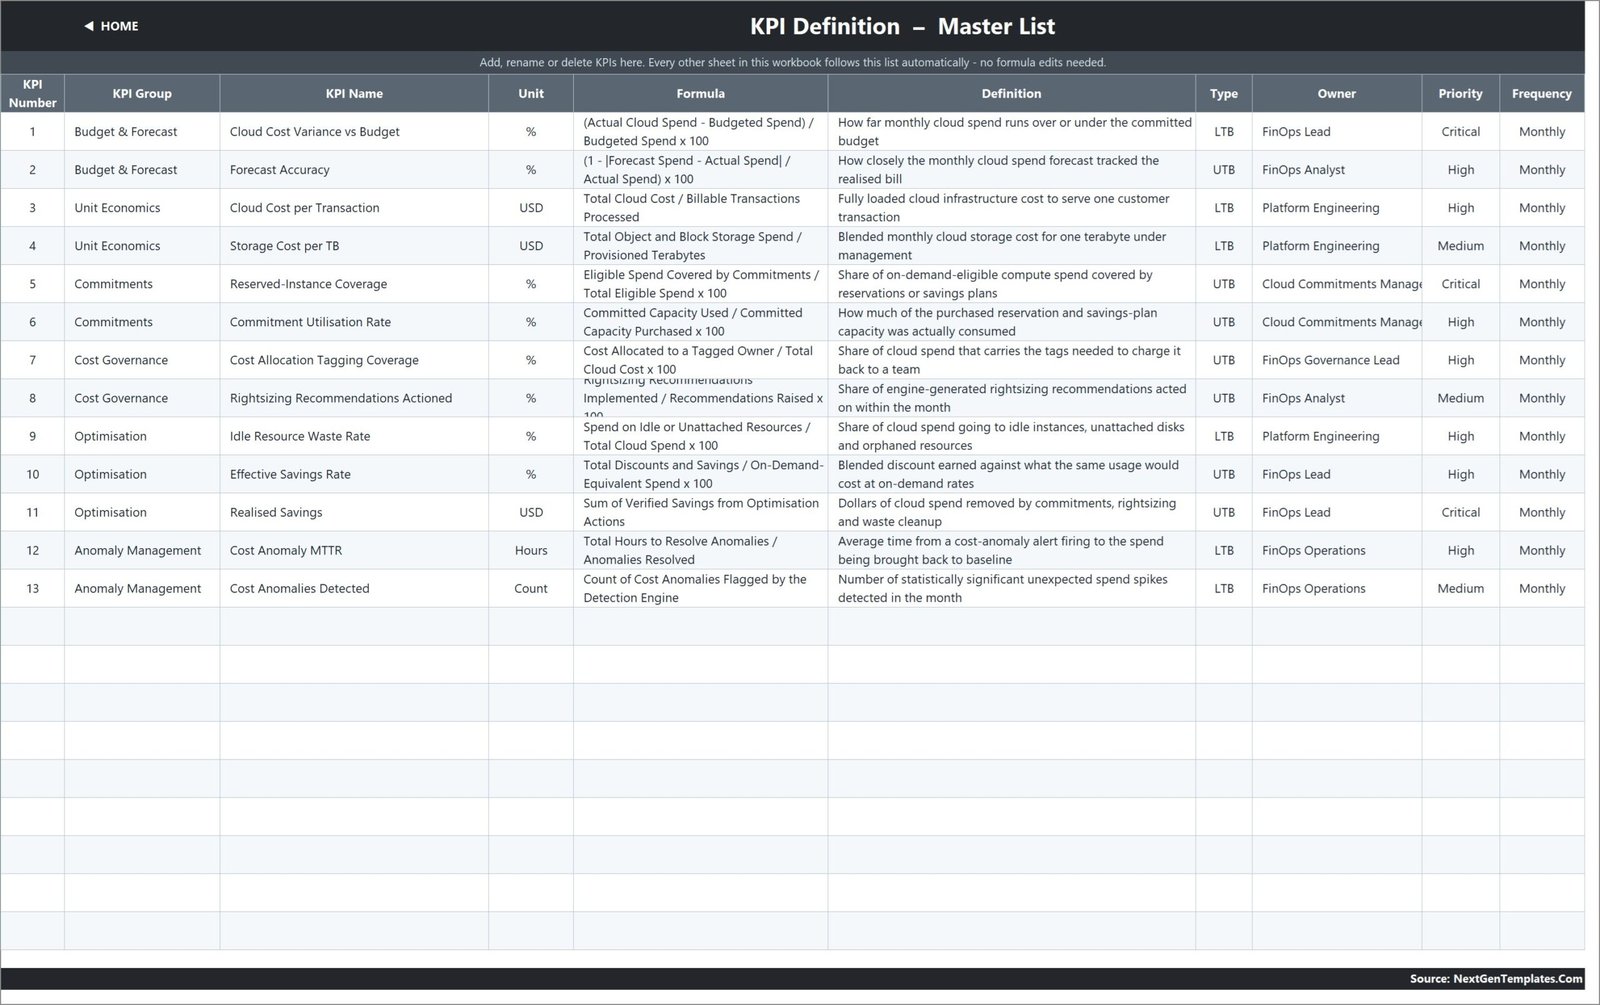
The definition sheet is the workbook’s master list. Each row includes KPI number, group, name, unit, formula, definition, type, owner, priority, and frequency. Edit a KPI here and the name and attributes flow into the other pages without rewriting the dashboard layout.
Read Me
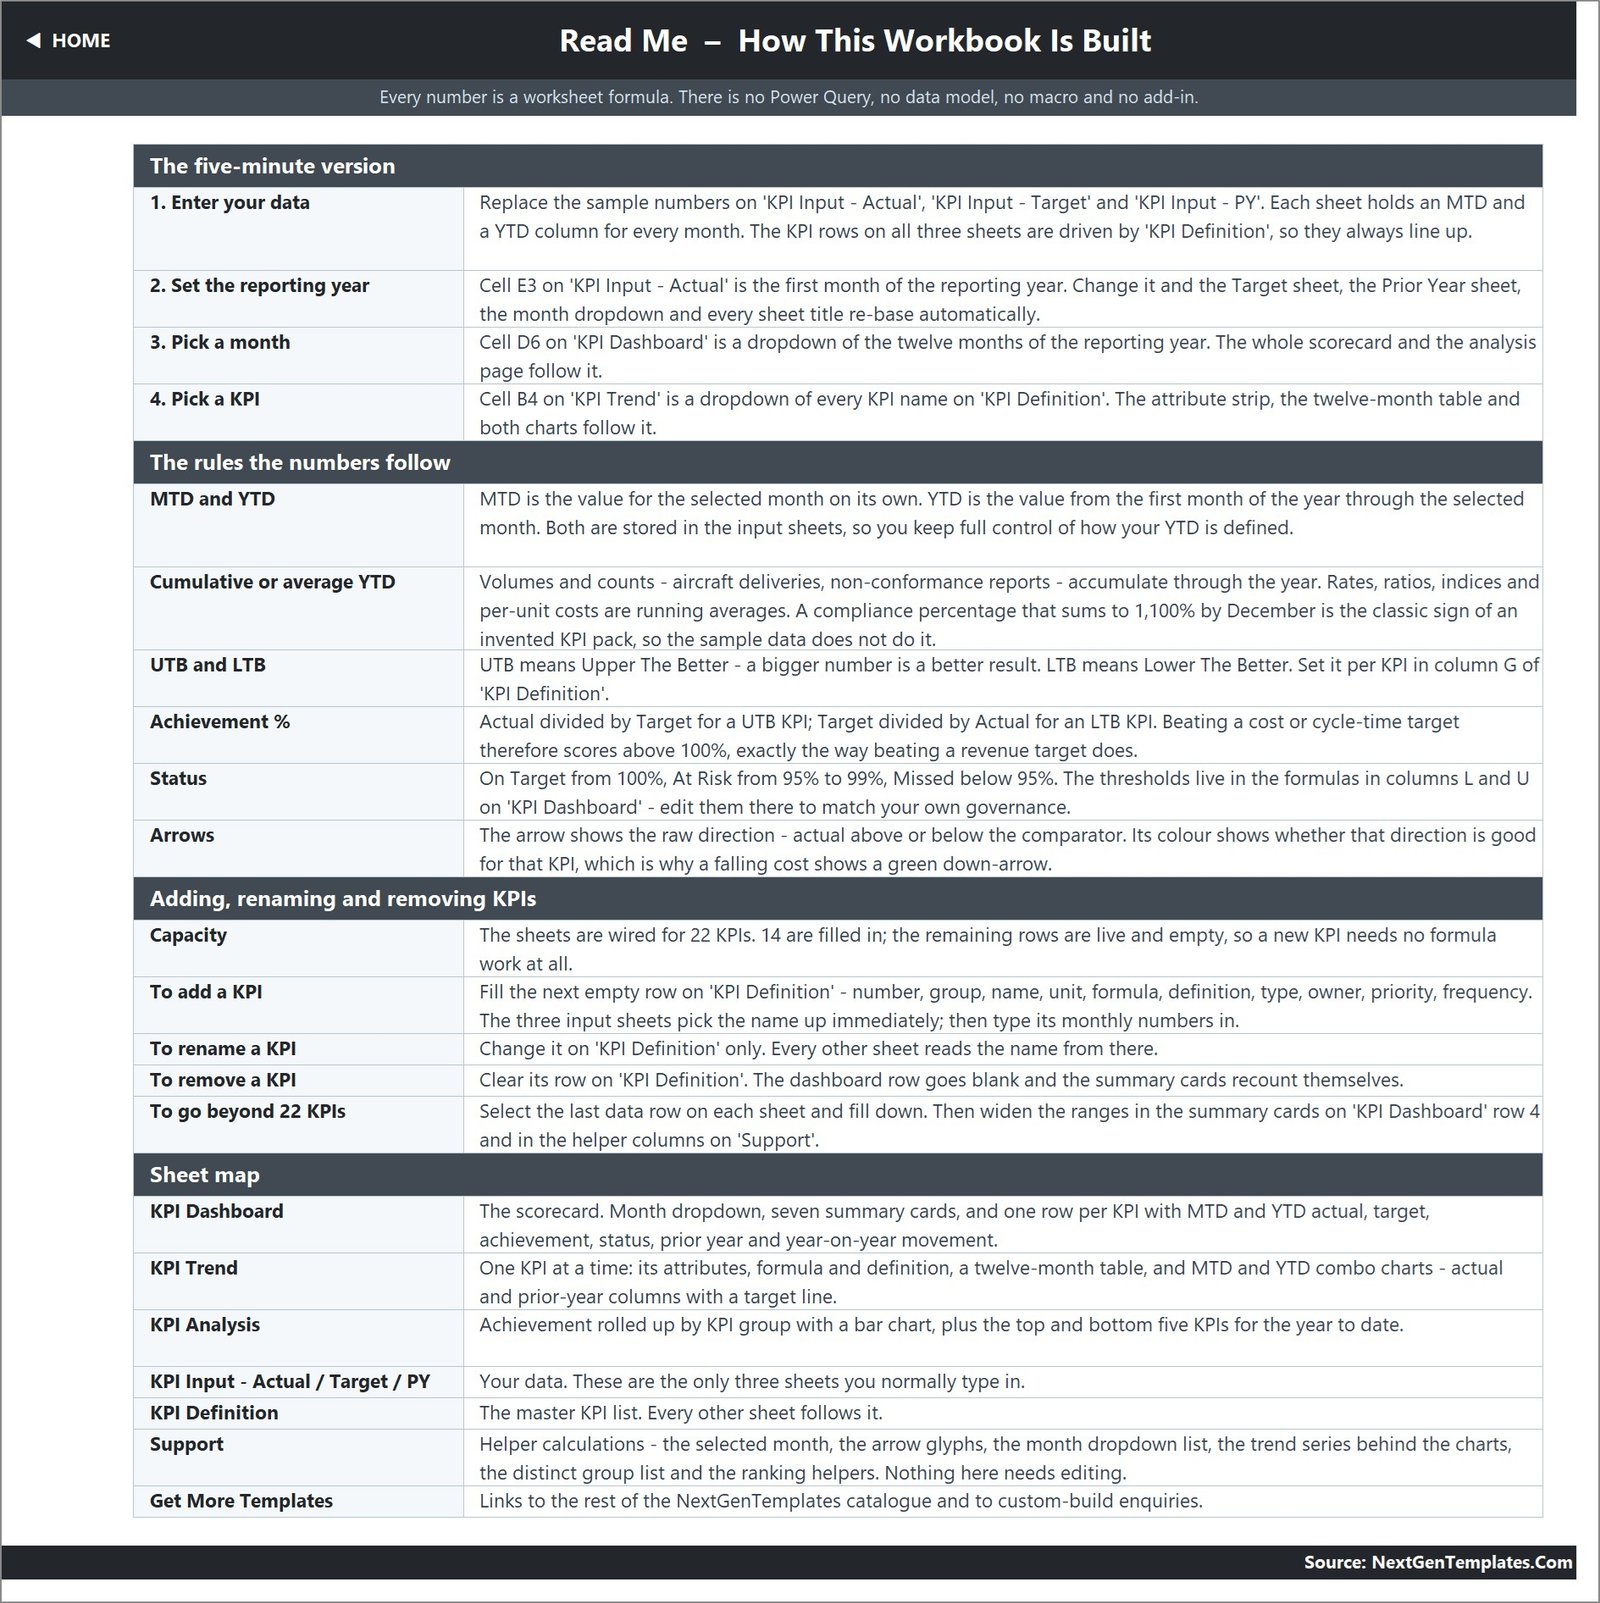
The guide explains the five-minute setup, the distinction between MTD and YTD, cumulative versus average YTD, UTB/LTB scoring, thresholds, arrows, adding and removing KPIs, and the sheet map.
Get More Templates
The final sheet links to other KPI scorecards, analytical dashboards, bundles, and custom dashboard services. It is informational and does not affect calculations.
FinOps Teams KPI Dashboard in Excel vs. Google Sheets vs. Paid FinOps SaaS – Feature Comparison
| Feature | This Excel KPI Dashboard | Google Sheets Alternative | Paid FinOps SaaS |
|---|---|---|---|
| Price | $12.99 one-time sale price | Build or adapt a workbook | Monthly or annual subscription |
| Platform | Excel 2013+, desktop or web | Browser spreadsheet | Vendor cloud platform |
| Setup time | Replace KPI definitions and monthly values | Requires equivalent formula design | Integration and onboarding effort |
| Team collaboration | Via OneDrive or SharePoint | Native link-based collaboration | Role-based access by plan |
| Mobile access | Excel mobile/web limitations apply | Browser or Sheets app | Usually browser-based |
| Custom fields | Editable list, formulas, thresholds, and labels | Editable cells and formulas | Controlled by vendor configuration |
| Share with link | Through Microsoft 365 storage | Built in | Usually login controlled |
| Year-1 cost at 5 users | $12.99 plus existing Excel licenses | Depends on workspace licensing and build time | Often substantially higher |
| Direct cloud billing connection | No | No unless engineered | Often available |
| Management scorecard | 13 sample KPIs, capacity for 22 | Depends on the build | Depends on plan and configuration |
Who Should Use This Template
FinOps leads can use it to run a consistent monthly scorecard review. Cloud finance analysts can separate targets, actuals, and prior-year values while retaining transparent formulas. Platform engineering managers can monitor unit costs, commitment utilisation, rightsizing actions, waste, and anomaly response. Finance business partners can use the status roll-up in leadership packs.
The template is not intended for organisations that require live cloud account ingestion, automated allocation, anomaly alerting, resource remediation, approvals, or audit evidence. It is a reporting workbook for prepared measures, not a substitute for AWS Cost Explorer, Azure Cost Management, Google Cloud Billing, Apptio, CloudHealth, or an accounting system.
Real-World Use Cases
Monthly FinOps Council
Priya, a FinOps lead, selects the reporting month, reviews missed and at-risk KPIs, and uses the owner and priority fields to drive the meeting agenda.
Commitment and Waste Review
Marcus, a platform engineering manager, checks reserved-instance coverage, commitment utilisation, rightsizing recommendations, idle-resource waste, and effective savings rate before renewal decisions.
Leadership Cloud-Finance Pack
Ana, a finance partner, uses MTD/YTD actual, target, prior-year, and achievement figures to explain where performance is improving and where it remains below target.
Advantages of FinOps Teams KPI Dashboard in Excel
The strongest advantage is transparency. Users can inspect every KPI formula and definition, distinguish UTB from LTB metrics, change the reporting year, and extend the list without depending on a black-box model. The separate Actual, Target, and Prior Year sheets simplify monthly ownership. The scorecard and analysis views are ready for management discussion, while the trend page gives one KPI enough space for diagnosis.
The workbook also avoids a technical deployment. There is no database, refresh gateway, macro security prompt, or add-in. Microsoft documents Excel collaboration through co-authoring in supported Microsoft 365 environments, so teams can place the file in OneDrive or SharePoint when controlled collaboration is required.
Opportunities for Improvement
Two source-level presentation issues should be reviewed before final publication. First, USD totals such as Realised Savings display Indian-style digit grouping (for example, 1,57,148.00) rather than international grouping. The values are intact, but the number format may not suit every audience. Second, the Read Me page says 14 KPIs are filled even though the visible workbook contains 13, and its cumulative-YTD example still mentions aircraft deliveries and non-conformance reports from another industry template. These are documentation/formatting issues, not broken calculations, but correcting them would make the FinOps package cleaner.
The workbook also requires manual monthly inputs. That is useful for control and portability, but teams needing automated ingestion should add a governed export process or choose a connected FinOps platform.
Best Practices
- Agree KPI owners, definitions, units, and direction types before entering results.
- Use consistent month-end cut-offs for actual, target, and prior-year series.
- Validate whether YTD should be cumulative or averaged for each KPI.
- Review status thresholds against your governance policy; the sample uses On Target from 100%, At Risk from 95% to 99%, and Missed below 95%.
- Keep a controlled source for the monthly figures entered into the workbook.
- Protect formula cells and restrict edits if the workbook is shared widely.
- Do not treat the sample figures as benchmarks or financial advice.
Explore Relevant Templates
- FinOps Teams KPI Dashboard in Excel – this KPI scorecard template.
- FinOps Teams Dashboard in Excel – record-level Excel analytics with pivots and slicers.
- FinOps Teams Dashboard in Power BI – interactive Power BI analytics.
- Mobile Banking KPI Dashboard in Excel.
- WealthTech KPI Dashboard in Excel.
- Browse all Excel KPI Dashboard templates.
Frequently Asked Questions
How many KPIs are included?
The visible sample list contains 13 KPIs in six groups. The wired template has space for 22 KPIs.
Does the workbook use macros?
No. It uses standard Excel worksheet formulas and does not require macros, Power Query, Power Pivot, or an add-in.
Can I change the KPI names and formulas?
Yes. Edit the KPI Definition sheet, then enter matching actual, target, and prior-year values.
What are UTB and LTB?
Upper The Better and Lower The Better determine how achievement is calculated. A lower cost can therefore score above 100% when it beats target.
Does it connect to cloud providers?
No. It expects prepared monthly KPI values. Build your own export or integration process if automation is required.
Can I change the reporting year?
Yes. Change the first month on the Actual input sheet and the reporting calendar rebases throughout the workbook.
Is this the same as the analytical FinOps dashboard?
No. This product is a KPI scorecard with month/KPI selectors and traffic lights. The analytical dashboard uses detailed records, pivots, slicers, and multiple analysis pages.
About the Author
Built by PK – Microsoft Certified Professional with 15+ years of Excel, Google Sheets, and Power BI experience. Founder of NextGenTemplates, reaching 300K+ subscribers across YouTube channels. Every template is hand-built and tested before release.
Conclusion
The FinOps Teams KPI Dashboard in Excel gives cloud-finance teams a clear monthly operating rhythm: define the measures, enter actuals and targets, select a month, review status, investigate one KPI, and compare performance by group. If transparent formulas and portable Excel reporting fit your process, download the template from NextGenTemplates. For more Excel and Power BI tutorials, visit PK: An Excel Expert on YouTube.