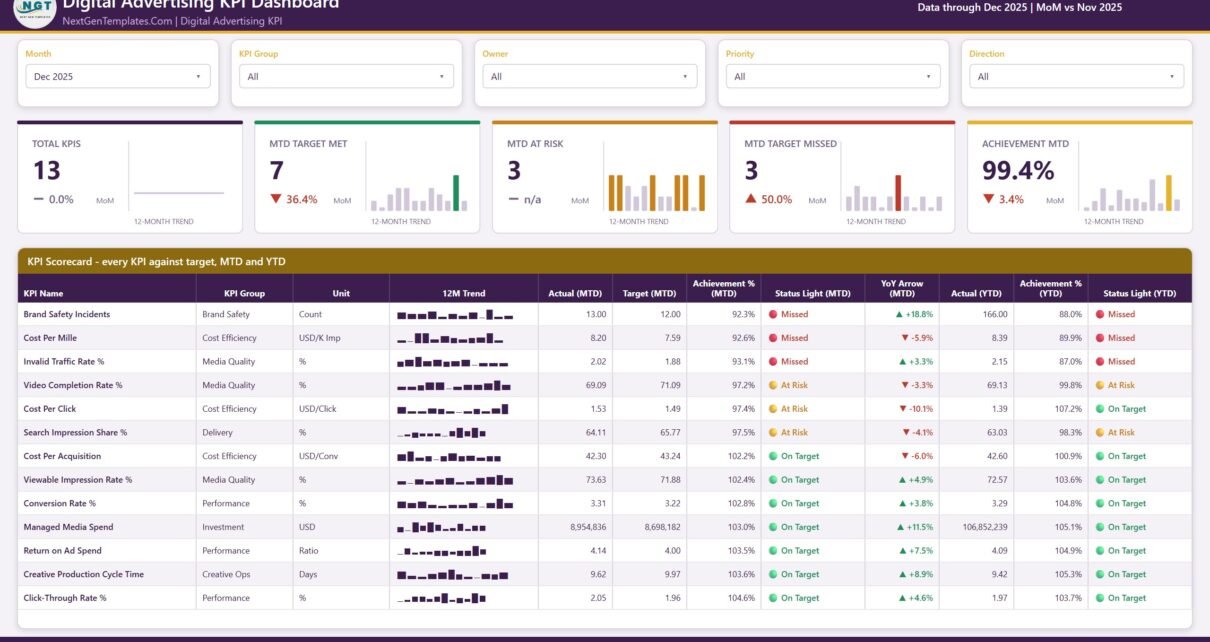
Digital advertising reporting becomes difficult when cost, quality, delivery, conversion, and brand-safety measures use different units and different definitions of success. The Digital Advertising KPI Dashboard in Power BI turns 13 approved KPIs into one target-led scorecard with monthly and year-to-date results. It shows seven targets met, three at risk, and three missed in the December 2025 sample, alongside an overall MTD achievement of 99.4%. These values are sample data, not benchmarks or expected results.
The template includes four visible Power BI pages, two hidden tooltip pages, a PBIX file, Data.xlsx, and a user manual. It is designed for teams that already collect and approve their advertising figures and want a consistent review layer. It does not connect directly to Google Ads, Meta Ads, LinkedIn Ads, or other networks.
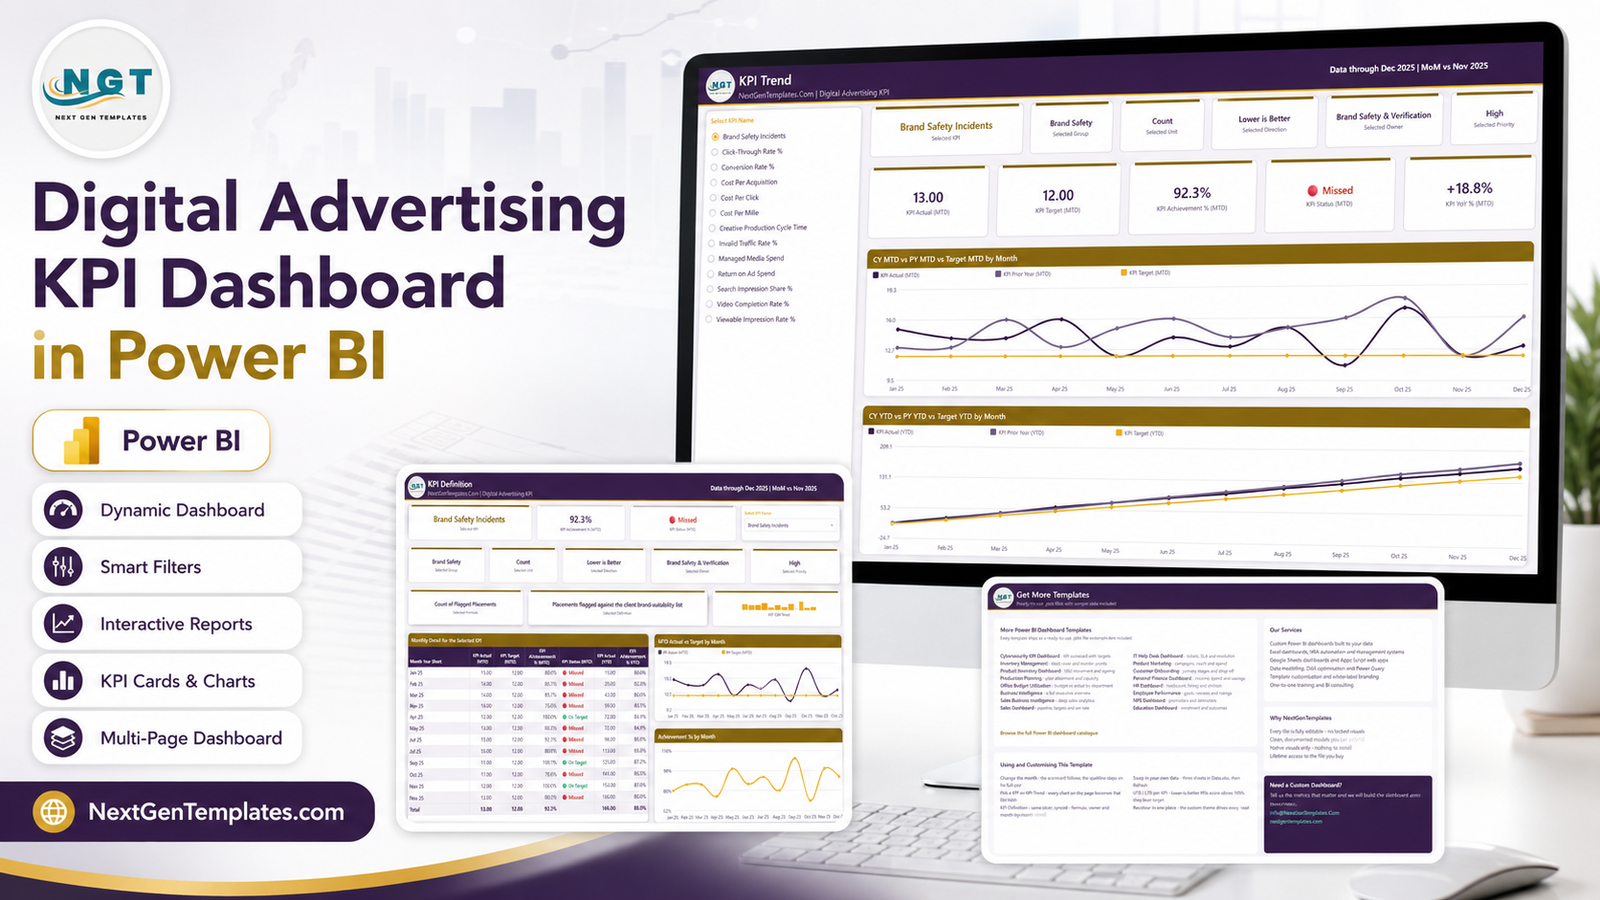
Digital Advertising KPI Dashboard in Power BI
Get the Digital Advertising KPI Dashboard in Power BI.
Key Features of Digital Advertising KPI Dashboard in Power BI
- 13 preconfigured KPIs spanning performance, cost efficiency, delivery, media quality, investment, creative operations, and brand safety.
- MTD and YTD views so a single-month result is not confused with cumulative performance.
- Target and prior-year comparisons with achievement percentages, status lights, and year-over-year arrows.
- Lower-is-better and upper-is-better logic so cost and incident measures are scored in the correct direction.
- Five filters for Month, KPI Group, Owner, Priority, and Direction.
- 12-month trend context through sparklines and full-size actual-versus-target charts.
- Editable KPI definitions with formula, unit, owner, priority, and plain-language description.
- Separate Data.xlsx source for actuals, targets, prior-year values, and KPI metadata.
- Editable Power BI file built with native visuals; no custom visual installation is required.
Dashboard Pages Explanation
KPI Scorecard Page
The scorecard is the portfolio view. Its five headline cards summarize total KPIs, targets met, KPIs at risk, missed targets, and overall MTD achievement. The Month selector changes the reporting period, while KPI Group, Owner, Priority, and Direction allow focused reviews.
The table names all 13 included measures: Brand Safety Incidents, Cost Per Mille, Invalid Traffic Rate, Video Completion Rate, Cost Per Click, Search Impression Share, Cost Per Acquisition, Viewable Impression Rate, Conversion Rate, Managed Media Spend, Return on Ad Spend, Creative Production Cycle Time, and Click-Through Rate. For each KPI, it presents unit, 12-month sparkline, MTD actual and target, MTD achievement and status, year-over-year movement, YTD actual, YTD achievement, and YTD status.
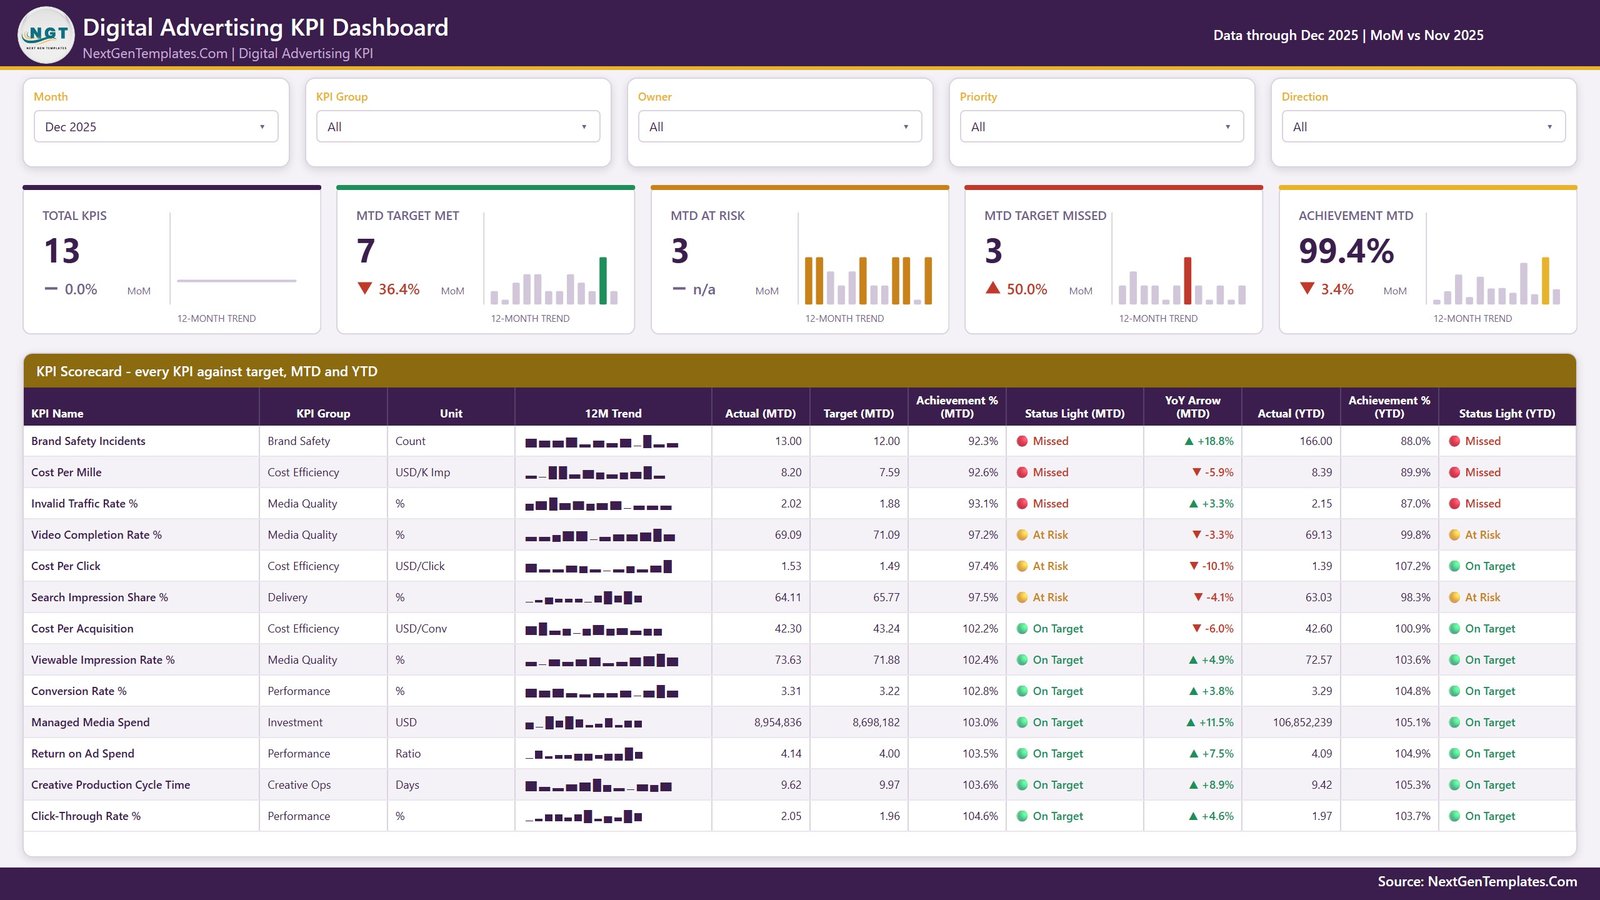
KPI Scorecard page
KPI Trend Page
The Trend page moves from portfolio monitoring to one-KPI analysis. A selector on the left changes every card and chart. The selected KPI’s group, unit, direction, owner, and priority stay visible, reducing the chance that a viewer interprets a cost KPI like a growth KPI.
The upper chart compares current-year MTD, prior-year MTD, and monthly target. The lower chart compares cumulative YTD values with prior year and YTD target. This separation helps a paid-media manager see whether a recent change is temporary or part of a longer pattern.
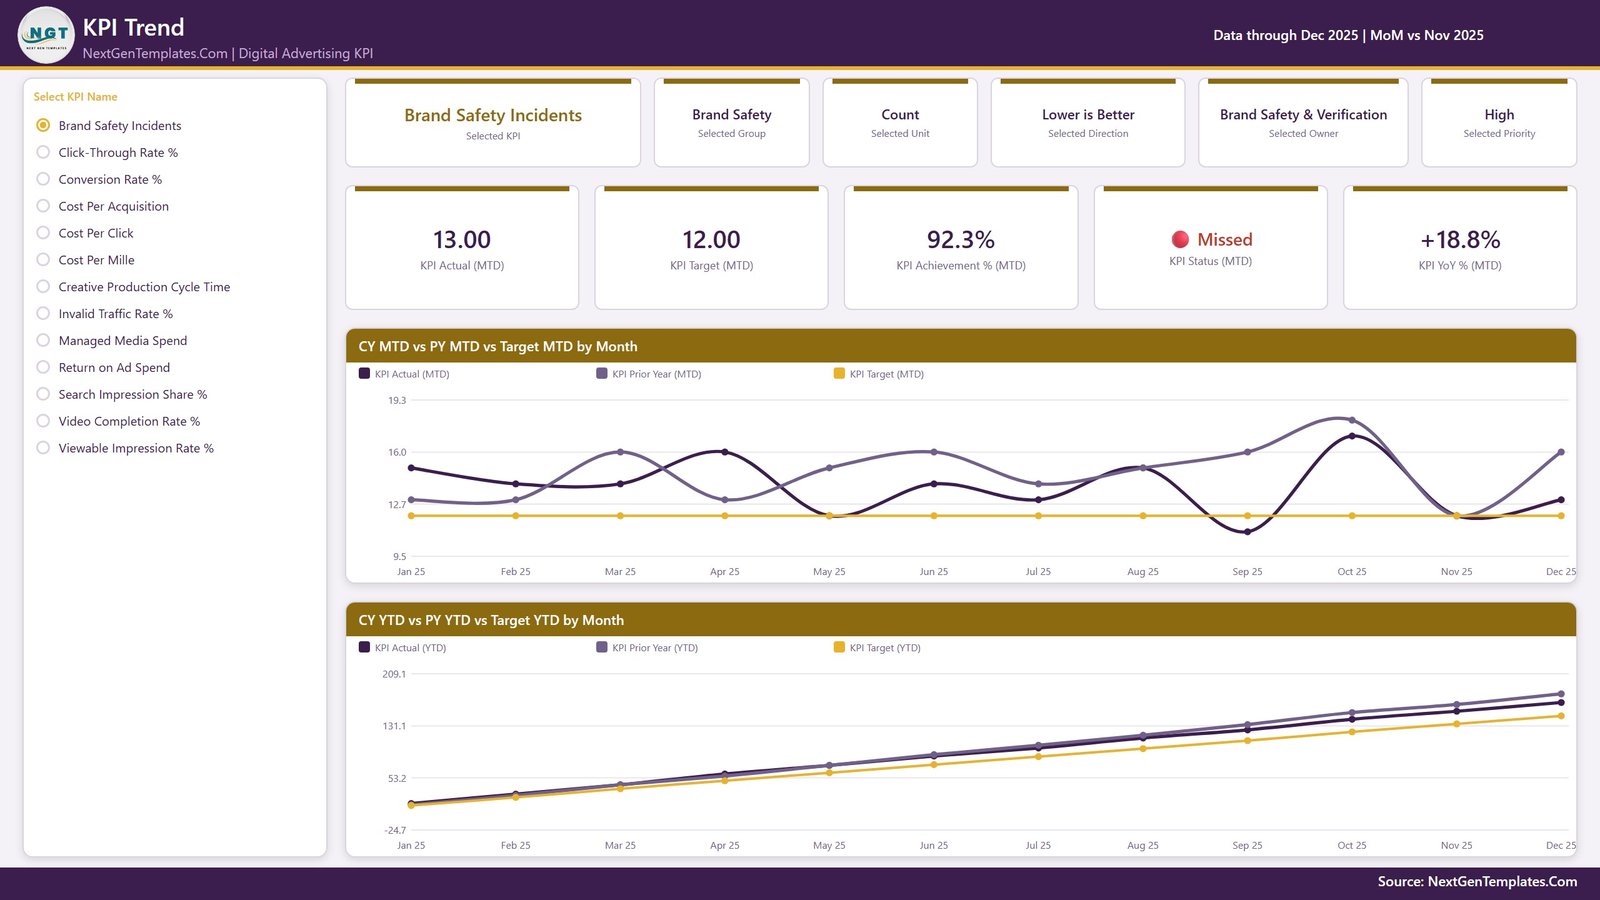
KPI Trend page
KPI Definition Page
The Definition page places meaning beside performance. It shows the selected KPI’s formula, description, owner, group, unit, direction, and priority. A monthly detail table lists actual, target, achievement, status, YTD actual, and YTD achievement for January through December.
Two charts show MTD actual versus target and achievement percentage by month. The page uses the same KPI selection pattern as the Trend page. It is a standard interactive page rather than a drillthrough page, which makes it easy to demonstrate during a meeting.
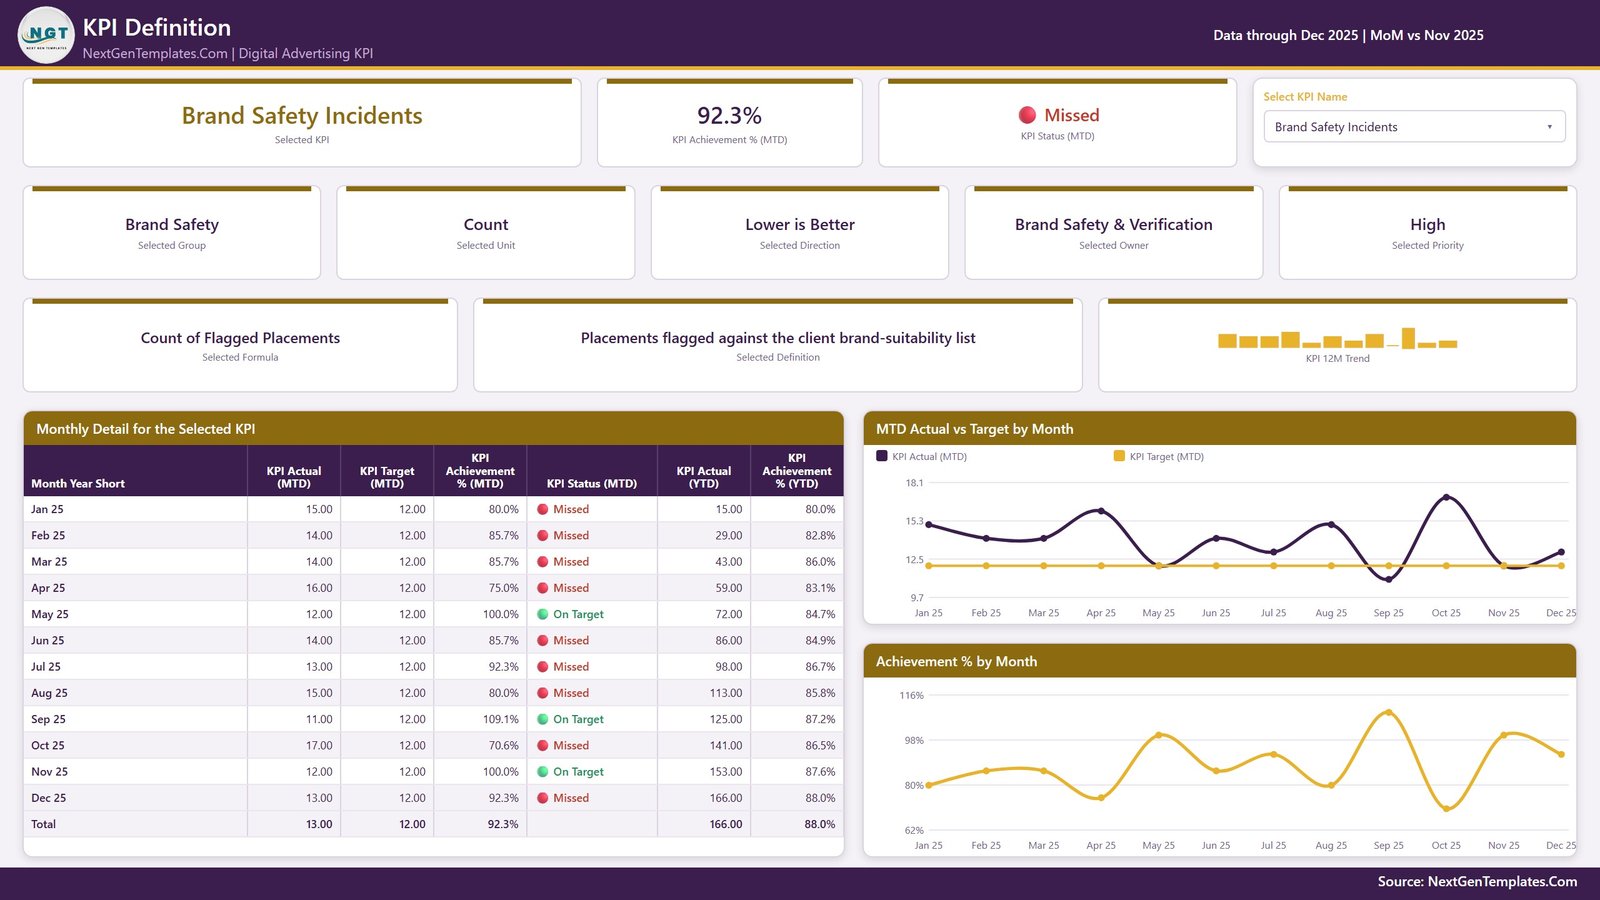
KPI Definition page
Get More Templates Page
The fourth visible page provides links to other NextGenTemplates dashboards, a summary of customization services, and concise instructions for changing the month, updating Data.xlsx, using UTB/LTB scoring, and applying the report theme.
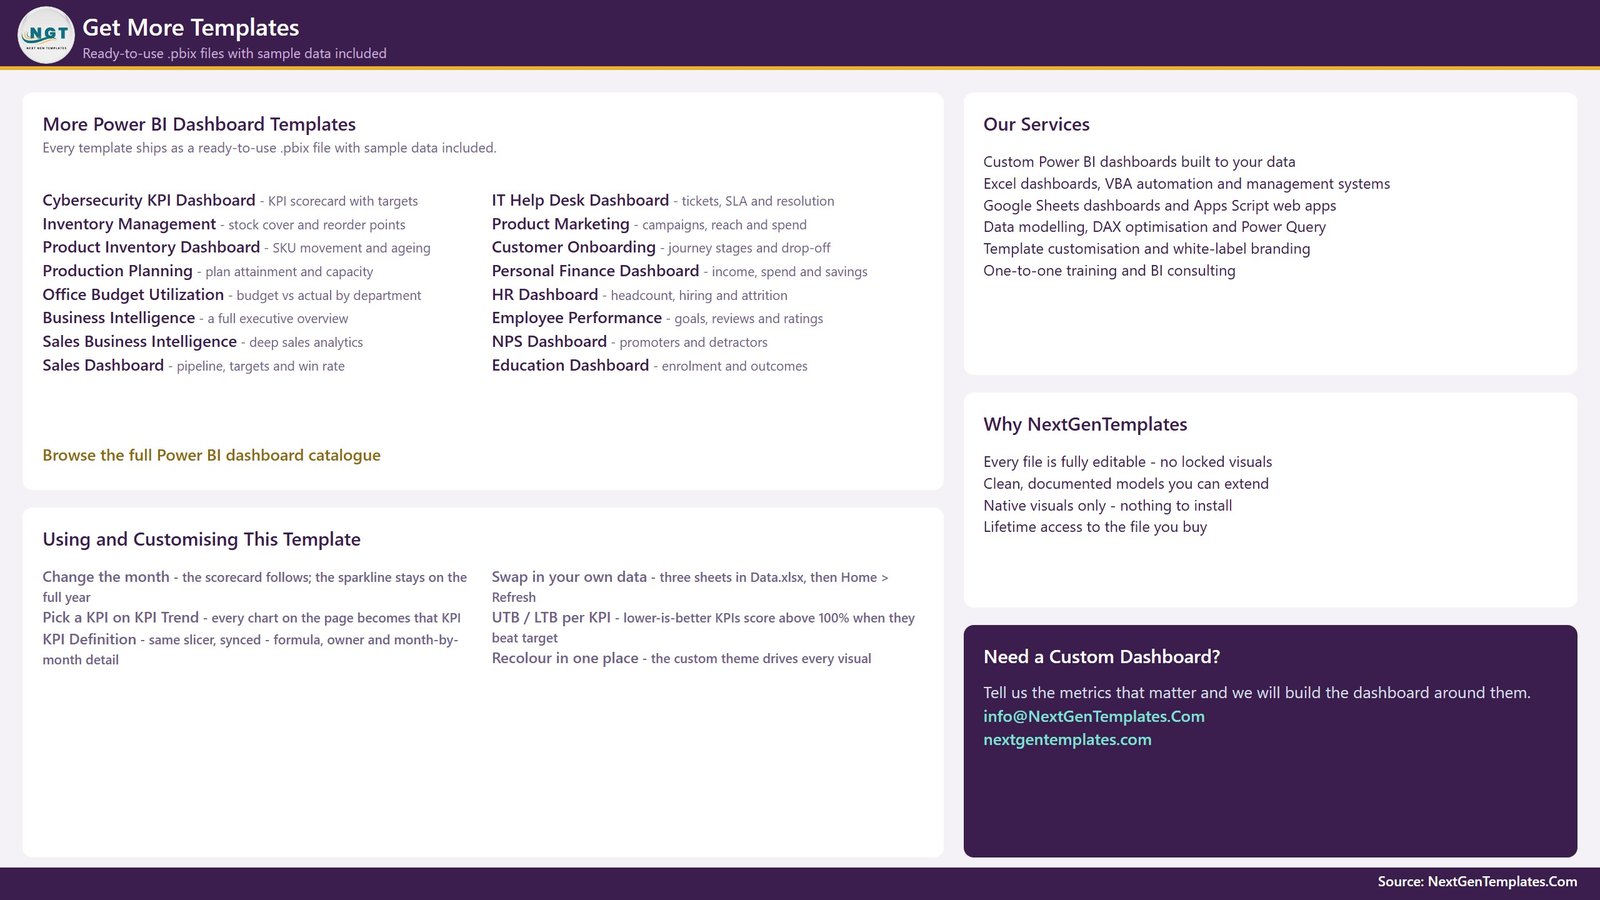
Get More Templates page
Digital Advertising KPI Dashboard in Power BI vs. Tableau vs. Paid Marketing SaaS – Feature Comparison
| Feature | Power BI KPI template | Tableau or Qlik alternative | Paid marketing SaaS |
|---|---|---|---|
| Purchase model | $12.99 sale price, one time | License plus report development | Recurring plan |
| Platform | Power BI Desktop; optional Power BI Service | Tableau or Qlik | Vendor cloud |
| Setup | Update Data.xlsx and refresh | Build or adapt model | Connect accounts and configure |
| Target scorecard | Included | Custom build | Plan dependent |
| Direction-aware scoring | UTB/LTB included | Custom calculation | Vendor dependent |
| Custom fields | Editable source and PBIX | Editable with BI skills | Limited by platform |
| Live network data | Not included | Requires connectors | Often supported |
| Sharing with five users | Microsoft licensing may apply | Cloud/server licensing may apply | Usually seat based |
| Data ownership | Your local files and environment | Your configured environment | Vendor environment and terms |
Who Should Use This Template
Performance marketing managers can use the scorecard to review ROAS, CPA, CPC, CPM, CTR, conversion rate, impression share, and spend without losing the direction of each measure. Agency account leads can organize monthly client reviews around agreed targets, ownership, and status. Marketing operations analysts can maintain KPI definitions and use the trend pages to explain movement. Brand and media-quality teams can include approved incident, invalid-traffic, viewability, and completion metrics in the same review framework.
This template is not intended for teams looking for live media buying, bid automation, campaign creation, identity resolution, attribution modeling, fraud detection, or brand-safety verification. It reports the values you load; it does not independently verify them.
Real-World Use Cases
Monthly Agency Review
An agency exports approved figures from its advertising systems, standardizes them in Data.xlsx, refreshes the PBIX, and starts the meeting with the three missed and three at-risk KPIs. The Trend page then provides the 12-month context for each exception.
Executive Marketing Scorecard
A marketing director filters the portfolio by owner and priority, reviews MTD and YTD achievement, and separates immediate variance from longer-term performance. The scorecard creates a repeatable agenda while leaving campaign-level diagnosis to the source systems.
KPI Governance Workshop
A marketing operations team reviews each formula, unit, owner, direction, and definition. The Definition page helps expose inconsistent meanings before results reach executive reporting.
Advantages of Digital Advertising KPI Dashboard in Power BI
- It distinguishes scorecard monitoring from detailed campaign analysis.
- It keeps MTD, YTD, target, and prior-year context together.
- It scores cost and incident measures differently from growth measures.
- It makes KPI ownership and definition visible, not hidden in a separate document.
- It provides a repeatable monthly review without a new SaaS subscription.
- It is editable, so teams can align labels and targets with internal governance.
Opportunities for Improvement
The template does not include direct connectors to ad networks, a data warehouse, or an API. It also does not include automated data validation, attribution analysis, campaign-level drilldown, forecasting, alerts, or workflow approvals. Those are sensible future enhancements when a team has stable source systems and defined governance.
The included figures are demo data through December 2025. Replace them before operational use. KPI formulas and thresholds vary by organization, network, region, buying method, and measurement policy, so every definition should be reviewed by the responsible owner.
Best Practices
- Agree definitions first: document the numerator, denominator, period, inclusion rules, and owner for every KPI.
- Preserve the source structure: update values in Data.xlsx without casually renaming or removing expected columns.
- Refresh and reconcile: compare a small sample with the source platform after every data update.
- Use targets deliberately: avoid copying benchmarks that do not match your market, buying model, or campaign objective.
- Separate monitoring from diagnosis: use this scorecard to find exceptions, then investigate in campaign-level tools.
- Control access: apply your organization’s Power BI workspace and data-sharing policies.
- Learn the platform: consult the official Microsoft Power BI Desktop documentation for refresh, modeling, and publishing guidance.
Explore Relevant Templates
- Digital Advertising KPI Dashboard in Google Sheets – the cross-platform scorecard alternative.
- Digital Marketing Campaign Dashboard in Power BI – campaign and channel analysis.
- MarTech Dashboard in Power BI – wider marketing technology reporting.
- Advertising Dashboard in Power BI – broader advertising analytics.
- Power BI KPI Dashboard templates – browse the KPI scorecard category.
Frequently Asked Questions
Does the dashboard connect to Google Ads, Meta Ads, or LinkedIn Ads?
No. You provide the approved data through Data.xlsx and refresh the Power BI report.
How many KPIs are included?
There are 13 sample KPIs. They cover cost efficiency, performance, delivery, media quality, investment, creative operations, and brand safety.
Can I use different KPIs?
Yes, if you update the source, definitions, and model logic carefully. Test direction, units, targets, and totals after any structural change.
What is the difference between this and an advertising analytics dashboard?
This product is a KPI scorecard focused on targets, status, trend, ownership, and definition. An analytical dashboard usually explores campaign, audience, region, creative, or channel drivers in greater detail.
Do I need Power BI Pro?
Power BI Desktop is sufficient to open and edit the PBIX. Microsoft licensing may be required if you publish, share, or schedule refresh through Power BI Service.
Are the sample values benchmarks?
No. They are demonstration data only and should not be treated as recommended targets or expected performance.
Does it detect fraud or verify brand safety?
No. It reports the incident and invalid-traffic values you supply; it does not perform independent detection or verification.
About the Author
Built by PK – Microsoft Certified Professional with 15+ years of Excel, Google Sheets, and Power BI experience. Founder of NextGenTemplates, reaching 300K+ subscribers across YouTube channels. Every template is hand-built and tested before release.
Conclusion
The Digital Advertising KPI Dashboard in Power BI is a practical monthly scorecard for teams that already have approved advertising data but need clearer target tracking. Its 13 KPIs, UTB/LTB logic, MTD and YTD views, status lights, trends, ownership, and definitions create a repeatable review without pretending to replace source platforms or verification tools.
Purchase the Digital Advertising KPI Dashboard in Power BI, replace the sample data, refresh the report, and validate every result against your own governance rules.
For additional Power BI tutorials, visit PK: An Excel Expert on YouTube.
Last updated: August 18, 2026.