• Excel and VBA
    • VBA Course
    • Shortcut Keys
    • Useful Formulas
    • Basic Charts
    • Advanced Chart
    • Sort and Filter
    • Pivot Table
    • Data Validation
    • Conditional Formatting
    • Auto Fill and Flash Fill
    • Find and Replace
  • DownloadsPopular
    • Excel VBA Tools
    • Dashboard
      • Excel Dashboard
      • KPI Dashboard
      • Power BI Dashboard
    • Charts
      • Progress Charts
      • Info-graphics
      • Animated Charts
      • Comparisons
      • Gantt Charts
      • Heatmaps
      • Speedometers
      • Timelines
    • Inventory Management
    • HR and Payrolls
    • VBA Automation
    • Utilities and Converters
    • Checklist
    • Calendars
    • Data Analysis
    • Excel Templates
    • Financial Tools
    • Project Management
    • Sales and Marketing
    • Productivity
  • Excel Dashboard
  • Templates
  • Tutorials
    • Charts and Visualization
    • VBA
    • Excel Tips and Tricks
  • Power BI
  • Template StoreNew
  • CoursesNew
  • About Us
  • Contact Us

PK: An Excel Expert

Transforming Data into Decisions

Tag: Info-graphics

Pie of Pie Chart
Charts and Visualization

Pie of Pie Chart in Excel

January 22, 2022August 12, 2024 PKComments Off on Pie of Pie Chart in Excel
Pie of Pie Chart is useful once data have 3 to 4 big slices in the Pie chart and multiple small slices. We can group small slices as one slice "Other"
Read More
Day Wise Service Level Chart
Charts and Visualization

Stylish Column Chart in Excel

November 7, 2021March 2, 2025 PKComments Off on Stylish Column Chart in Excel
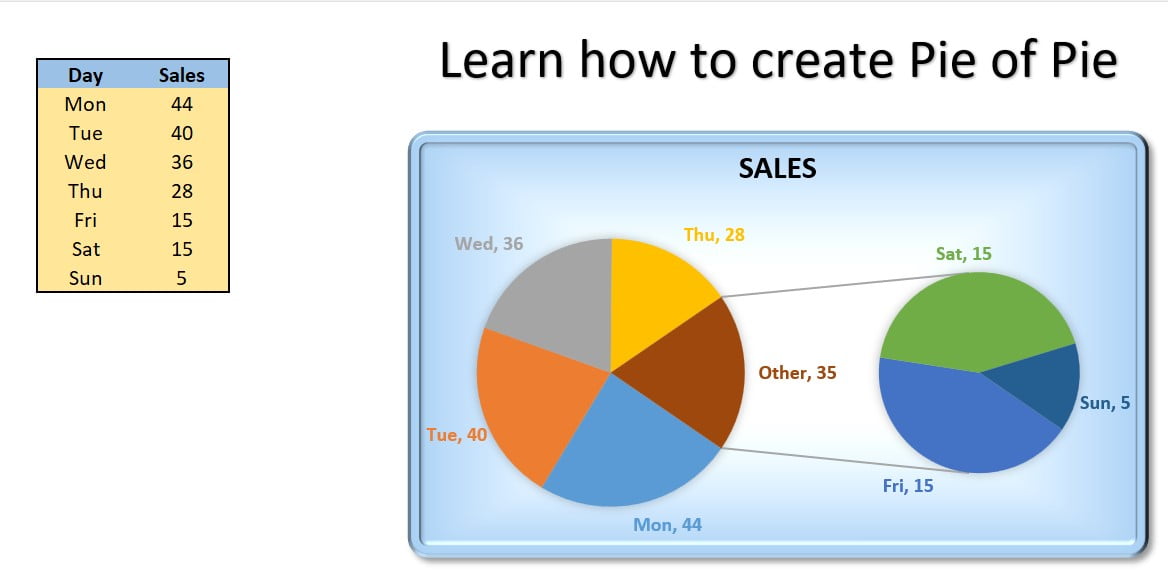
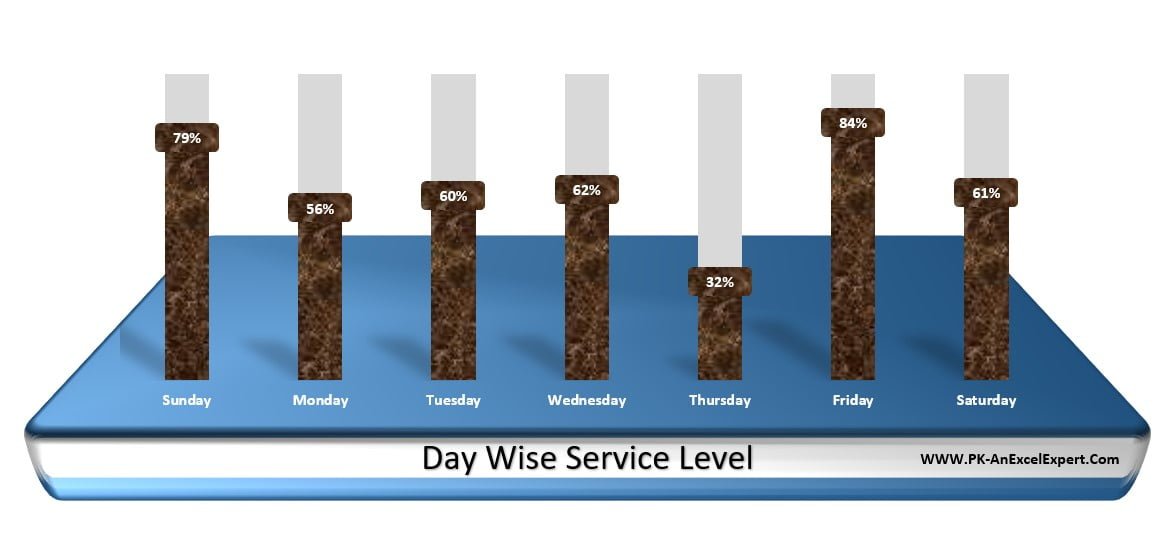
In this article, we have created a Stylish Column Chart in Microsoft Excel. You can use this info-graphic chart in your Excel Report or Business Dashboard. We have displayed Day
Read More
Infographics in Power BI
Power BI

Infographics in Power BI dashboard

April 18, 2021August 17, 2024 PKComments Off on Infographics in Power BI dashboard
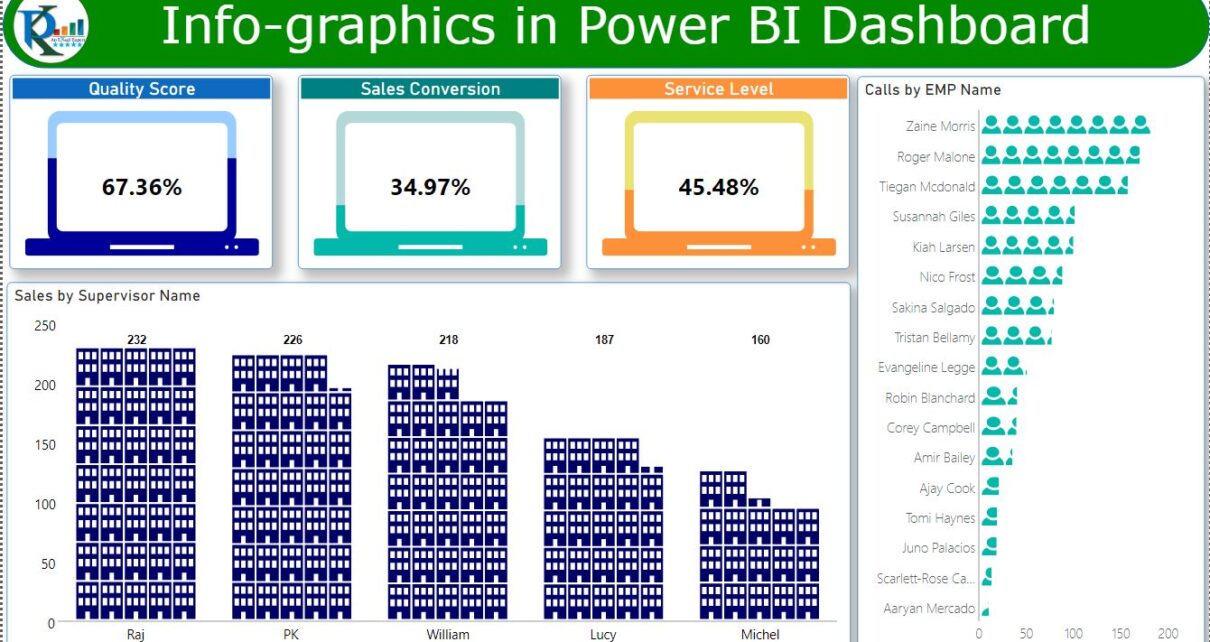
In this article, you will learn how to use Infographic Designer Visual in Power BI. This Visual can improve the beauty of your Power BI Dashboards. Using this Visual, we
Read More
Tablet and Mobile layout Dashboard
Dashboard

Dynamic Dashboard with Tablet and Mobile shape in Excel

May 17, 2020February 28, 2025 PKComments Off on Dynamic Dashboard with Tablet and Mobile shape in Excel
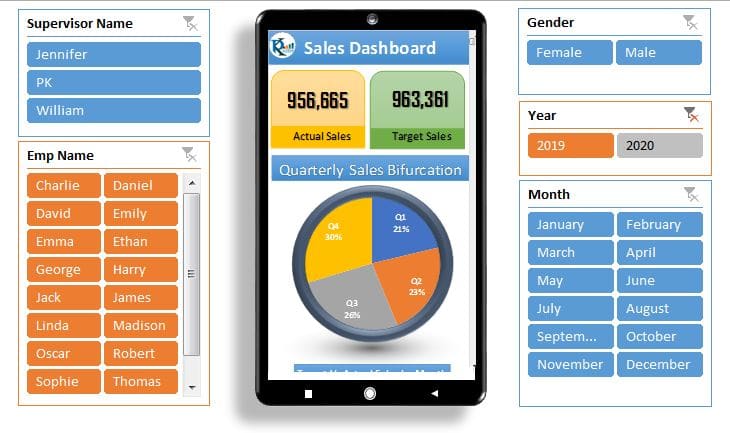
In this article, we have created an attractive and dynamic dashboard using Tablet and Mobile shape. We have created Tablet and Mobile shapes using Excel Shapes. We have made the
Read More
Smart Chart with Condition Formatting
Power Pivot Charts and Visualization

Smart Chart with Laptop Shape in Excel

May 3, 2020March 3, 2025 
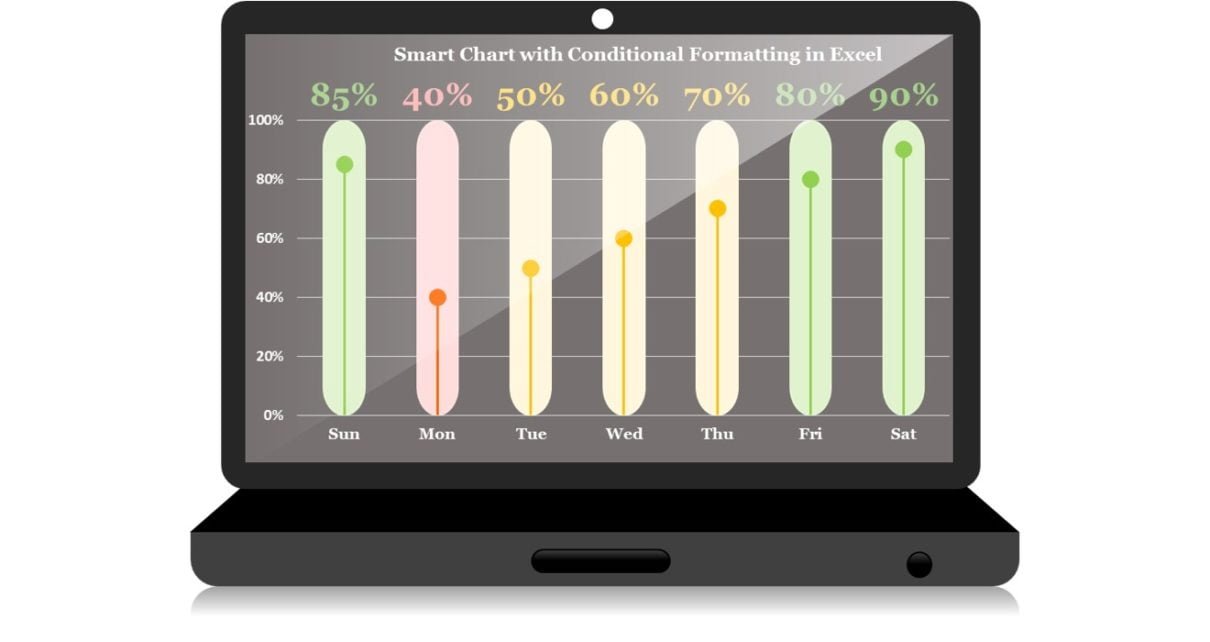
PKComments Off on Smart Chart with Laptop Shape in Excel
In this article, we have created a beautiful and smart chart with Conditional formatting in Microsoft Excel. We have create a laptop shape also using Excel shapes. We have placed
Read More
RAG Conditional Formatting in 3D Chart
Charts and Visualization

RAG Conditional Formatting in 3D Chart

March 10, 2020March 5, 2025 
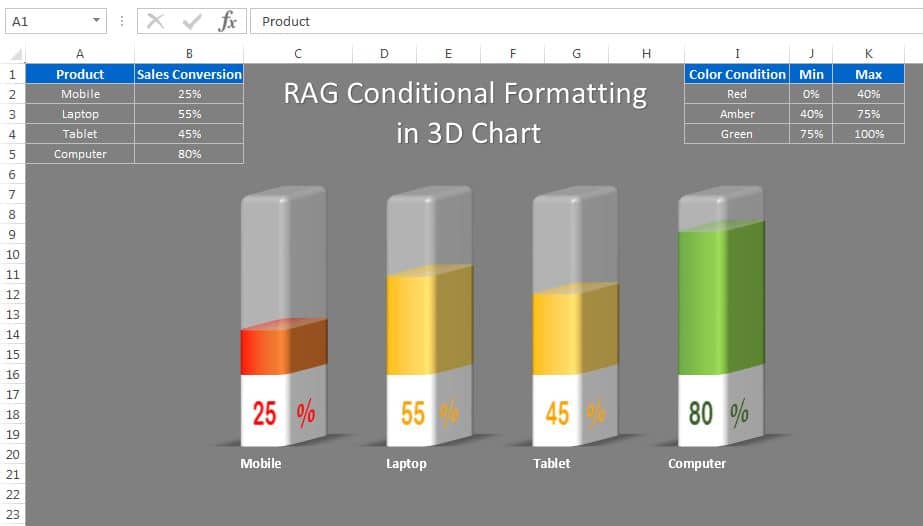
PKComments Off on RAG Conditional Formatting in 3D Chart
In this article, we have created a beautiful 3D chart to display the Sales conversion for different products. We have used RAG (Red, Amber and Green) Conditional Formatting in this
Read More
Medical Science Info-graphic Chart
Charts and Visualization

Medical Science Info-graphic Chart in Excel

February 23, 2020March 3, 2025 
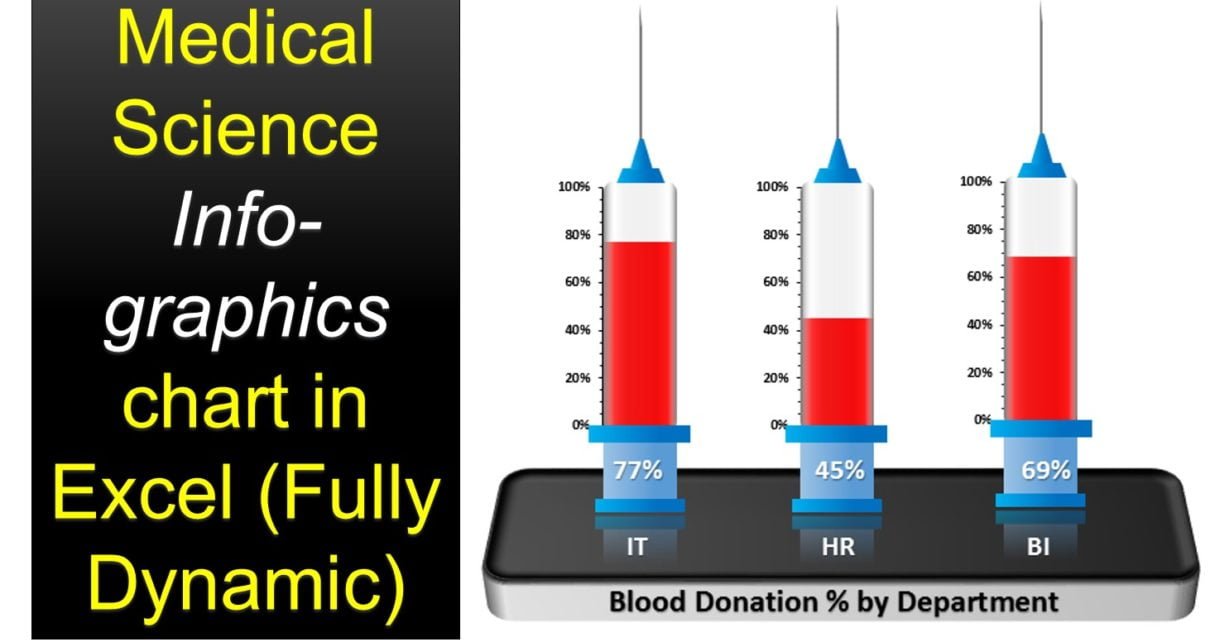
PKComments Off on Medical Science Info-graphic Chart in Excel
In this article, we have created a beautiful Medical Science info-graphic chart in Excel. We have displayed department wise blood donation% using this info-graphic in excel only. We have not
Read More
Drill Down in Pivot Chart
Power Pivot Charts and Visualization

Drill Down/Drill Up Feature in Pivot Chart

January 6, 2020October 5, 2024 
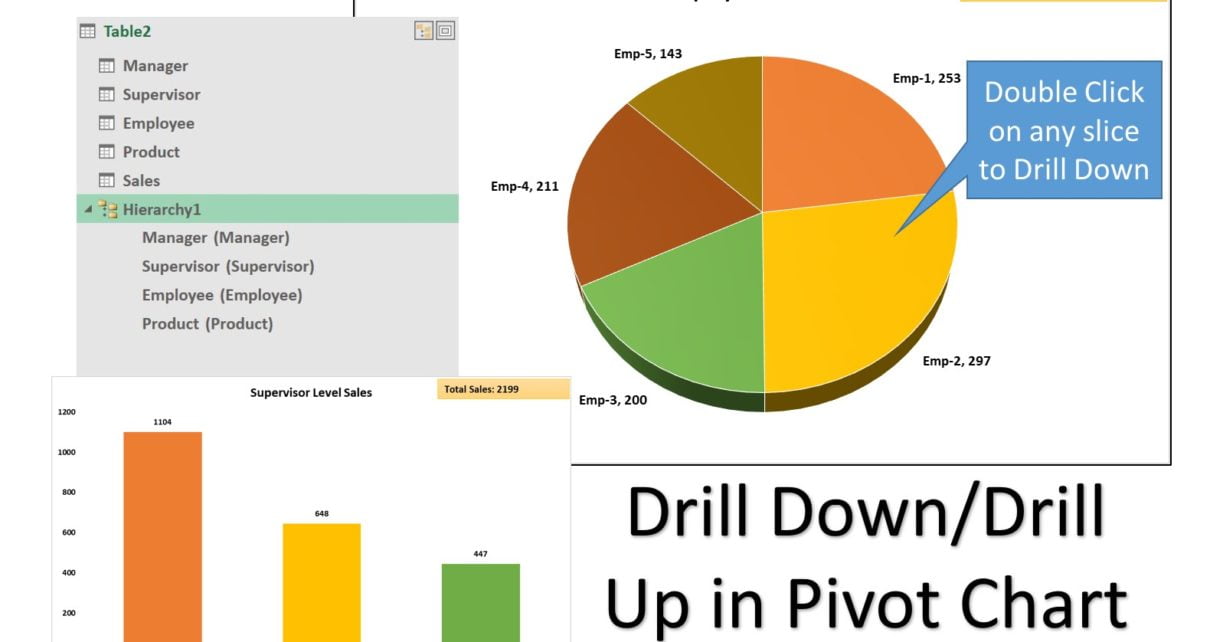
PKComments Off on Drill Down/Drill Up Feature in Pivot Chart
In this article, we have created a Drill Down/Drill Up Feature functionality in a Pivot chart. We have created a hierarchy in Power Pivot data model to create this. Below are
Read More
3D Table in Excel
Charts and Visualization

Data Driven 3D Table in Excel

October 17, 2019March 8, 2025 PKComments Off on Data Driven 3D Table in Excel
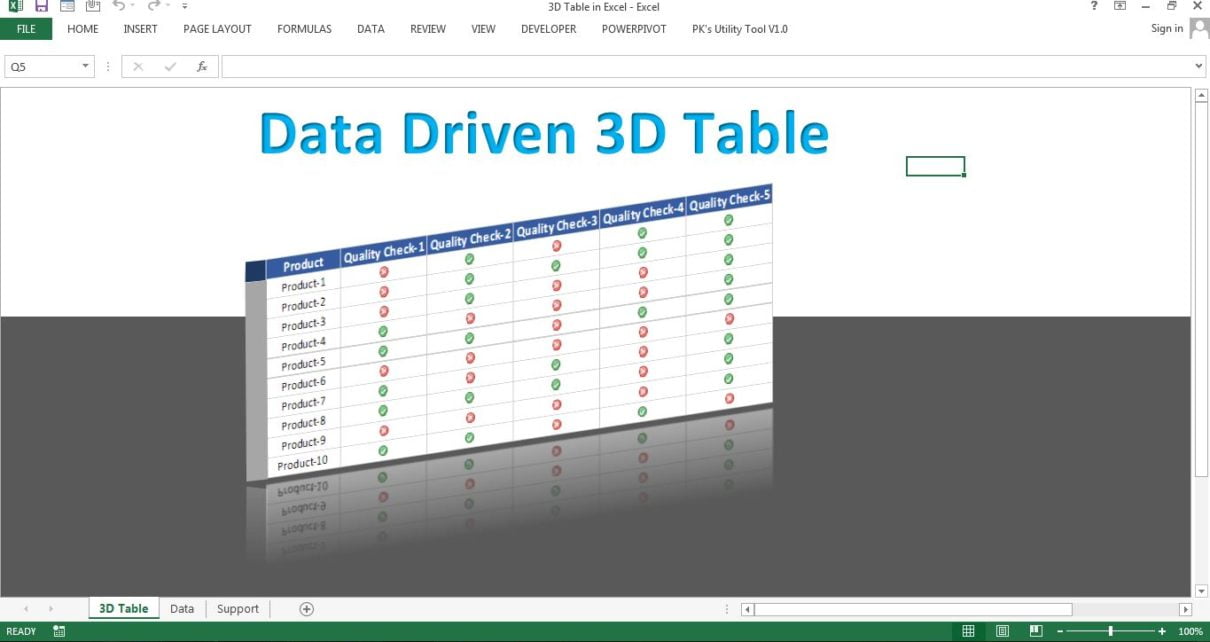
In this article, we have designed a data driven 3D table in Excel. We have used Linked picture and excel shapes to create this table. You can use this in
Read More
Timer Chart Visualization
Charts and Visualization

Timer Chart Visualization in Excel

October 14, 2019March 6, 2025 
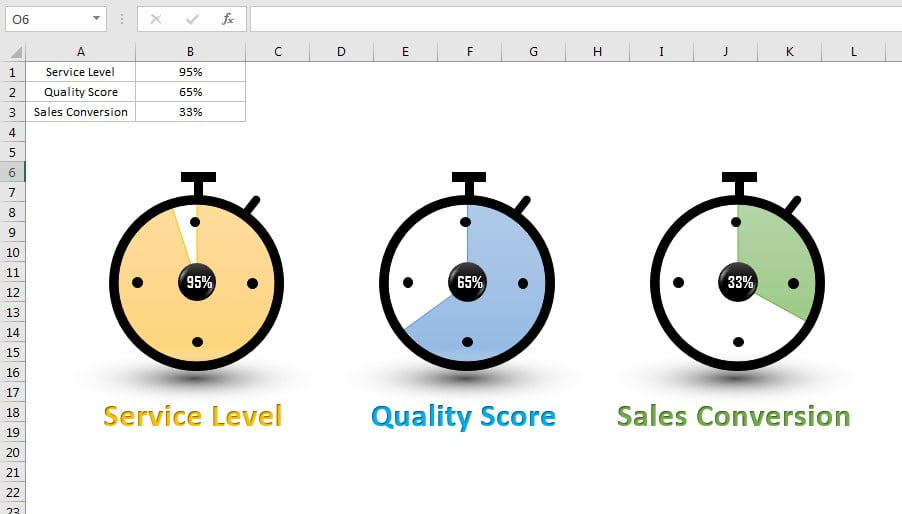
PKComments Off on Timer Chart Visualization in Excel
In this article, we have created a beautiful data driven Timer Chart visualization. You can use this chart to display KPI metrics like Service Level, Quality Score, Sales conversion etc.
Read More

Posts pagination

Previous 1 2 3 … 6 Next
  • Excel and VBA
    • VBA Course
    • Shortcut Keys
    • Useful Formulas
    • Basic Charts
    • Advanced Chart
    • Sort and Filter
    • Pivot Table
    • Data Validation
    • Conditional Formatting
    • Auto Fill and Flash Fill
    • Find and Replace
  • DownloadsPopular
    • Excel VBA Tools
    • Dashboard
      • Excel Dashboard
      • KPI Dashboard
      • Power BI Dashboard
    • Charts
      • Progress Charts
      • Info-graphics
      • Animated Charts
      • Comparisons
      • Gantt Charts
      • Heatmaps
      • Speedometers
      • Timelines
    • Inventory Management
    • HR and Payrolls
    • VBA Automation
    • Utilities and Converters
    • Checklist
    • Calendars
    • Data Analysis
    • Excel Templates
    • Financial Tools
    • Project Management
    • Sales and Marketing
    • Productivity
  • Excel Dashboard
  • Templates
  • Tutorials
    • Charts and Visualization
    • VBA
    • Excel Tips and Tricks
  • Power BI
  • Template StoreNew
  • CoursesNew
  • About Us
  • Contact Us
Copyright © 2023 PK-AnExcelExpert.com - Privacy Policy
This website uses cookies to improve your user experience, analyze site traffic and serve targeted ads in accordance with our Privacy Policy ACCEPT
Privacy & Cookies Policy

Privacy Overview

This website uses cookies to improve your experience while you navigate through the website. Out of these cookies, the cookies that are categorized as necessary are stored on your browser as they are essential for the working of basic functionalities of the website. We also use third-party cookies that help us analyze and understand how you use this website. These cookies will be stored in your browser only with your consent. You also have the option to opt-out of these cookies. But opting out of some of these cookies may have an effect on your browsing experience.
Necessary
Always Enabled
Necessary cookies are absolutely essential for the website to function properly. This category only includes cookies that ensures basic functionalities and security features of the website. These cookies do not store any personal information.
Non-necessary
Any cookies that may not be particularly necessary for the website to function and is used specifically to collect user personal data via analytics, ads, other embedded contents are termed as non-necessary cookies. It is mandatory to procure user consent prior to running these cookies on your website.
SAVE & ACCEPT