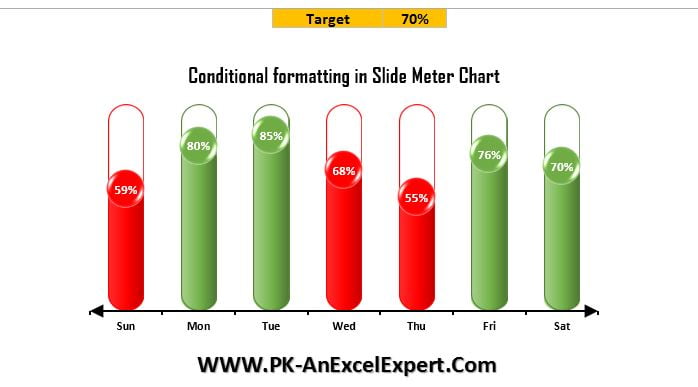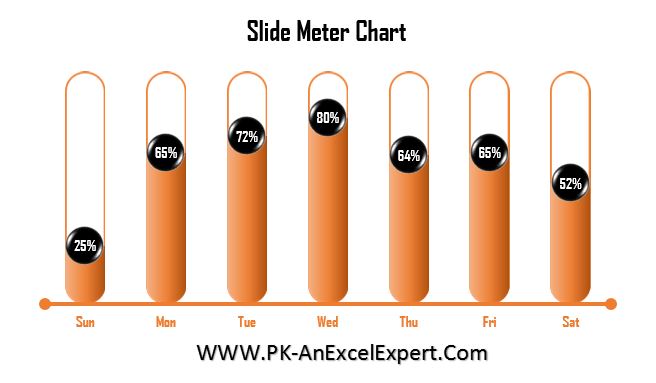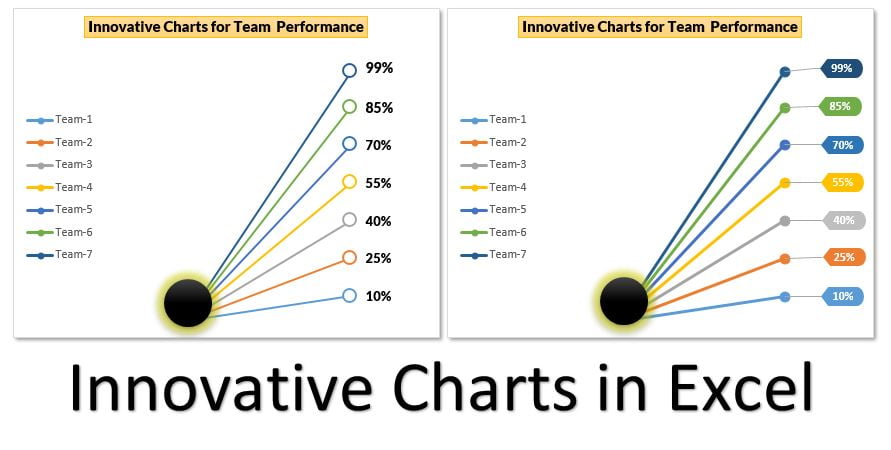
Conditional Formatting in a Lollipop Chart in Excel
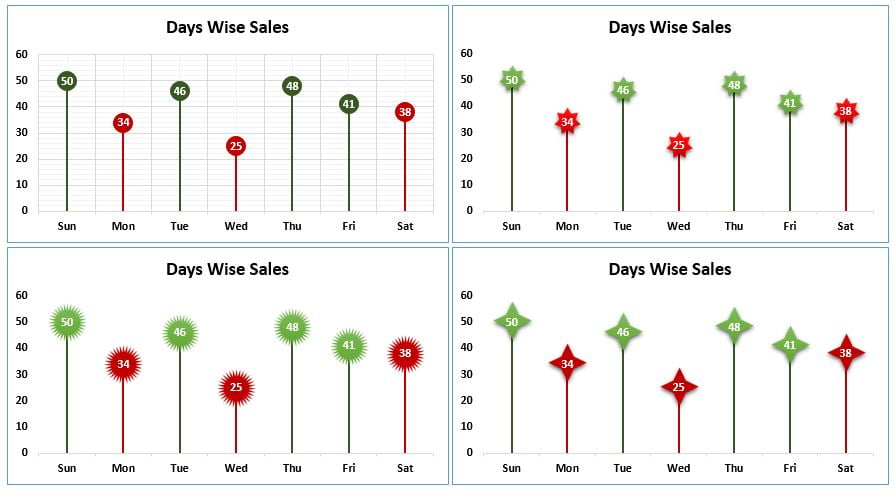
Using the Conditional Formatting in a Lollipop Chart in Excel is very useful. It helps to audience to identify which category is meeting the target and which is not meeting.
Transforming Data into Decisions