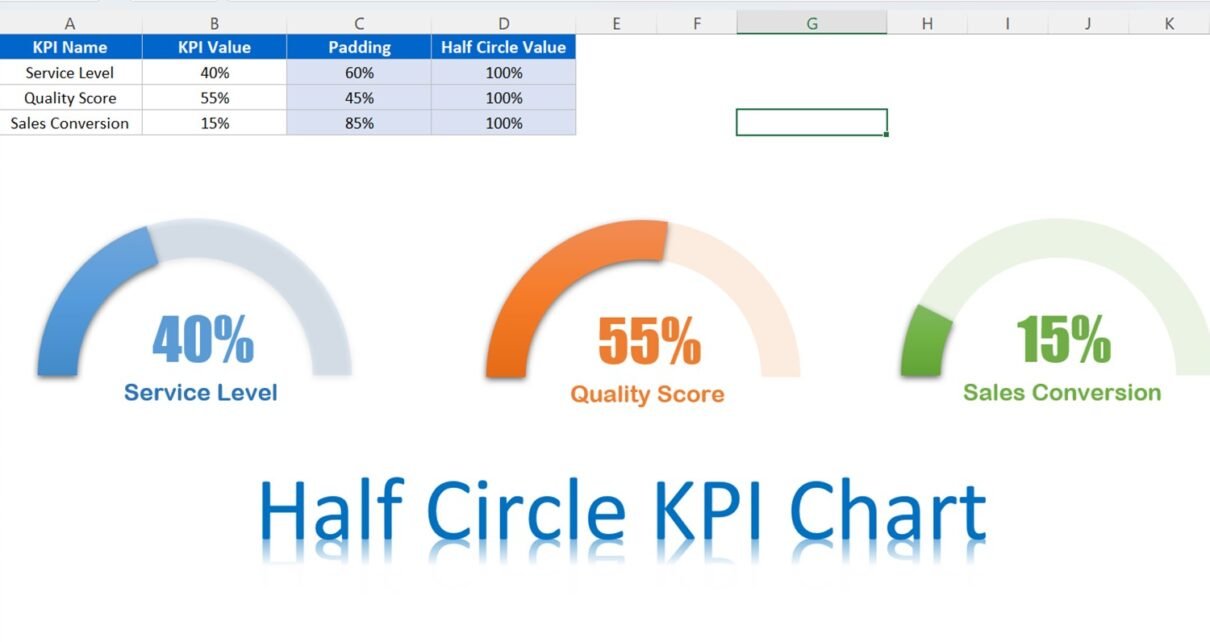
Half Circle KPI Charts in Excel using Doughnut Charts
Key Performance Indicators (KPIs) are metrics used to measure the success of a company or a particular project. KPIs can help businesses make informed decisions based on data, improve efficiency,