Corporate Social Responsibility (CSR) plays a major role in shaping the reputation and long-term success of any organization. Today, companies focus not only on business growth but also on social impact, environmental protection, and community development. Because of this, decision-makers want tools that track CSR performance in a simple and structured way. One of the most effective tools for this purpose is the CSR KPI Dashboard in Excel.
This dashboard helps you measure, analyze, and monitor CSR activities in a transparent and organized format. It brings all important CSR KPIs into one interactive Excel file so that teams can track progress month-by-month as well as year-to-date. In this detailed article, you will learn everything about the CSR KPI Dashboard in Excel—its worksheets, features, advantages, best practices, and how companies use it to strengthen their social responsibility efforts.
Click to buy Corporate Social Responsibility (CSR) KPI Dashboard in Excel
What Is a Corporate Social Responsibility (CSR) KPI Dashboard in Excel?
A CSR KPI Dashboard in Excel is a ready-to-use Excel template that helps organizations track all CSR performance indicators in one place. It gives a clear view of goals, progress, achievements, and areas that need improvement. Because it runs in Excel, teams do not need any extra software. They can customize it, update numbers easily, and review trends using simple charts and comparisons.
The dashboard becomes very useful for CSR managers because it shows:
- Monthly performance (MTD)
- Year-to-date performance (YTD)
- Actual vs Target comparisons
- Current year vs Previous year progress
- KPI-wise trends
- CSR definitions and formulas
Moreover, the dashboard improves reporting because it converts raw CSR data into visual insights that everyone understands.
Why Do Companies Need a CSR KPI Dashboard?
Organizations run multiple CSR initiatives such as environmental protection, community programs, employee welfare, sustainable sourcing, and energy-saving projects. But many companies still track these activities in scattered spreadsheets. This leads to:
- Missing data
- Lack of transparency
- Weak reporting
- Slow decisions
- No trend visibility
A CSR KPI Dashboard eliminates these challenges because it shows everything in one organized file. As a result, management teams understand CSR performance instantly, take timely decisions, and plan improvement efforts with confidence.
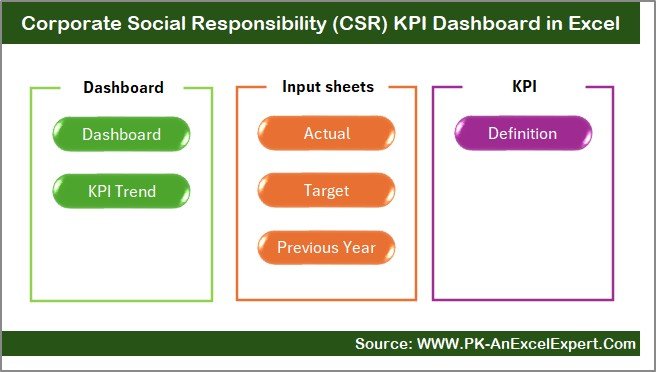
Key Worksheets in the CSR KPI Dashboard in Excel
This dashboard contains 7 structured worksheets, each designed for a specific purpose. Together, they make CSR tracking easier, faster, and more accurate.
Summary Page – The Navigation Center
The Summary Page works as an index sheet. It includes six navigation buttons that allow users to move to different worksheets with one click. This improves user experience and saves time when reviewing data.
The buttons usually link to:
- Dashboard
- Trend
- Actual Numbers Input
- Target Sheet
- Previous Year Sheet
- KPI Definition Sheet
Since CSR managers often switch between sheets, this page makes it quick and simple.
Click to buy Corporate Social Responsibility (CSR) KPI Dashboard in Excel
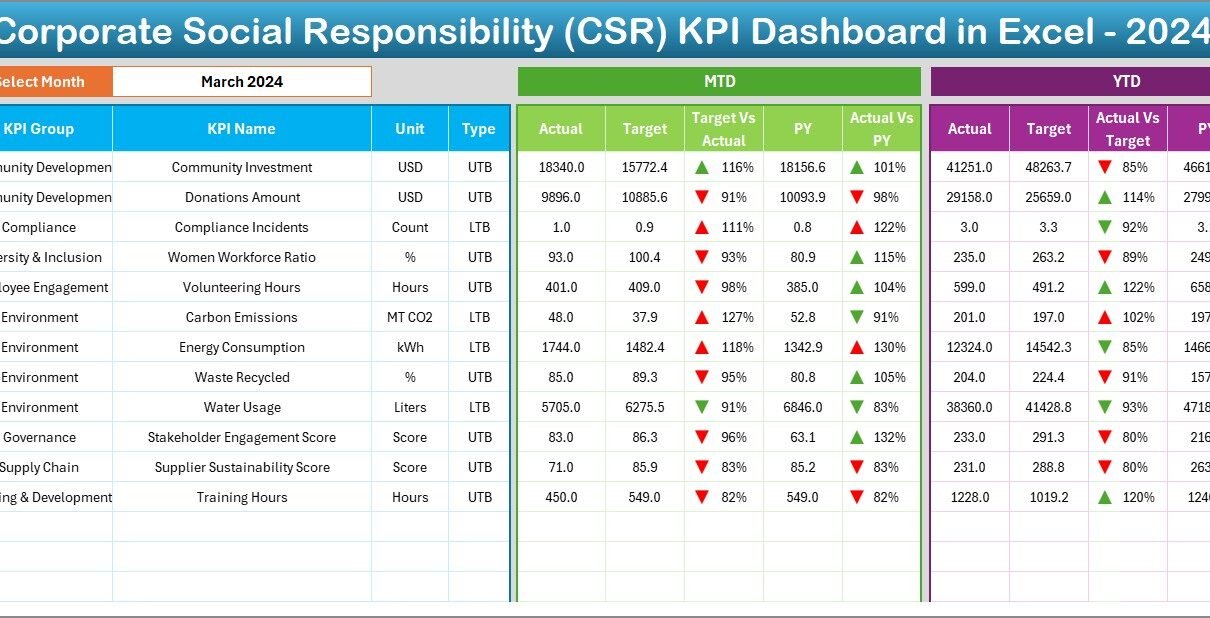
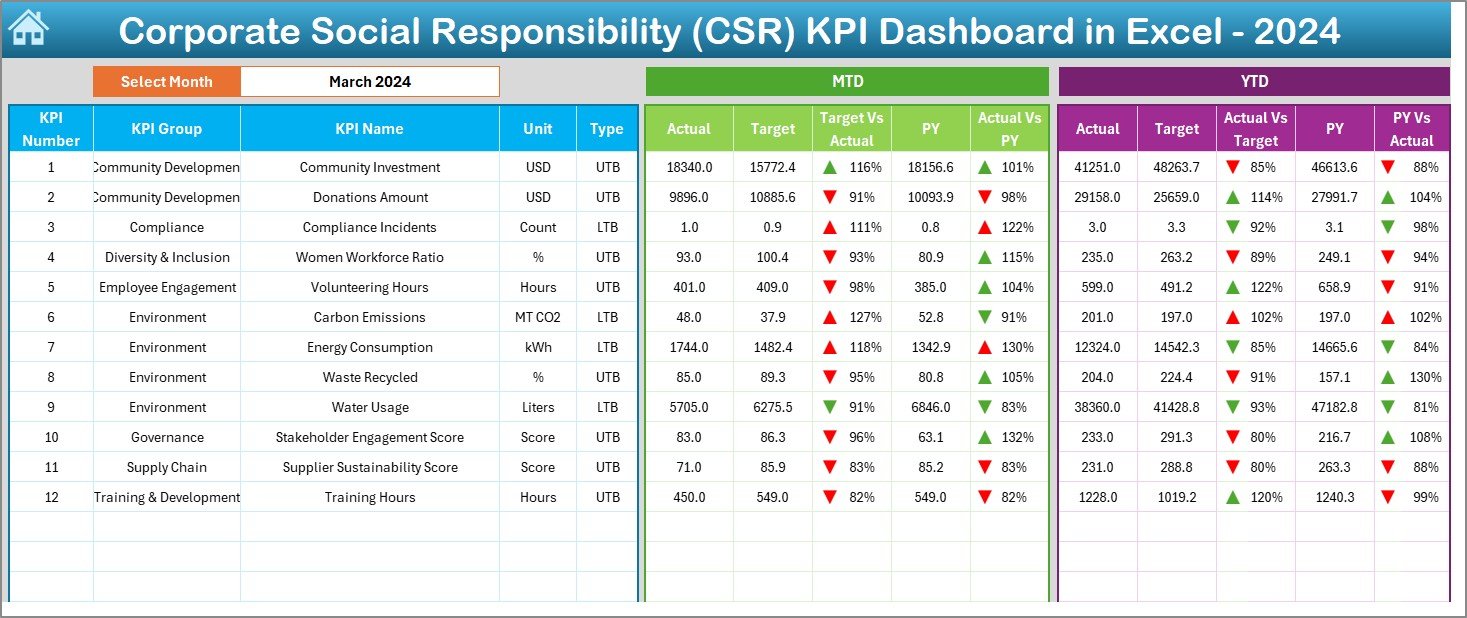
Dashboard Sheet – The Main CSR Performance View
The Dashboard Sheet is the heart of the entire CSR KPI system. It displays all important information in one visual, user-friendly layout.
Key Features
- A dropdown in cell D3 lets you select the month.
- Once you select a month, the whole dashboard updates automatically.
- You can view MTD Actual, Target, Previous Year results.
- You can also view YTD Actual, Target, Previous Year values.
Performance Comparisons
To make analysis easier, this sheet displays:
- MTD Target vs Actual
- MTD Previous Year vs Actual
- YTD Target vs Actual
- YTD Previous Year vs Actual
The dashboard uses conditional formatting arrows to show:
- ↑ Improvement
- ↓ Decline
- → Stable
Because of this, teams identify progress or issues instantly.
Click to buy Corporate Social Responsibility (CSR) KPI Dashboard in Excel
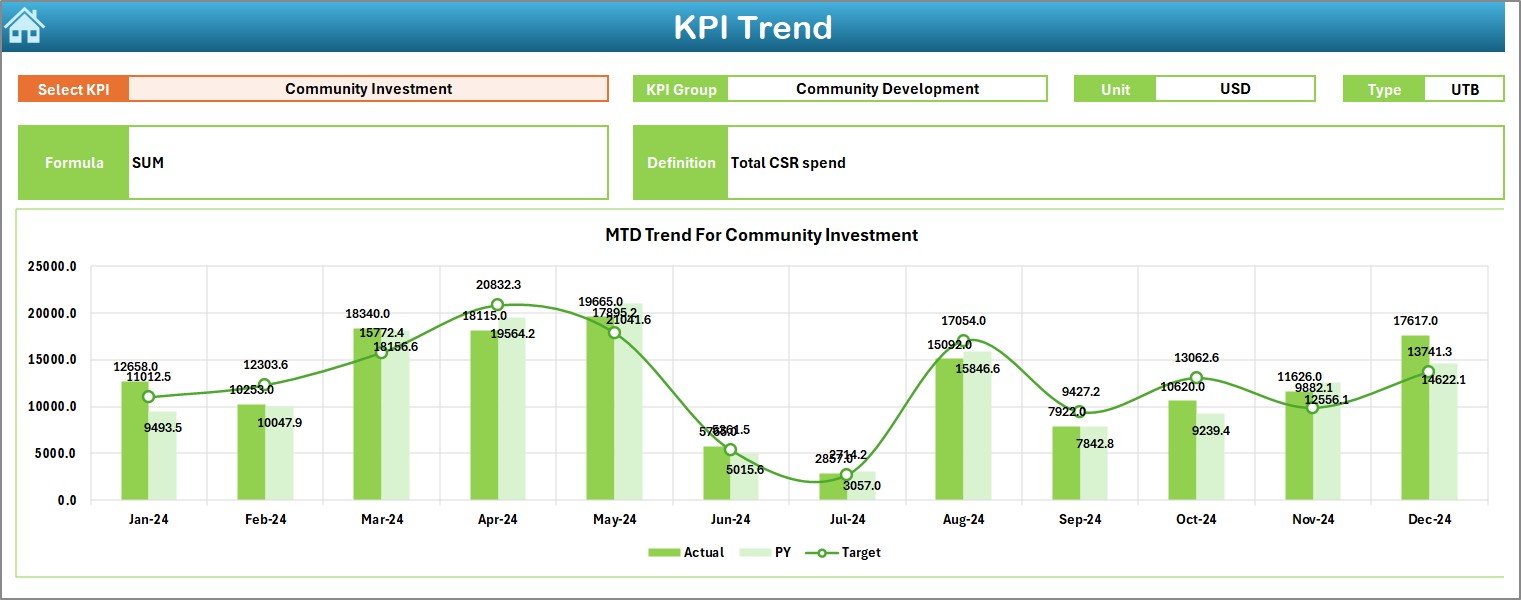
Trend Sheet – In-Depth KPI Performance Analysis
The Trend Sheet helps users understand long-term performance. It contains a dropdown in cell C3, where you can select any KPI name. Once selected, the sheet displays:
- KPI Group
- KPI Unit
- KPI Type (LTB – Lower the Better or UTB – Upper the Better)
- KPI Formula
- KPI Definition
Additionally, the sheet highlights MTD and YTD trend charts for Actual, Target, and Previous Year values. These trends show whether CSR initiatives are improving, declining, or remaining stable.
This page is extremely useful for monthly review meetings and CSR reporting.
Click to buy Corporate Social Responsibility (CSR) KPI Dashboard in Excel
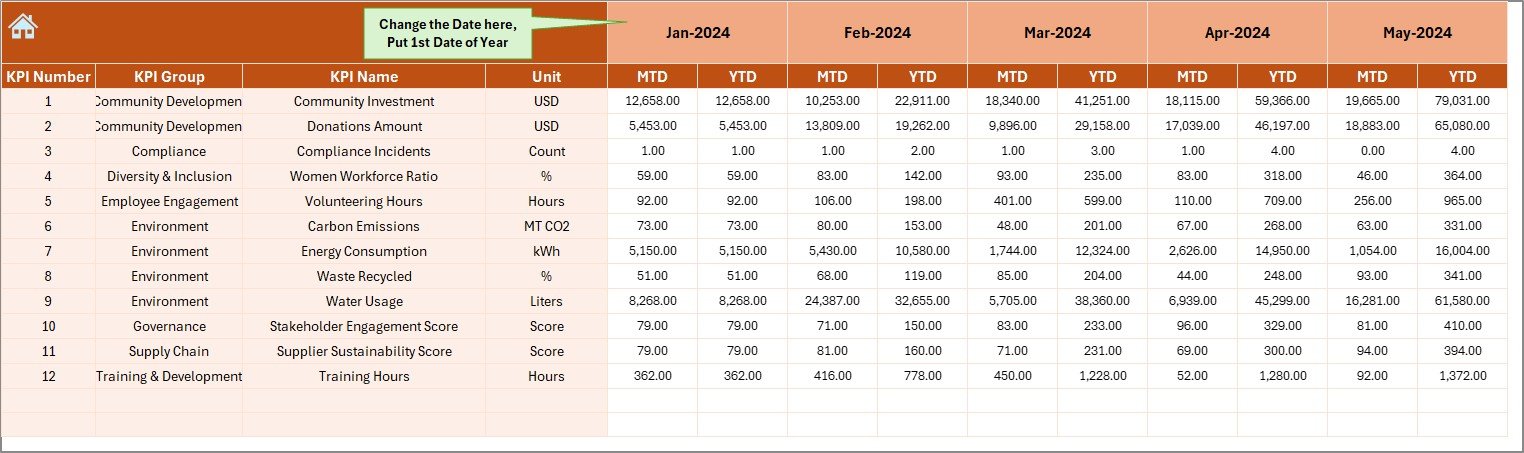
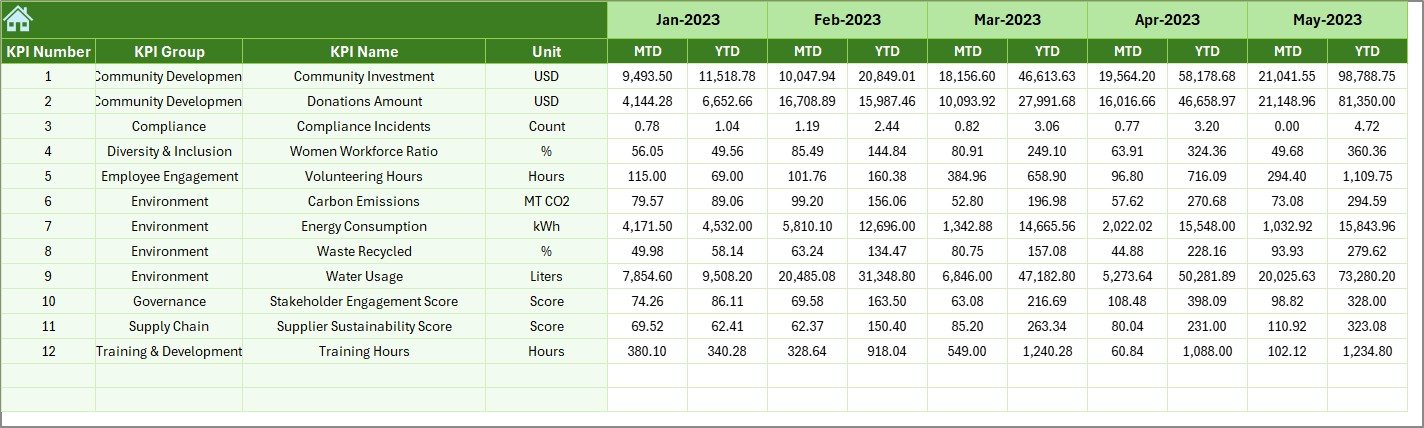
Actual Numbers Input Sheet – Enter Monthly Performance
This sheet is designed for entering actual CSR performance values. You can:
- Update MTD and YTD values
- Select the first month of the year using cell E1
- Update every KPI’s monthly progress in a structured format
This sheet forms the backbone of the dashboard because all charts and summaries depend on these numbers.
Click to buy Corporate Social Responsibility (CSR) KPI Dashboard in Excel
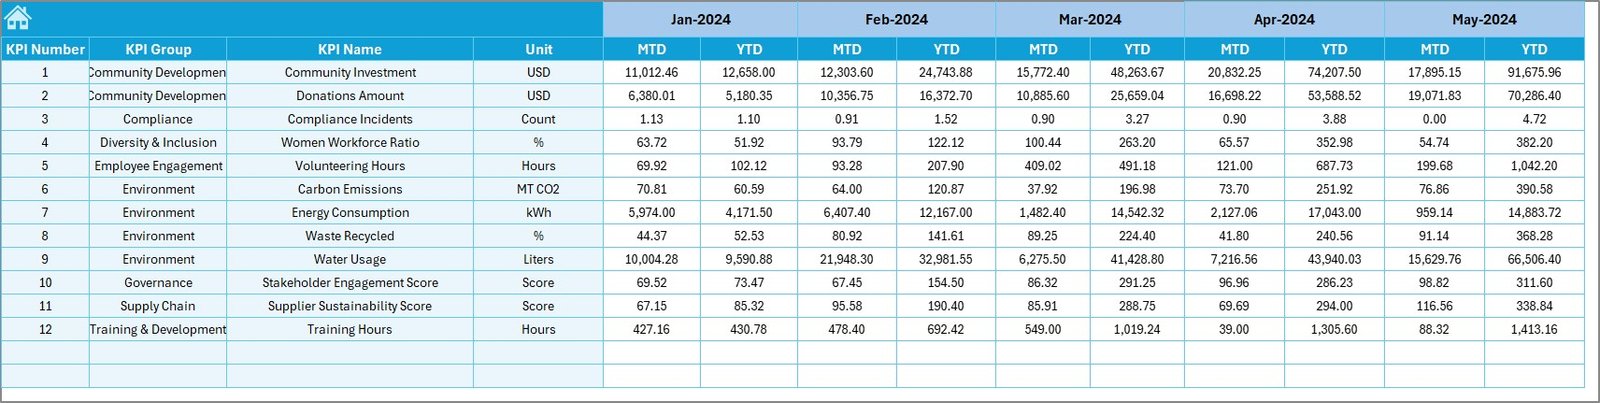
Target Sheet – Enter Monthly CSR Targets
In this sheet, you enter the target values for each KPI. It includes:
- MTD Target
- YTD Target
- KPI-wise monthly goal planning
Targets help companies assess whether CSR activities are on track or need improvement.
Click to buy Corporate Social Responsibility (CSR) KPI Dashboard in Excel
Previous Year Number Sheet – Compare Last Year’s Results
This sheet stores previous year’s CSR performance data, structured the same way as the current year. It helps organizations compare:
- Growth
- Decline
- Progress consistency
Year-on-year comparisons give deeper insights into the organization’s long-term CSR efforts.
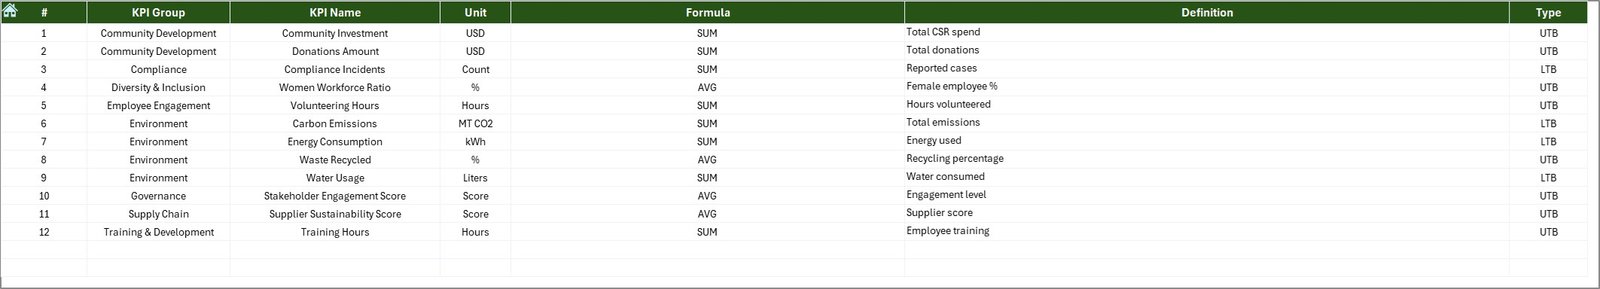
KPI Definition Sheet – KPI Knowledge Library
This sheet stores information about every CSR KPI, including:
- KPI Name
- KPI Group
- KPI Unit
- KPI Formula
- KPI Definition
- KPI Type (LTB or UTB)
This sheet helps new team members understand each KPI quickly. It also ensures consistency when reporting CSR performance.
Click to buy Corporate Social Responsibility (CSR) KPI Dashboard in Excel
What KPIs Can You Track Using a CSR Dashboard?
Companies use CSR dashboards to track different types of indicators. Some common examples include:
Environmental KPIs
- Carbon Emissions
- Energy Savings
- Waste Recycled
- Water Conservation
Social Impact KPIs
- Community Program Participation
- Employee Wellbeing Activities
- Training Hours Provided
Governance KPIs
- Ethical Sourcing Compliance
- Supplier CSR Score
- Policy Implementation Rate
A CSR dashboard consolidates all these metrics so that the team has total visibility.
Advantages of a CSR KPI Dashboard in Excel
A CSR dashboard delivers several powerful benefits. Below are some important advantages you must know:
- Better Decision-Making
Since the dashboard shows real-time progress, management teams make faster and stronger decisions. They identify low-performing areas and take action without delay.
- Clear Visibility of CSR Goals
Teams understand:
- What they need to achieve
- Where they stand today
- Whether they meet their targets
- What needs improvement
This clarity improves accountability and boosts performance.
- Easy Month-to-Month Comparison
The dashboard displays MTD and YTD values for:
- Actual
- Target
- Previous year
This helps organizations evaluate year-on-year improvements.
- Strong Reporting and Presentation
The charts and conditional formatting improve presentations during:
- Board meetings
- CSR reviews
- Investor updates
- Annual sustainability reporting
It gives management a professional, visually clear CSR performance overview.
- Simple to Customize and Maintain
Because the dashboard is built in Excel, you can:
- Add new KPIs
- Modify layouts
- Insert new data
- Change formulas
- Customize colors and themes
No advanced tools required.
- Trusted by All Departments
CSR plays a role in many departments such as HR, Sustainability, Finance, and Operations. All departments easily understand and use the dashboard because of its simplicity.
Best Practices for Using a CSR KPI Dashboard in Excel
To get maximum value from your CSR KPI Dashboard, follow these best practices:
- Use Consistent Data Entry Methods
Always enter data in a consistent format. This improves accuracy and ensures the dashboard updates correctly.
- Review KPIs Every Month
Monthly reviews help you:
- Identify improvements
- Catch problems early
- Track project progress
- Maintain accountability
- Keep KPIs Short and Relevant
Avoid adding too many KPIs. Focus on performance indicators that directly support your CSR goals.
- Validate Data Regularly
Check actual, target, and previous-year values frequently so that your chart visuals remain correct.
- Update KPI Definitions Yearly
Review KPI definitions, units, and measurements at the start of every year. This keeps your dashboard current and aligned with global CSR standards.
- Use Conditional Formatting Wisely
Highlight only important changes so that users do not feel overwhelmed.
- Protect Formula Cells
Lock formula fields to prevent accidental changes. This keeps the dashboard safe and functional.
How Does a CSR KPI Dashboard Improve Sustainability Efforts?
A CSR dashboard becomes a powerful sustainability tool because it:
- Tracks environmental indicators
- Supports community development planning
- Monitors ethical practices
- Displays long-term social impact
- Helps teams measure sustainability goals
When companies use this dashboard regularly, they strengthen both operational efficiency and social responsibility.
Conclusion
A Corporate Social Responsibility (CSR) KPI Dashboard in Excel is one of the most practical tools for organizations that want to track, analyze, and improve their CSR efforts. It simplifies reporting, increases performance visibility, and supports data-based decision-making. With clear worksheets, structured inputs, and powerful trend charts, this dashboard helps management teams understand both short-term and long-term CSR achievements.
As companies continue to focus on sustainability and ethical practices, a well-designed CSR KPI dashboard becomes essential. It gives teams the tools they need to measure progress, maintain transparency, and build a stronger social presence.
Frequently Asked Questions (FAQ)
- What is a CSR KPI Dashboard in Excel?
It is a ready-to-use Excel tool that tracks CSR performance indicators such as environmental metrics, social initiatives, and governance activities.
- Why should companies track CSR KPIs?
Tracking CSR KPIs helps businesses measure impact, plan improvements, ensure compliance, and maintain transparency.
- Can I customize the CSR KPI Dashboard?
Yes. You can modify KPIs, change formulas, add visuals, and personalize it according to your company’s needs.
- What type of KPIs can I track?
You can track environmental, social, and governance KPIs such as carbon footprint, employee training hours, and ethical sourcing compliance.
- Who should use this dashboard?
CSR managers, sustainability teams, HR departments, finance teams, and leadership teams use this dashboard for reporting and planning.
Visit our YouTube channel to learn step-by-step video tutorials
Watch the step-by-step video tutorial:
Click to buy Corporate Social Responsibility (CSR) KPI Dashboard in Excel