Running a photography business involves managing multiple aspects—from client acquisition and session bookings to revenue tracking and project completion. The Photography Business KPI Dashboard in Power BI provides a ready-to-use solution to monitor your key performance indicators (KPIs) effectively.
This dashboard consolidates all critical metrics into interactive visuals, allowing photography studio owners and managers to make data-driven decisions and optimize business performance.
What Is a Photography Business KPI Dashboard?
A Photography Business KPI Dashboard is a Power BI-based reporting tool that tracks critical metrics for your photography studio. It allows you to:
-
Monitor bookings, revenue, and client satisfaction
-
Compare actual performance against monthly and yearly targets
-
Track MTD (Month-to-Date) and YTD (Year-to-Date) performance
-
Identify trends, gaps, and opportunities for business growth
With this dashboard, you can visualize your studio’s performance in real-time and take action on underperforming areas.
Key Features of the Photography Business KPI Dashboard
Click to Buy Photography Business KPI Dashboard in Power BI
This dashboard contains 3 main pages in Power BI, supported by Excel data inputs:
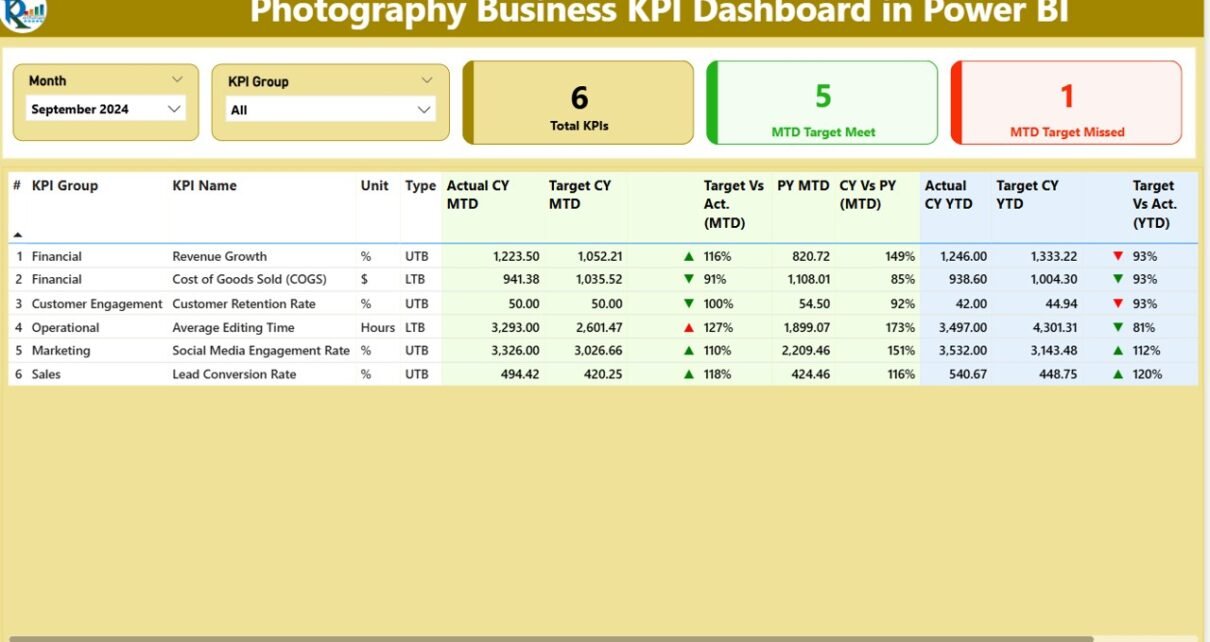
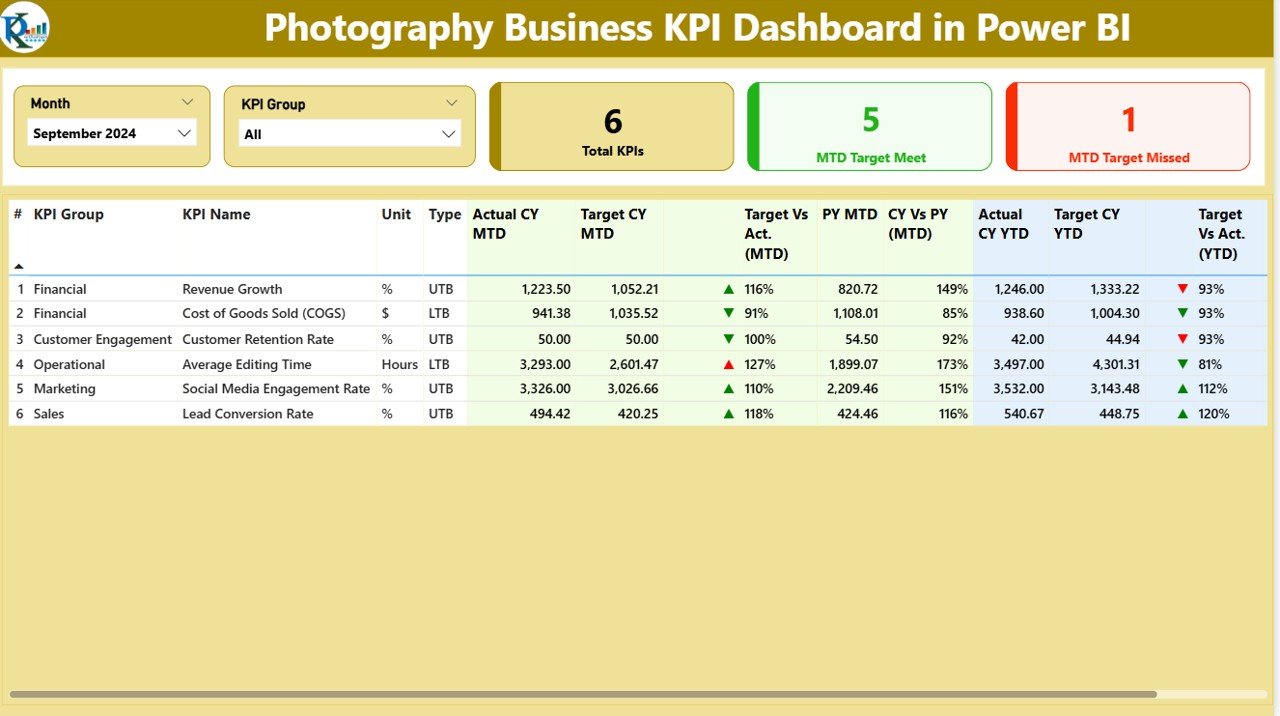
1. Summary Page
The Summary Page provides an overview of all KPIs.
Cards:
-
Total KPIs Count – Total number of KPIs tracked
-
MTD Target Met Count – Number of KPIs that met the monthly target
-
MTD Target Missed Count – Number of KPIs that missed the monthly target
Detailed Table:
-
KPI Number: Sequence of KPIs
-
KPI Group: Category of KPI
-
KPI Name: KPI description
-
Unit: Measurement unit (e.g., $ or %)
-
Type: LTB (Lower the Better) or UTB (Upper the Better)
-
Actual CY MTD & Target CY MTD: Actual vs. target performance for current month
-
MTD Icon: Red/green arrow showing status
-
Target vs Actual (MTD): Percentage formula (Actual ÷ Target)
-
PY MTD: Previous year same month data
-
CY vs PY (MTD): Current vs previous year percentage
-
Actual CY YTD & Target CY YTD: Cumulative year-to-date performance
-
YTD Icon: Red/green arrow for YTD performance
-
Target vs Actual (YTD): YTD percentage comparison
-
PY YTD: Previous year YTD value
-
CY vs PY (YTD): Current year vs previous year YTD percentage
Click to Buy Photography Business KPI Dashboard in Power BI
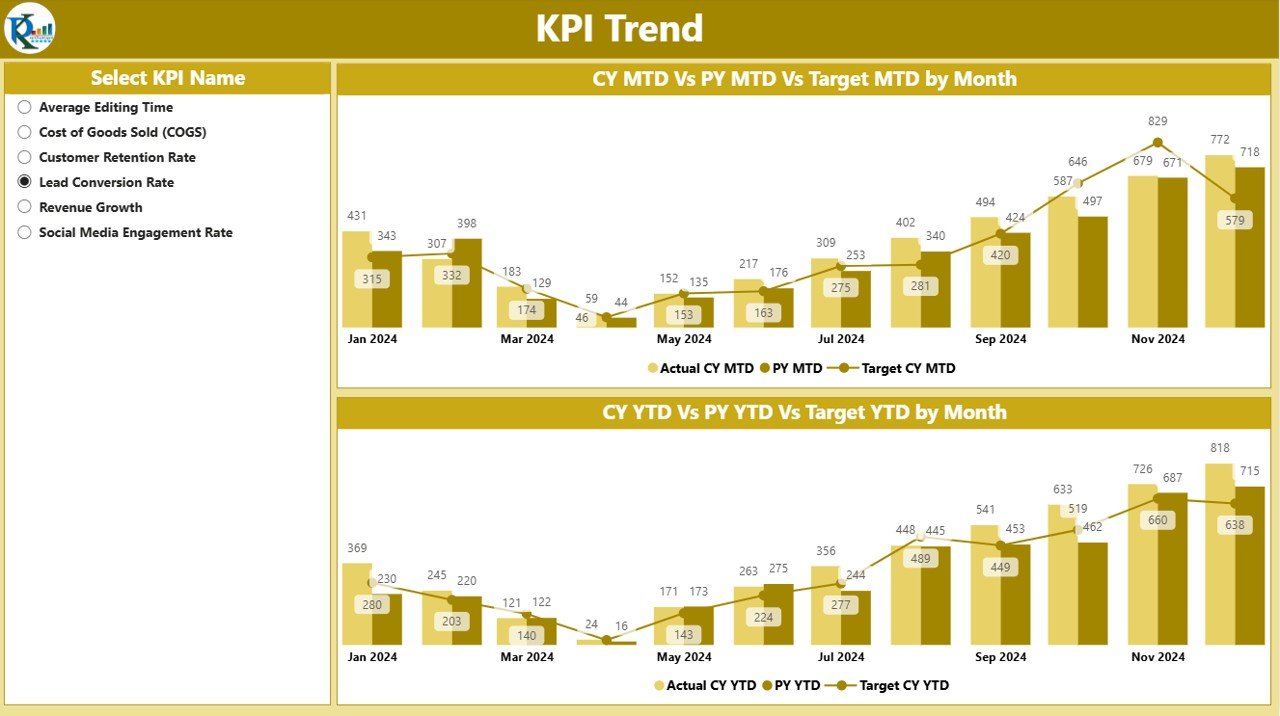
2. KPI Trend Page
The KPI Trend Page allows visual analysis of performance over time:
-
Combo Charts: Compare actual numbers, previous year data, and targets for MTD and YTD
-
Slicer: Select individual KPI to view trends and analyze performance
-
Provides actionable insights into month-to-month and year-over-year growth
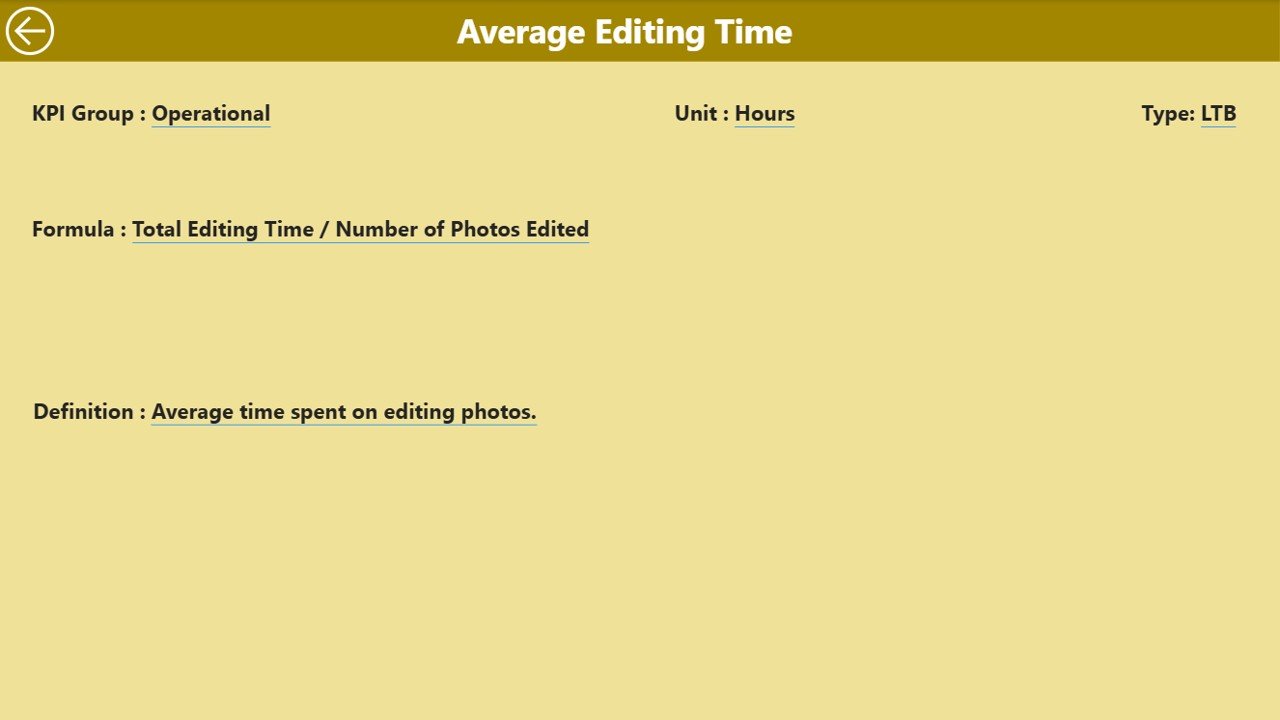
3. KPI Definition Page
The KPI Definition Page is a drill-through, hidden page:
-
Displays KPI formula, unit, group, type, and definition
-
Allows detailed analysis when drilling through from the Summary Page
-
Provides clarity for team members reviewing the KPIs
Click to Buy Photography Business KPI Dashboard in Power BI
Excel Data Inputs
The dashboard is powered by three Excel sheets:
-
Input_Actual: Fill actual numbers for each KPI, MTD and YTD, with month selected as first date of the month.
-
Input_Target: Enter target numbers for each KPI, both MTD and YTD.
-
KPI Definition: Fill KPI Number, Group, Name, Unit, Formula, Definition, and Type (LTB or UTB).
Correct and timely data entry ensures accurate dashboards and actionable insights.
Advantages of Using This Dashboard
-
Real-Time Analysis: Monitor KPIs dynamically with interactive Power BI visuals
-
Compare Performance: Analyze MTD vs. YTD and current vs. previous year trends
-
Data-Driven Decisions: Identify underperforming areas and optimize revenue and client management
-
Customizable: Add new KPIs or modify existing ones as business needs evolve
-
Professional Reporting: Generate client-ready dashboards and internal performance reports
-
Trend Analysis: Detect seasonal patterns in bookings, revenue, and projects
Best Practices for Using the Photography Business KPI Dashboard
Click to Buy Photography Business KPI Dashboard in Power BI
-
Update Excel Data Regularly: Keep actuals and targets current to reflect true performance
-
Use KPI Trend Analysis: Regularly review trends to adjust marketing, staffing, or services
-
Monitor LTB vs UTB KPIs: Focus on both metrics where lower values are better (e.g., errors, complaints) and higher is better (e.g., revenue, bookings)
-
Review Previous Year Comparison: Identify growth opportunities and avoid repeating past mistakes
-
Customize for Your Studio: Add KPIs for client satisfaction, social media engagement, or session completion rates
Frequently Asked Questions (FAQs)
Click to Buy Photography Business KPI Dashboard in Power BI
Q1: Can I add new KPIs to this dashboard?
Yes, update the KPI Definition sheet in Excel and the dashboard will accommodate new metrics.
Q2: How often should I update the data?
Monthly updates are recommended for accurate MTD and YTD tracking.
Q3: Can I compare multiple years’ data?
Yes, the dashboard includes Previous Year MTD and YTD comparisons for each KPI.
Q4: Can I customize the dashboard visuals?
Absolutely. Power BI allows you to customize charts, cards, and layout according to your preference.
Q5: Does this dashboard help track revenue and bookings?
Yes, any KPI related to revenue, session bookings, or client engagement can be tracked.
Conclusion
The Photography Business KPI Dashboard in Power BI is a comprehensive, ready-to-use solution for monitoring your studio’s performance. With MTD, YTD, and year-over-year metrics, this dashboard empowers photography businesses to track KPIs effectively, make data-driven decisions, and optimize operations for growth and client satisfaction.
Visit our YouTube channel to learn step-by-step video tutorials
Watch the step-by-step video Demo:
Click to Buy Photography Business KPI Dashboard in Power BI