Managing a brand today requires more than creative campaigns and strong visuals. You need data, clarity, and continuous monitoring. Because of this, organizations increasingly rely on Brand Management KPI Dashboards in Excel to track performance, measure impact, and improve brand value over time.
In this in-depth guide, you will learn what a Brand Management KPI Dashboard in Excel is, why it matters, how it works, which worksheets it includes, and how it helps brand managers make better decisions. Moreover, you will discover its advantages, best practices, and frequently asked questions, all explained in a simple and practical way.
Click to buy Brand Management KPI Dashboard in Excel
What Is a Brand Management KPI Dashboard in Excel?
A Brand Management KPI Dashboard in Excel is a ready-to-use analytical template designed to track, monitor, and evaluate brand-related Key Performance Indicators (KPIs) in one centralized file.
Instead of reviewing multiple spreadsheets, reports, and presentations, this dashboard allows you to:
- Monitor brand performance month by month
- Compare Actual vs Target vs Previous Year results
- Track MTD (Month-to-Date) and YTD (Year-to-Date) performance
- Identify trends and performance gaps instantly
Most importantly, Excel makes this dashboard easy to use, flexible, and highly customizable, without requiring BI tools or coding skills.
Why Do Businesses Need a Brand Management KPI Dashboard in Excel?
Brand performance directly affects revenue, customer loyalty, and market positioning. However, many teams still rely on manual tracking and scattered reports. As a result, they struggle to understand what works and what needs improvement.
A Brand Management KPI Dashboard in Excel solves these challenges because it:
- Centralizes all KPIs in one place
- Provides real-time performance visibility
- Enables faster decision-making
- Improves accountability across teams
- Supports long-term brand strategy
Therefore, if you want to manage your brand using facts instead of assumptions, this dashboard becomes essential.
How Does a Brand Management KPI Dashboard in Excel Work?
This dashboard works on a simple but powerful structure. You input data once, and Excel automatically calculates, compares, and visualizes performance.
Here is how the process flows:
- You define brand KPIs
- You enter actual, target, and previous year data
- Excel calculates MTD and YTD metrics
- Dashboards update instantly
- You analyze trends and take action
As a result, brand tracking becomes consistent, accurate, and fast.
What Are the Key Features of the Brand Management KPI Dashboard in Excel?
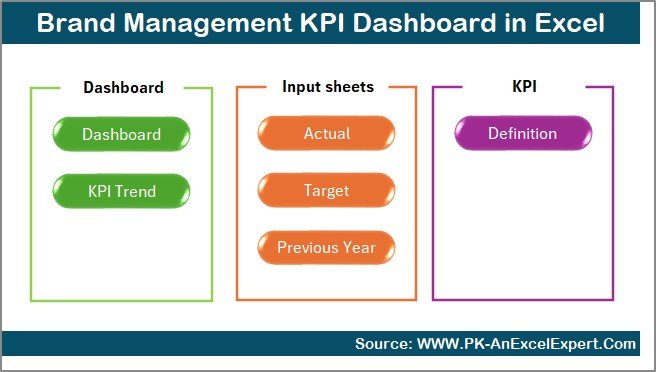
This dashboard includes 7 structured worksheets, each designed for a specific purpose. Together, they create a complete brand performance management system.
the Summary Page .
The Summary Page acts as the index sheet of the dashboard.
Key Highlights of the Summary Page:
- Serves as a navigation hub
- Includes 6 interactive buttons
- Allows one-click movement to other sheets
Click to buy Brand Management KPI Dashboard in Excel
Because of this design, users save time and avoid confusion while navigating the dashboard.
Dashboard Sheet Tab .
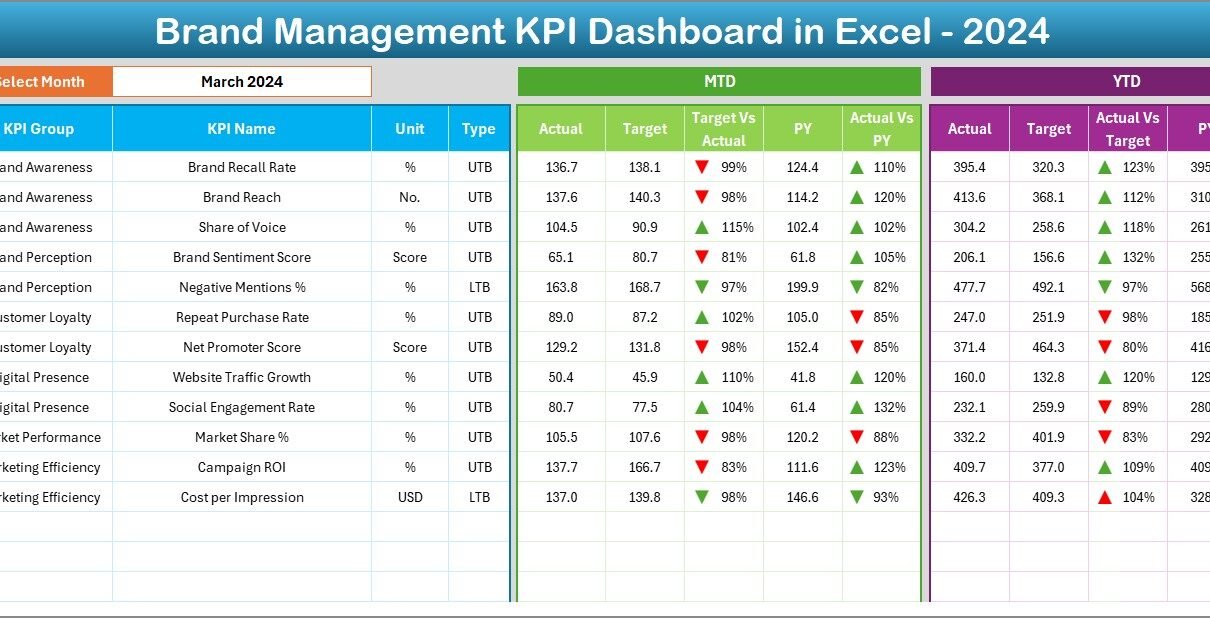
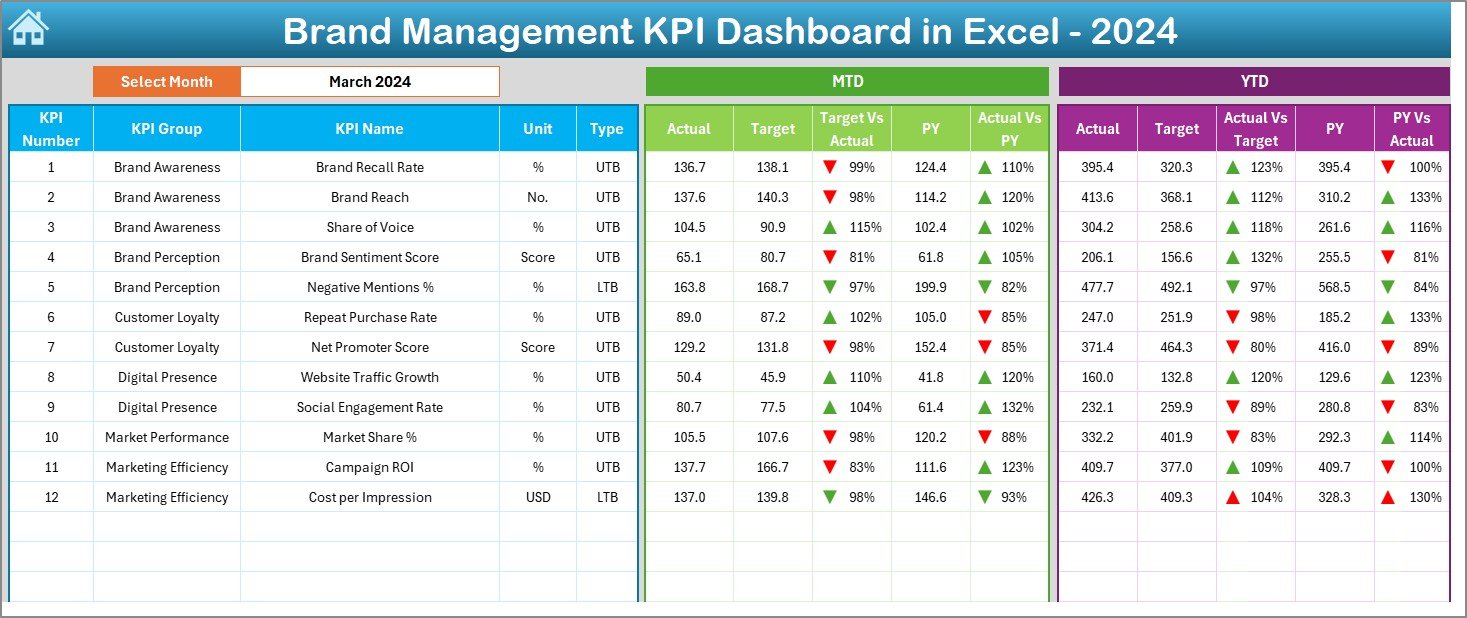
The Dashboard Sheet works as the main analytical page.
Key Features of the Dashboard Sheet:
- Displays all KPIs in one place
- Includes a Month selector in cell D3
- Automatically updates figures based on selected month
KPIs Displayed on This Page:
- MTD Actual
- MTD Target
- MTD Previous Year
- Target vs Actual comparison
- Previous Year vs Actual comparison
- YTD Actual
- YTD Target
- YTD Previous Year
Additionally, the dashboard uses conditional formatting with up and down arrows, which visually highlight performance improvements or declines. Because of this, decision-makers can quickly spot issues without scanning numbers.
Click to buy Brand Management KPI Dashboard in Excel
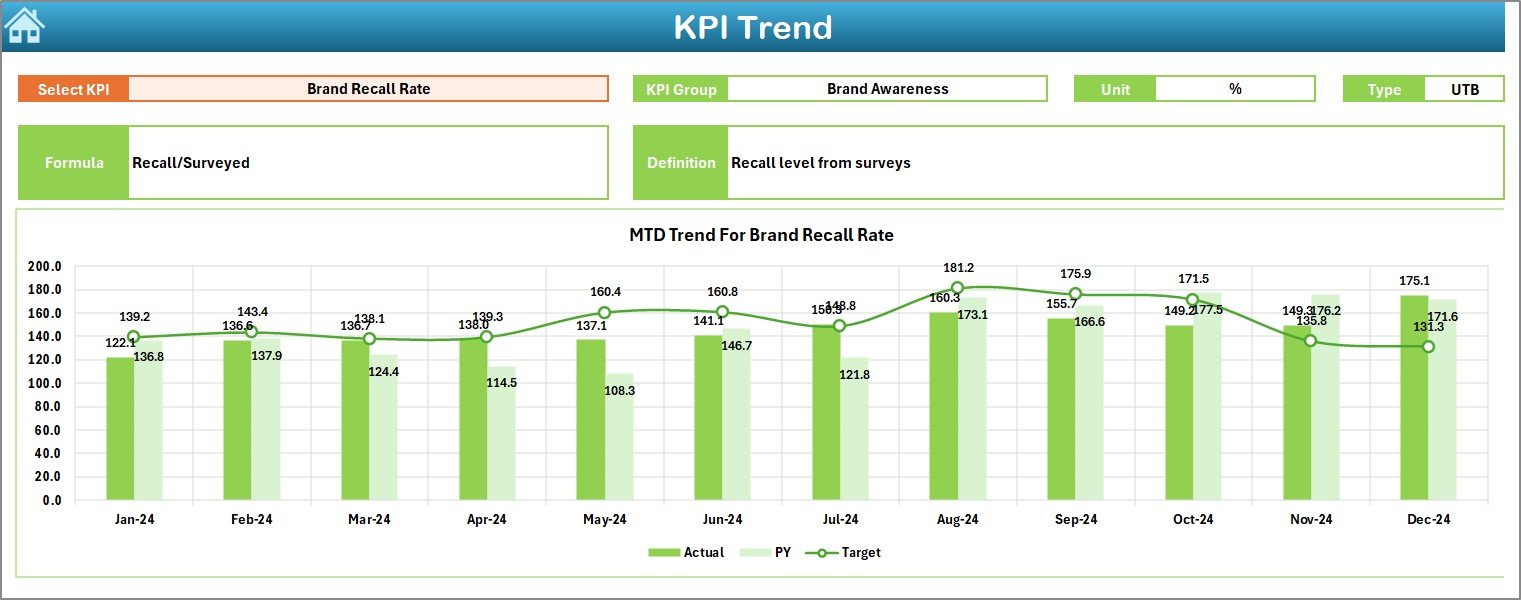
Trend Sheet .
The Trend Sheet focuses on KPI-wise performance trends.
Features of the Trend Sheet:
- KPI selection dropdown in cell C3
- Displays KPI Group, Unit, Type, Formula, and Definition
- Shows MTD trend chart for Actual, Target, and PY
- Shows YTD trend chart for Actual, Target, and PY
Since trends reveal performance direction, this sheet plays a crucial role in strategic reviews and brand planning.
Click to buy Brand Management KPI Dashboard in Excel
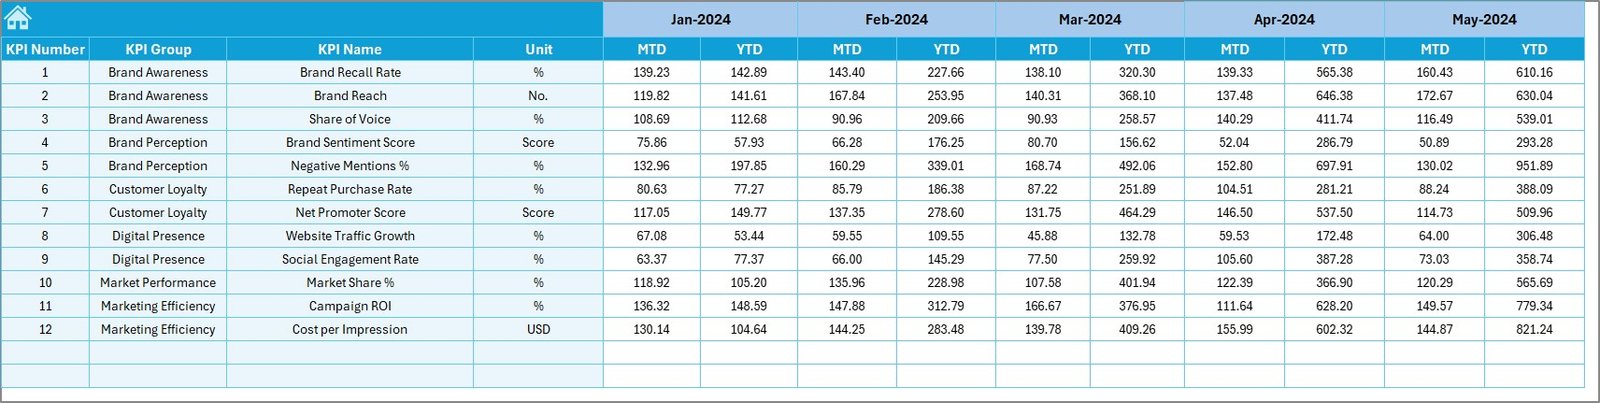
Actual Numbers Input Sheet .
The Actual Numbers Input Sheet captures real performance data.
Key Points:
- Enter MTD and YTD actual values
- Select the starting month of the year in cell E1
- Easily change months without restructuring data
Because the dashboard references this sheet, accurate input ensures reliable outputs.

Click to buy Brand Management KPI Dashboard in Excel
Target Sheet Tab.
The Target Sheet defines expected performance levels.
Use of Target Sheet:
- Enter KPI targets for each month
- Maintain MTD and YTD targets
- Compare expectations with reality
Without clear targets, performance tracking loses meaning. Therefore, this sheet is critical for accountability.
Click to buy Brand Management KPI Dashboard in Excel
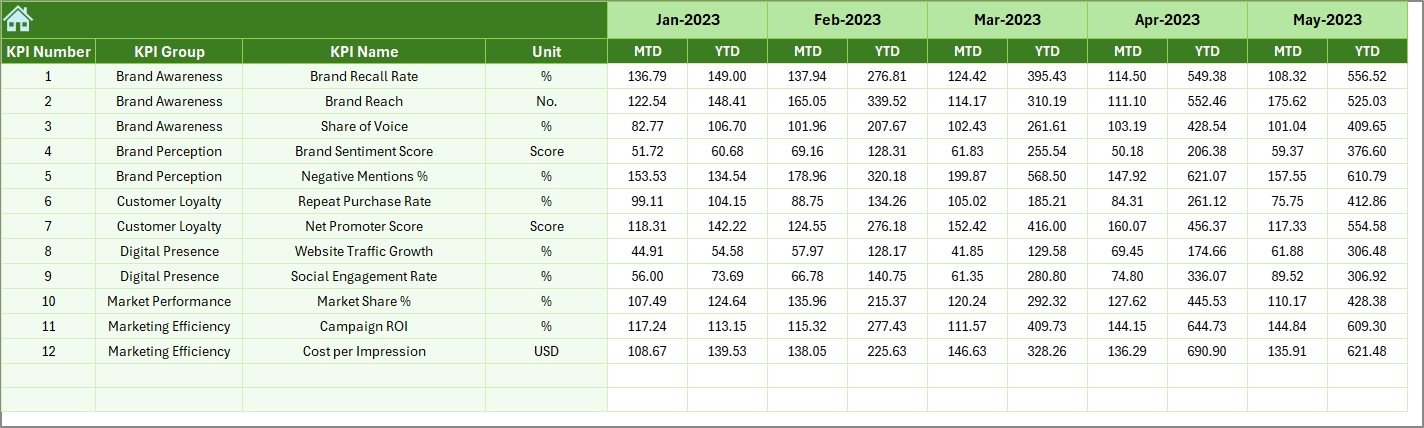
Previous Year Number Sheet.
The Previous Year (PY) Sheet stores historical data.
Benefits of Using PY Sheet:
- Enables year-over-year comparison
- Helps evaluate growth and decline
- Supports long-term trend analysis
As a result, managers can determine whether improvements are sustainable or temporary.
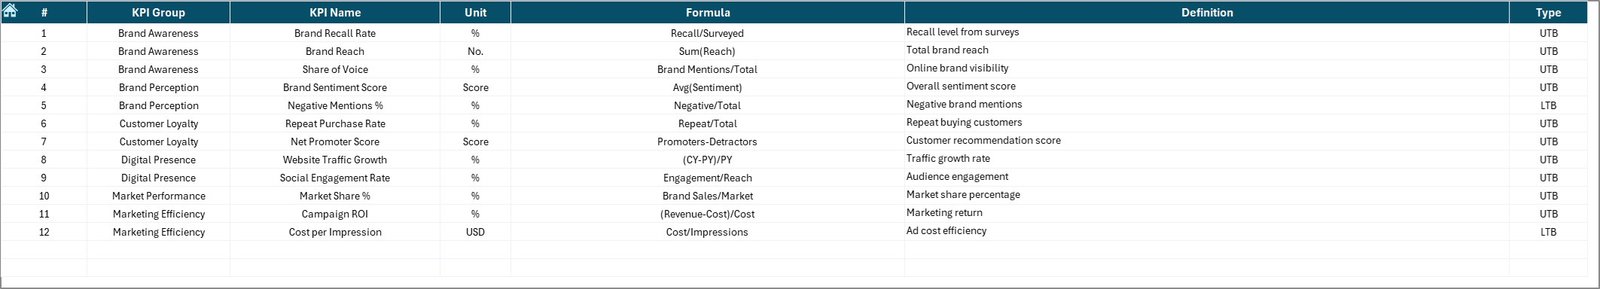
KPI Definition Sheet .
The KPI Definition Sheet standardizes performance measurement.
Information Captured:
- KPI Name
- KPI Group
- Unit of Measurement
- KPI Formula
- KPI Definition
- KPI Type (LTB or UTB)
Since clarity prevents misunderstanding, this sheet ensures everyone measures KPIs the same way.
Click to buy Brand Management KPI Dashboard in Excel
Which KPIs Can You Track in a Brand Management Dashboard?
A Brand Management KPI Dashboard in Excel can track multiple brand-related metrics such as:
- Brand Awareness %
- Brand Recall Score
- Social Media Engagement Rate
- Customer Satisfaction Score
- Net Promoter Score (NPS)
- Market Share %
- Campaign ROI
- Brand Sentiment Score
Because Excel remains flexible, you can add or modify KPIs based on your brand strategy.
Advantages of Brand Management KPI Dashboard in Excel
Using this dashboard offers several practical advantages.
Centralized Brand Performance Tracking
All brand KPIs stay in one file, which improves visibility and control.
Easy to Use and Update
Excel allows quick data entry and instant updates without technical skills.
MTD and YTD Performance Clarity
Monthly and yearly insights help teams stay aligned with goals.
Target vs Actual Comparison
Clear comparisons help identify gaps and corrective actions.
Previous Year Benchmarking
Historical comparisons support long-term strategic planning.
Visual Indicators for Faster Decisions
Charts and arrows make analysis faster and more intuitive.
Who Should Use a Brand Management KPI Dashboard in Excel?
This dashboard suits multiple roles and industries.
Ideal Users Include:
- Brand Managers
- Marketing Managers
- Digital Marketing Teams
- Corporate Strategy Teams
- Business Owners
- Marketing Consultants
Whether you manage a single product brand or multiple brands, this dashboard adapts easily.
How Can a Brand Management KPI Dashboard Improve Decision-Making?
Data-driven decisions outperform gut-based decisions. Because this dashboard provides structured insights, it helps leaders:
- Focus on high-impact KPIs
- Detect underperforming campaigns early
- Optimize brand investments
- Align marketing and business goals
- Improve accountability across teams
Therefore, the dashboard acts as a strategic decision-support system.
Best Practices for the Brand Management KPI Dashboard in Excel
Following best practices ensures long-term success.
Define Clear KPIs
Always select KPIs that align with business and brand goals.
Keep KPI Definitions Consistent
Use the KPI Definition Sheet to avoid confusion.
Update Data Regularly
Consistent updates maintain dashboard accuracy.
Review Trends Monthly
Analyze trend charts to identify patterns early.
Set Realistic Targets
Balanced targets motivate teams and improve credibility.
Limit KPI Overload
Focus on meaningful KPIs instead of tracking everything.
How Is This Dashboard Better Than Traditional Reports?
Traditional reports remain static and time-consuming. In contrast, a Brand Management KPI Dashboard:
- Updates automatically
- Provides interactive analysis
- Reduces manual work
- Saves reporting time
- Improves data storytelling
Because of this, organizations increasingly replace reports with dashboards.
Can This Dashboard Scale With Business Growth?
Yes, it certainly can.
Excel allows:
- Addition of new KPIs
- Expansion to multiple brands
- Integration with larger reporting frameworks
Therefore, this dashboard grows along with your business needs.
Conclusion:
A Brand Management KPI Dashboard in Excel transforms how organizations track, analyze, and manage brand performance. It replaces manual reporting with structured insights, clear comparisons, and actionable trends.
By using this dashboard, brand managers gain clarity, control, and confidence. Moreover, Excel ensures flexibility, affordability, and ease of use. As a result, any organization serious about brand growth should adopt this dashboard.
Frequently Asked Questions (FAQs)
- What is the main purpose of a Brand Management KPI Dashboard in Excel?
The main purpose is to track, analyze, and improve brand performance using measurable KPIs in one centralized Excel file.
- Do I need advanced Excel skills to use this dashboard?
No, the dashboard uses simple Excel features. Basic Excel knowledge is enough.
- Can I customize KPIs in the Brand Management Dashboard?
Yes, you can easily add, remove, or modify KPIs based on your business needs.
- How often should I update the dashboard?
You should update it monthly to keep MTD and YTD performance accurate.
- Can this dashboard track multiple brands?
Yes, with slight customization, you can track performance for multiple brands.
- Is Excel suitable for brand analytics compared to BI tools?
Yes, Excel works perfectly for small to mid-scale brand analytics without added costs or complexity.
- Does this dashboard support long-term trend analysis?
Yes, trend sheets and PY comparisons help analyze both short-term and long-term performance.
Visit our YouTube channel to learn step-by-step video tutorials
Watch the step-by-step video tutorial:
Click to buy Brand Management KPI Dashboard in Excel