Part of the free Module 7: Conditional Formatting · Lesson 8 of 15 · Full Excel course
Updated on 5 September 2026 · Works in Excel 365, 2021, 2019 and 2016 unless noted.
Format only top or bottom ranked values is the conditional formatting rule type that ranks the numbers in a range and highlights the highest or lowest ones. You choose Top or Bottom, enter a count such as 10, and optionally tick % of the selected range to highlight a share of the cells instead of a fixed number.
What the rule does
The rule sorts every numeric cell in the Applies to range from largest to smallest and formats the cells at one end of that ranking. The ranking is recalculated on every change, so the highlight moves as new figures arrive. That is what a leaderboard, a top customer list or an exception report needs: you never edit the rule, you only type new data.
Three inputs control it. The drop-down is Top or Bottom. The number box accepts a whole number from 1 to 1000. The % of the selected range tick box switches that number into a percentage of the cells, and then accepts 1 to 100.
How it differs from the Top/Bottom Rules presets
The ribbon presets in Home > Conditional Formatting > Top/Bottom Rules create the same underlying rule. The difference is the dialog you get and how much of the format you control.
| Point of difference | Top/Bottom Rules preset | New Rule: top or bottom ranked values |
|---|---|---|
| Where you start | Top/Bottom Rules submenu, one item per variant | New Rule dialog, one entry for all variants |
| Count or percent | Separate menu items (Top 10 Items, Top 10%) | One tick box switches between them |
| Formatting choices | Six ready-made fills plus Custom Format | Format Cells dialog opens directly |
| Number format | Only through Custom Format | Available on the Number tab straight away |
| Above or below average | Included in the same submenu | A separate rule type, covered in the next lesson |
Both routes end up as identical entries in the Conditional Formatting Rules Manager, and editing a preset there opens the dialog described below. Use the presets for speed and the New Rule dialog when you want a specific colour, border, bold font or number format.
Step by step: highlight the top 10 values
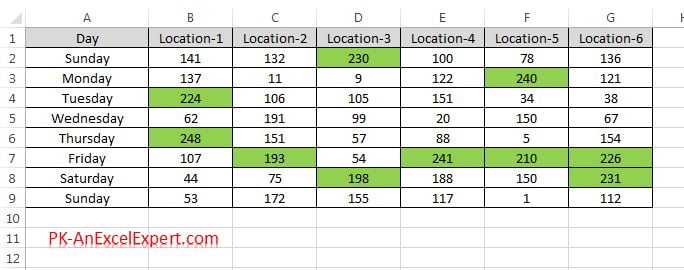
The example uses a day-wise, location-wise sales table in B2:G9.
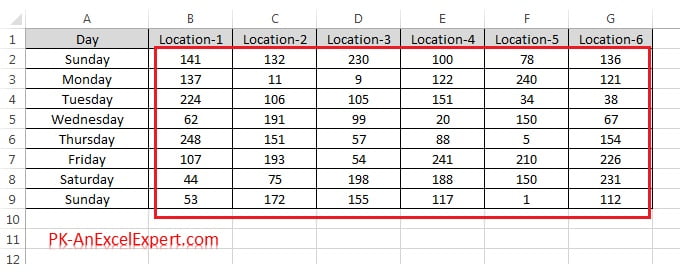
- Select the range B2:G9. Select only the numbers, not the header row or the day labels.
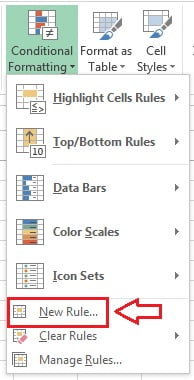
- Go to Home > Conditional Formatting > New Rule.
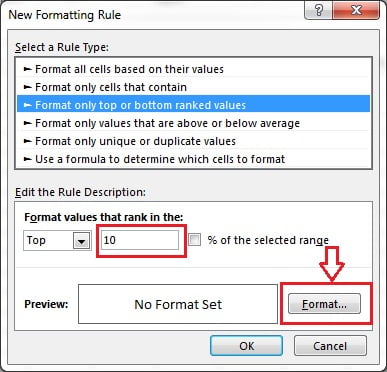
- In the New Formatting Rule dialog choose Format only top or bottom ranked values. Set the drop-down to Top and type 10 in the number box. Leave % of the selected range unticked so the rule marks ten cells rather than ten percent of them.
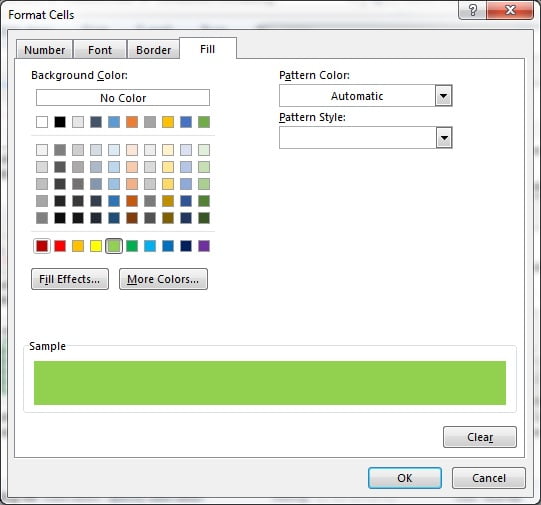
- Click Format. In the Format Cells dialog set a fill, font colour, border or number format and click OK. Font name and font size cannot be changed by any conditional format.
- Click OK again. The ten largest values in the selection are formatted, and the highlight follows the data whenever a figure changes.
Highlight the bottom 10 values
The bottom rule is the mirror image. Keep the same selection so both rules cover the same cells.
- With B2:G9 still selected, open New Rule and pick the same rule type.
- Change the drop-down from Top to Bottom and enter 10.
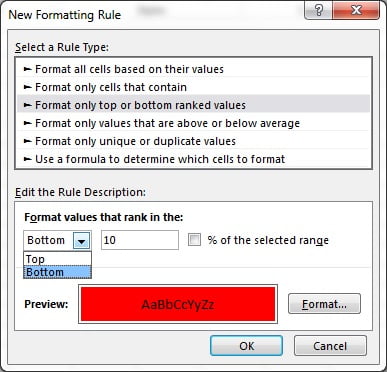
- Click Format, choose a contrasting fill such as light red, and click OK twice.
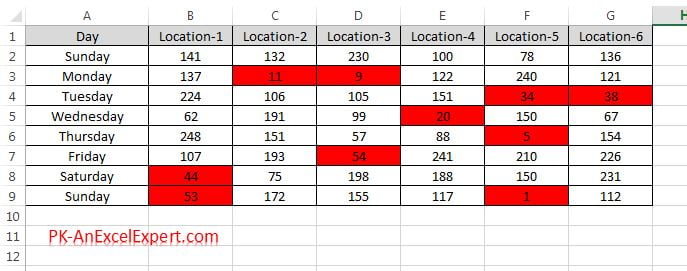
The two rules format different cells, so their order in the rules manager does not matter here. Order matters only when two rules can be true for the same cell, which is the subject of the rule precedence lesson.
Top or bottom by percent of the selected range
Ticking % of the selected range turns the number into a share of the cells that hold numbers, not a share of the total value. Excel works out the count and rounds down to a whole number of cells: on a block of 48 numbers, Top 10 percent formats the 4 largest values, because 10 percent of 48 is 4.8. Percent is the better choice when the list grows and shrinks each month, because the highlight scales with the data. A fixed count is better when the number itself is the business rule, such as reviewing the five slowest lines every week.
Applying the rule per column instead of the whole range
One rule on B2:G9 ranks all 48 cells together, so a strong location can take every place in the top ten and a weak one none. That is right when the columns hold the same measure in the same units, and wrong when they hold different measures, because the larger numbers always win. To rank each column on its own, create one rule per column:
- Select B2:B9 only and build the Top 10 rule as above.
- With B2:B9 still selected, double-click Home > Clipboard > Format Painter and drag across C2:C9, then D2:D9, and so on. Press Esc to release it.
- Open Home > Conditional Formatting > Manage Rules and set Show formatting rules for to This Worksheet. You will see one rule per column, each with its own Applies to range.
Do not widen the Applies to box of a single rule to B2:G9, because that merges the columns back into one ranking. A multi-area Applies to such as =$B$2:$B$9,$C$2:$C$9 does not help either; Excel still treats the rule as one pool of cells.
Ties, blanks, zeros and text
The rule counts cells, not distinct values, and it never splits a tie. If the third and fourth largest values are both 192, a Top 3 rule formats four cells. That is usually what you want on a leaderboard, but it does mean a top 3 highlight can show more than three cells.
| Cell content | How the rule treats it |
|---|---|
| Number | Ranked normally, negatives included |
| Zero | Ranked as a number, so it usually fills a Bottom rule |
| Blank cell | Ignored and not counted towards the percentage |
| Text, including numbers stored as text | Ignored and never formatted |
| Formula returning empty text | Ignored, because the result is text |
| Error value such as #N/A | Ignored by this rule type |
The equivalent formula rule with LARGE and SMALL
The built-in rule has one real limit: the number box only accepts a typed constant, so you cannot point it at an input cell. A formula rule removes that limit and lets you rank per row or per column as well. For the top 3 of a column of values in B2:B21, select B2:B21, choose New Rule > Use a formula to determine which cells to format and enter:
=B2>=LARGE($B$2:$B$21,3)
For the bottom 3, swap the function and the operator:
=B2<=SMALL($B$2:$B$21,3)
The references matter. You write the formula for the top-left cell of the Applies to range, which is the active cell in your selection, and Excel copies it across the range exactly like a fill. B2 is relative, so in cell B7 the rule tests B7. $B$2:$B$21 is locked with dollar signs, so every cell is compared against the same list. Lock only the column, as in $B2, and every cell in a row is tested against column B of its own row, which gives a whole-row highlight. Lock only the row, as in B$2, and you get the column-wide version. Lock both, as in $H$1, when you point at a single input cell. Excel reads the result as TRUE or FALSE, and any non-zero number counts as TRUE.
To drive the count from a cell, type 3 in H1 and use =B2>=LARGE($B$2:$B$21,$H$1). To rank inside each row of a table instead, select B2:G9 and use =B2>=LARGE($B2:$G2,3), which marks the three best locations in every row. One warning: the rule’s formula box starts in point mode, so an arrow key inserts a cell reference instead of moving the cursor. Press F2 first to switch to edit mode.
Worked example
A sales manager wants the three best days in each location shaded green and the single worst figure in the whole table shaded red. Sample data:
| Day | Location-1 | Location-2 | Location-3 |
|---|---|---|---|
| Monday | 192 | 148 | 176 |
| Tuesday | 165 | 192 | 131 |
| Wednesday | 184 | 171 | 203 |
| Thursday | 158 | 160 | 149 |
- Select B2:B5, open New Rule > Format only top or bottom ranked values, choose Top, enter 3, set a green fill and click OK.
- Copy that rule to C2:C5 and D2:D5 with the Format Painter so each location is ranked separately.
- Select B2:D5, open New Rule again, choose Bottom, enter 1, set a light red fill and click OK.
Result: in Location-1 the green cells are 192, 184 and 165; in Location-2, 192, 171 and 160; in Location-3, 203, 176 and 149. The bottom rule marks 131, the lowest figure across all twelve cells. Notice that 149 is green even though it is a low number, because it is the third best value in its own column. Swap step 1 for the formula =B2>=LARGE(B$2:B$5,3) and a single rule on B2:D5 does the same job, because the row-locked reference makes each column rank on its own.
Tips and common mistakes
- Percent counts cells, not value. Top 10 percent of 60 cells is the 6 largest cells, not the cells that make up 10 percent of the total.
- Expect more cells than you asked for. Ties at the cut-off are all formatted, so a Top 3 rule can shade four or five cells.
- Leave totals out of the selection. A total row always wins a Top rule and hides the real leaders.
- Watch the zeros. Zeros are ranked, so a Bottom rule on a sparse table often marks nothing but zeros. Filter them out or use a formula rule such as
=AND(B2<>0,B2<=SMALL($B$2:$B$21,3)). - Numbers stored as text are invisible to the rule. A green triangle in the corner of the cell is the clue. Convert the column with Data > Text to Columns before applying the rule.
- Use one rule per column for mixed measures. A single rule across revenue and unit columns ranks pounds against pieces.
- Do not reapply the rule. Each run of the dialog adds another rule. Check Manage Rules and edit the existing one instead.
Errors and how to fix them
| Symptom | Cause | Fix |
|---|---|---|
| Nothing is highlighted | The range holds text or numbers stored as text | Convert to real numbers, then reapply the rule |
| More cells than the count you entered | Values are tied at the cut-off | Expected behaviour; reduce the count or use a tie-breaker column |
| Too few cells with a percent rule | Percent is rounded down to whole cells | Raise the percentage or switch to a fixed count |
| One column takes the whole top ten | A single rule ranks the entire selection | Create one rule per column or use a formula rule with a locked row |
| The number box will not accept a cell reference | The built-in rule only takes a constant | Use =B2>=LARGE($B$2:$B$21,$H$1) in a formula rule |
| Highlight disappears after sorting | The rule was split into fragments by copy and paste | Open Manage Rules, delete the duplicates and reapply one rule to the full range |
Practice exercise
Open the course practice file or use any table of numbers, then:
- Apply a Top 10 rule to the whole sales block with a green fill, and a Bottom 10 rule with a red fill.
- Edit the Top rule through Manage Rules, tick % of the selected range and note how many cells stay highlighted.
- Build a Top 3 rule on one column, then copy it to the other columns with the Format Painter and check the Applies to ranges in Manage Rules.
- Replace the built-in Top 3 rule with the formula
=B2>=LARGE($B$2:$B$9,3)and confirm the same cells light up. - Put the number 3 in an empty cell, point the formula at it with
$H$1, then change the cell to 5 and watch the highlight grow.
Key takeaways
- Format only top or bottom ranked values highlights the highest or lowest cells in a range and updates automatically.
- The tick box switches the number from a count of cells to a percentage of the cells, rounded down.
- It is the same rule as the Top/Bottom Rules presets, but with the full Format Cells dialog behind it.
- Ties at the cut-off are all included, blanks and text are ignored, and zeros are ranked as numbers.
- One rule ranks the whole selection; use one rule per column when the columns hold different measures.
- A formula rule with LARGE or SMALL adds what the dialog cannot do: a count taken from a cell, and ranking per row or per column.
Related lessons
- Conditional Formatting course hub
- Top/Bottom Rules: the ribbon presets
- New Rule: format only values above or below average
- Use a formula to determine which cells to format
- Rule precedence and Stop If True
- Manage and clear conditional formatting rules
- Excel formulas course for LARGE, SMALL and the rest of the function library
- Microsoft Support: Highlight patterns and trends with conditional formatting
Frequently asked questions
What is the difference between this rule and the Top 10 Items preset?
They create the same rule. The preset gives you a small dialog with six ready-made fills, while the New Rule version opens the full Format Cells dialog, so you can set a border, a bold font or a number format. The New Rule dialog also holds the count and the percent option together, instead of splitting them across two menu items.
Why does my Top 3 rule highlight five cells?
Two or more values are tied at the third position. The rule counts cells by rank and never breaks a tie, so every cell holding the third-place value is formatted. If you need exactly three cells, add a tie-breaker such as a small index column and rank on a formula that combines the value with the index.
Can the number of top items come from a cell?
Not in the built-in rule; that box only accepts a typed number from 1 to 1000. Use a formula rule instead, for example =B2>=LARGE($B$2:$B$21,$H$1), with the count in H1. The absolute reference keeps every cell in the range looking at the same input cell, so changing H1 changes the highlight instantly.
How do I highlight the top value in each row separately?
The built-in rule ranks the whole Applies to range as one pool. Select the whole block and use a formula rule such as =B2=MAX($B2:$G2), or =B2>=LARGE($B2:$G2,3) for the top three. Locking only the column letters makes each row compare against its own row of figures.
Can I show the top 10 and the bottom 10 on the same range?
Yes. Create two rules on the same range with different formats. They format different cells, so both apply. If a rule ever overlaps another and both set the same property, such as fill, the rule higher in the Conditional Formatting Rules Manager wins; use Move Up and Move Down to change that.
Want the finished version? Ready-made Excel KPI dashboards with top and bottom performer highlighting built in are available at NextGenTemplates.com.