Managing business performance effectively requires a structured approach to monitor key metrics. The General Management KPI Scorecard in Excel is a ready-to-use tool designed to help managers track, analyze, and improve organizational performance efficiently. This scorecard consolidates critical KPIs, making it easier to evaluate progress, identify gaps, and drive business success.
In this article, we will explore the features, benefits, best practices, and frequently asked questions about the General Management KPI Scorecard in Excel.
What is the General Management KPI Scorecard in Excel?
The General Management KPI Scorecard is an Excel-based performance tracking tool that allows organizations to monitor key business indicators in a single, interactive platform. It provides insights into both current and historical performance, comparing actual results against targets for multiple KPIs.
This tool is ideal for executives, managers, and team leaders who want a clear, data-driven view of organizational performance. By using this scorecard, businesses can make informed decisions and drive improvement initiatives effectively.
Key Features of the General Management KPI Scorecard
Click to Buy General Management KPI Scorecard in Excel
The scorecard template includes five sheet tabs, each designed to provide specific insights and functionality:
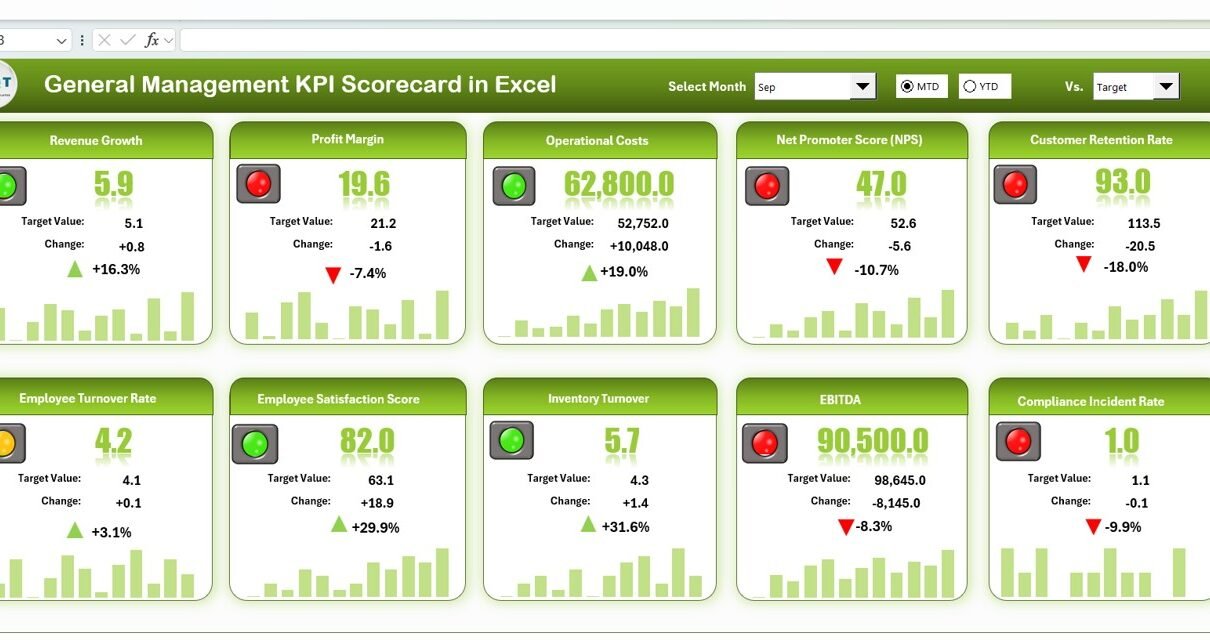
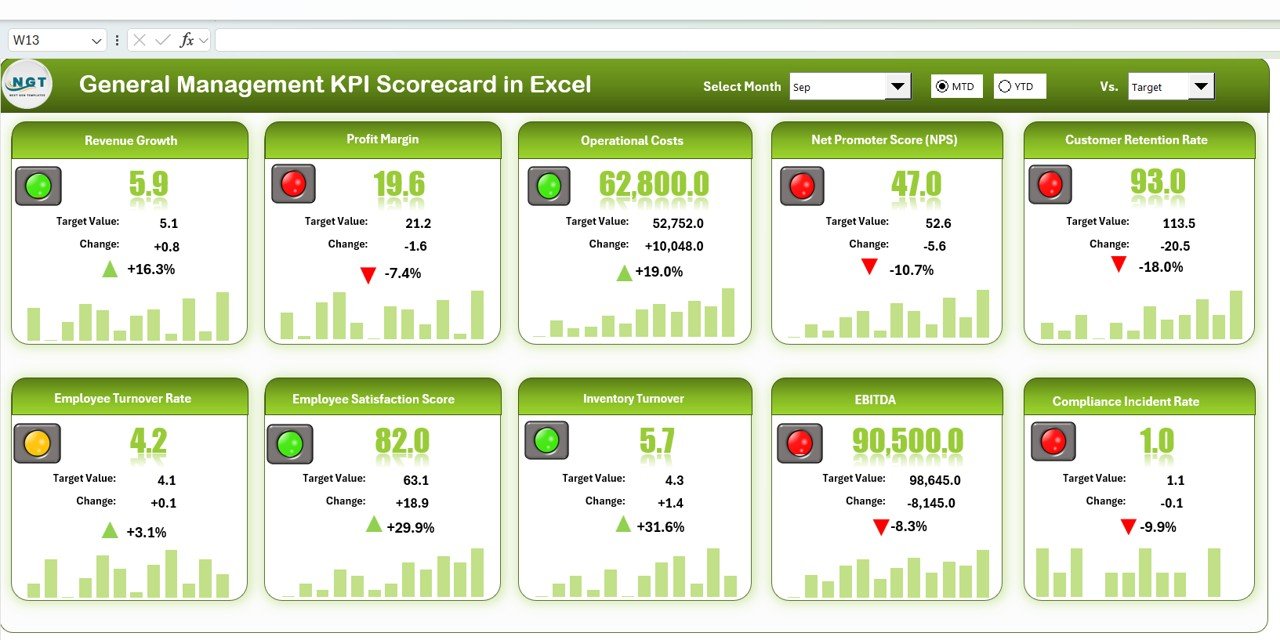
1. Scorecard Sheet Tab
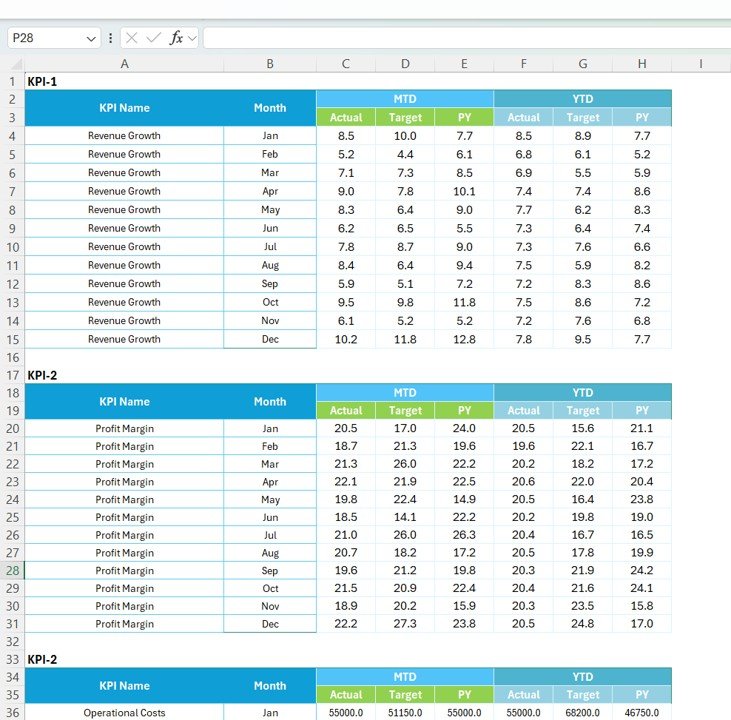
The Scorecard sheet is the main interface where you can view KPI performance. Key features include:
-
Dropdown Menus: Select the month, MTD (Month-to-Date), or YTD (Year-to-Date) for performance analysis.
-
Actual vs Target Values: Compare actual performance against targets for each KPI.
-
Visual Indicators: Quickly see performance status using color-coded visuals or conditional formatting.
-
Comprehensive KPI Overview: Display all relevant information about KPIs, including MTD and YTD comparisons.
This sheet provides a clear snapshot of organizational performance and highlights areas that need attention.
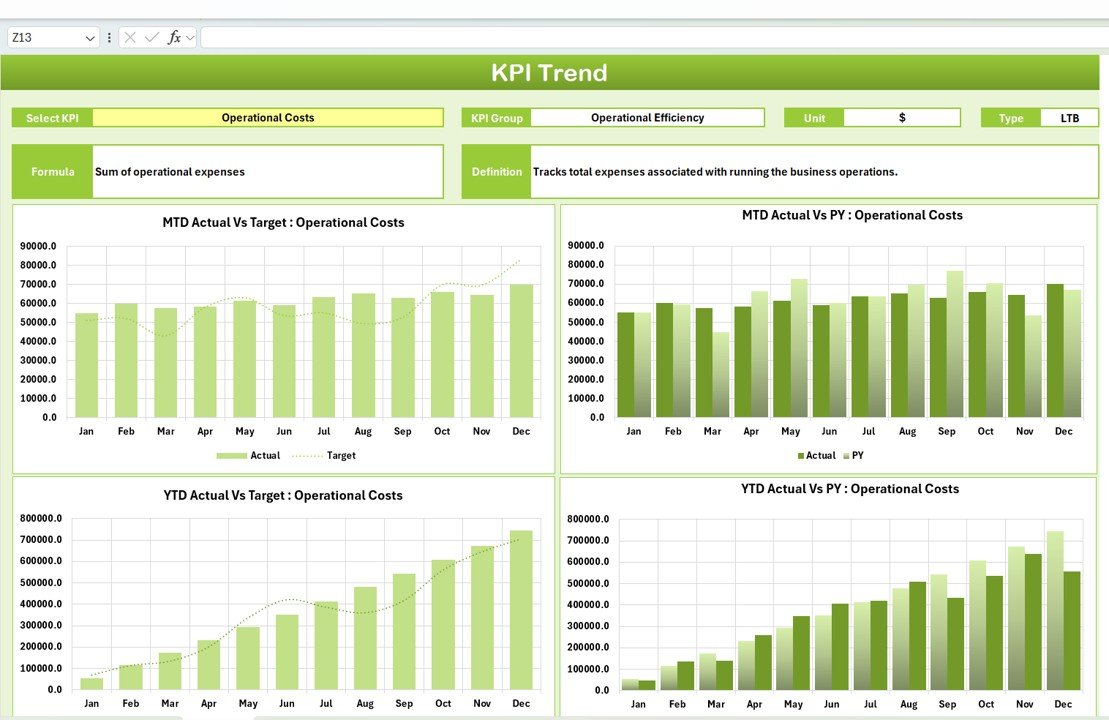
2. KPI Trend Sheet
The KPI Trend sheet provides visual insights into KPI performance over time.
-
KPI Selection: Choose a KPI from the dropdown menu available in range C3.
-
Displayed Information: See KPI Group, Unit, and Type (Lower the Better or Upper the Better).
-
Trend Analysis: Evaluate trends for individual KPIs to identify patterns or deviations over time.
By using the trend analysis, managers can make proactive decisions to improve performance.
Click to Buy General Management KPI Scorecard in Excel
3. Input Data Sheet
The Input Data sheet is where you enter all KPI data.
-
Data Entry: Record actual values, targets, and other metrics for each KPI.
-
Flexibility: Easily update data as new results become available, ensuring the scorecard remains current.
This sheet forms the foundation for all calculations and visualizations in the scorecard.
4. KPI Definition Sheet
The KPI Definition sheet serves as a reference for all KPIs included in the scorecard.
-
Details Captured: Include KPI Name, KPI Group, Unit, Formula, and Definition.
-
Clarity and Consistency: Ensures that all team members understand the purpose and calculation of each KPI.
Maintaining a clear KPI definition helps avoid confusion and supports accurate reporting.

Click to Buy General Management KPI Scorecard in Excel
5. Color Settings Sheet
The Color Settings sheet allows you to customize the appearance of the scorecard.
-
Visual Customization: Adjust colors for different KPI categories, targets, or performance indicators.
-
Enhanced Readability: Use colors to highlight critical KPIs, targets met, or performance gaps.
A well-formatted scorecard improves readability and facilitates quick decision-making.

Advantages of the General Management KPI Scorecard
Using this scorecard provides several benefits to managers and organizations:
-
Centralized Performance Tracking: Monitor all critical KPIs in one place.
-
Data-Driven Decisions: Compare actual vs. target performance to identify gaps.
-
Trend Analysis: Evaluate KPI trends to anticipate challenges and opportunities.
-
Customizable Visuals: Adjust colors and formatting to highlight key metrics.
-
Enhanced Accountability: Clear definitions and responsible owners improve accountability across teams.
Best Practices for Using the General Management KPI Scorecard
Click to Buy General Management KPI Scorecard in Excel
To get the most out of your scorecard, follow these best practices:
-
Update Data Regularly: Keep the Input Data sheet current for accurate reporting.
-
Use Clear KPI Definitions: Ensure each KPI is well-defined to avoid misinterpretation.
-
Monitor Trends: Use the KPI Trend sheet to identify patterns and act proactively.
-
Leverage Conditional Formatting: Highlight critical metrics using color codes to quickly spot issues.
-
Review Scorecard Monthly: Regularly review the scorecard to track progress and make informed decisions.
How to Use the General Management KPI Scorecard
-
Enter Data: Start by entering actual and target values in the Input Data sheet.
-
Select Month and Period: Use the dropdowns in the Scorecard sheet to filter MTD or YTD performance.
-
Analyze Trends: Use the KPI Trend sheet to evaluate performance patterns.
-
Check Definitions: Refer to the KPI Definition sheet for clarity on each metric.
-
Customize Visuals: Adjust colors in the Color Settings sheet to highlight key insights.
By following these steps, managers can maintain a structured, actionable view of business performance.
Frequently Asked Questions (FAQs)
Click to Buy General Management KPI Scorecard in Excel
1. Can I add new KPIs to the scorecard?
Yes, you can add new KPIs by updating the KPI Definition sheet and entering data in the Input Data sheet.
2. How do I track monthly and yearly performance?
Use the dropdowns in the Scorecard sheet to switch between MTD (Month-to-Date) and YTD (Year-to-Date) views.
3. Can I customize the colors in the scorecard?
Yes, the Color Settings sheet allows full customization of the visual elements and KPI indicators.
4. Is this template suitable for multiple departments?
Absolutely. The scorecard can track KPIs across different departments or teams by grouping metrics appropriately.
5. Does this template work with Excel versions across platforms?
Yes, the template is compatible with most modern versions of Excel, including Windows and Mac platforms.
Visit our YouTube channel to learn step-by-step video tutorials
Watch the step-by-step video Demo:
Click to Buy General Management KPI Scorecard in Excel