Running a glass manufacturing unit without clear performance visibility often leads to higher waste, increased downtime, missed targets, and delayed decisions. Although production teams generate大量 data every day, many organizations still rely on manual reports, scattered spreadsheets, or delayed MIS files. Because of this, managers struggle to understand what actually drives performance.
That is exactly where a Glass Manufacturing KPI Dashboard in Excel becomes essential.
A Glass Manufacturing KPI Dashboard in Excel transforms raw production data into clear, visual, and actionable insights. Moreover, it allows plant managers, production heads, and operations teams to track performance in real time without using complex software or expensive BI tools.
In this article, you will learn what a Glass Manufacturing KPI Dashboard in Excel is, how it works, which sheets it includes, what KPIs it tracks, and how it helps improve productivity and quality. Additionally, you will explore its advantages, best practices, and frequently asked questions.
Click to buy Glass Manufacturing KPI Dashboard in Excel
What Is a Glass Manufacturing KPI Dashboard in Excel?
A Glass Manufacturing KPI Dashboard in Excel is a ready-to-use analytics template designed to monitor, track, and analyze key performance indicators related to glass production operations.
Instead of manually checking production reports, quality logs, and downtime records, this dashboard consolidates everything into one interactive Excel file. As a result, decision-makers can quickly understand operational health, identify gaps, and act faster.
Most importantly, Excel makes this dashboard accessible to everyone. You do not need Power BI, SQL, or coding skills. You only need structured data and the right KPI framework.
Why Do Glass Manufacturers Need a KPI Dashboard?
Glass manufacturing involves complex processes such as melting, forming, annealing, inspection, and packaging. Because each stage impacts cost, quality, and delivery, tracking the right KPIs becomes critical.
Without a KPI dashboard:
- Scrap increases due to delayed quality insights
- Energy costs rise because inefficiencies go unnoticed
- Machine downtime impacts delivery schedules
- Management decisions become reactive instead of proactive
On the other hand, a Glass Manufacturing KPI Dashboard in Excel provides clarity, consistency, and control. Therefore, organizations can move from guesswork to data-driven decisions.
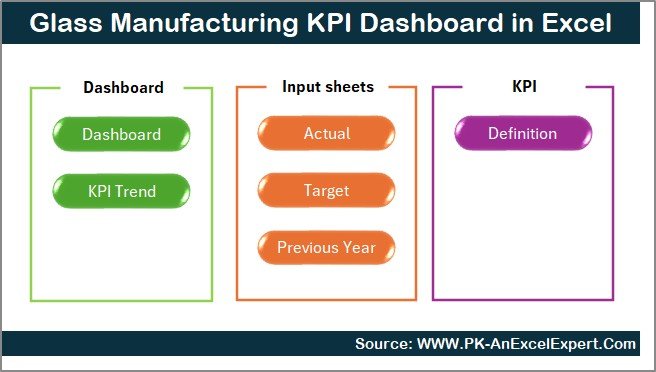
What Are the Key Features of the Glass Manufacturing KPI Dashboard in Excel?
This Glass Manufacturing KPI Dashboard in Excel includes 7 structured worksheets, each designed for a specific purpose. Together, they create a complete performance monitoring system.
How Does the Summary Page Work in a Glass Manufacturing KPI Dashboard?
Summary Page (Index Sheet)
The Summary Page acts as the navigation center of the dashboard.
Here, you will find:
- A clean index layout
- 6 clickable buttons
- Direct navigation to each analytical worksheet
Because of this structure, users can move between sheets instantly without scrolling or searching. As a result, even non-technical users feel comfortable using the dashboard.
Click to buy Glass Manufacturing KPI Dashboard in Excel
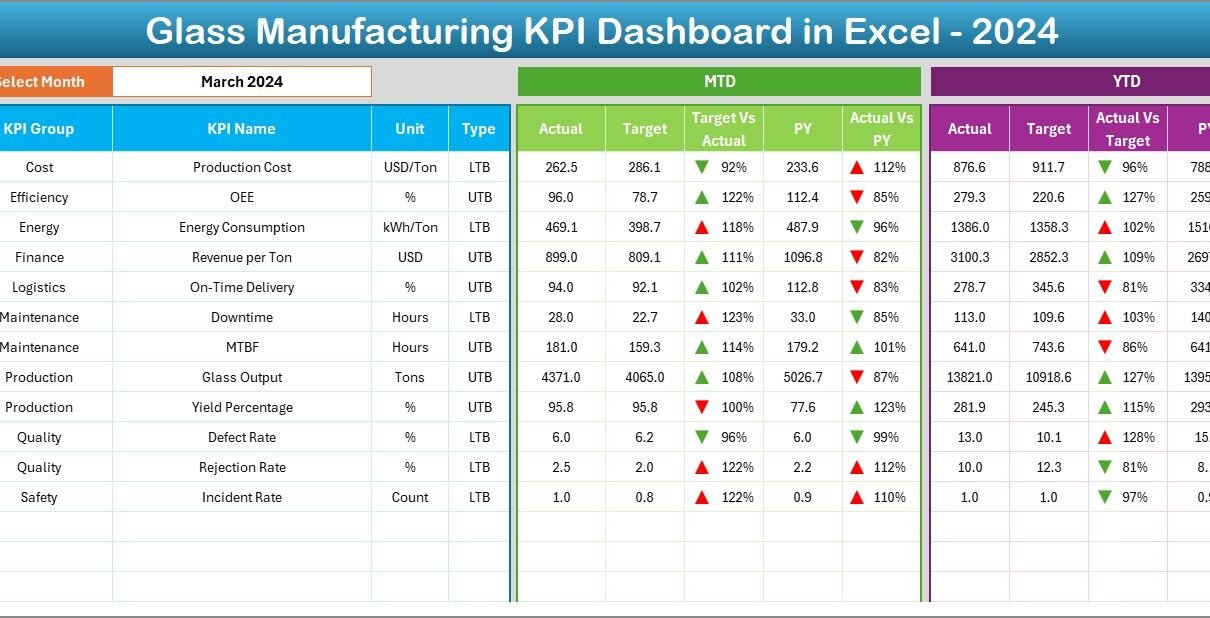
What Information Does the Main Dashboard Sheet Show?
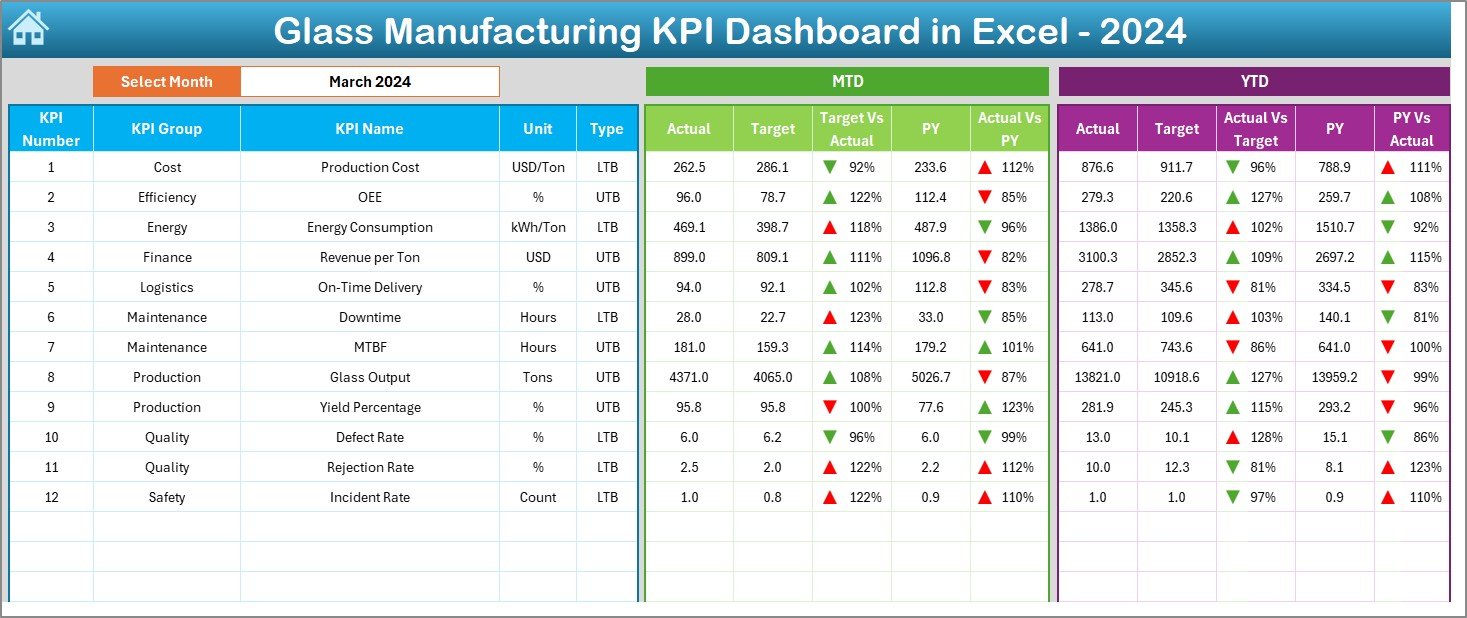
Dashboard Sheet Tab (Main Performance View)
The Dashboard Sheet serves as the core of the Glass Manufacturing KPI Dashboard in Excel.
Key Features of the Dashboard Sheet:
- Month Selector (Cell D3)
You can select any month from the drop-down list. Instantly, the entire dashboard updates for that selected month. - MTD Performance Section
Displays: - MTD Actual
- MTD Target
- MTD Previous Year (PY)
- Target vs Actual comparison
- PY vs Actual comparison
- YTD Performance Section
Displays: - YTD Actual
- YTD Target
- YTD Previous Year (PY)
- Target vs Actual comparison
- PY vs Actual comparison
- Conditional Formatting Arrows
Up and down arrows immediately highlight whether performance improves or declines.
Because visual cues drive faster understanding, managers can act quickly without analyzing raw numbers.
Click to buy Glass Manufacturing KPI Dashboard in Excel
How Does the Trend Analysis Sheet Help Decision-Making?
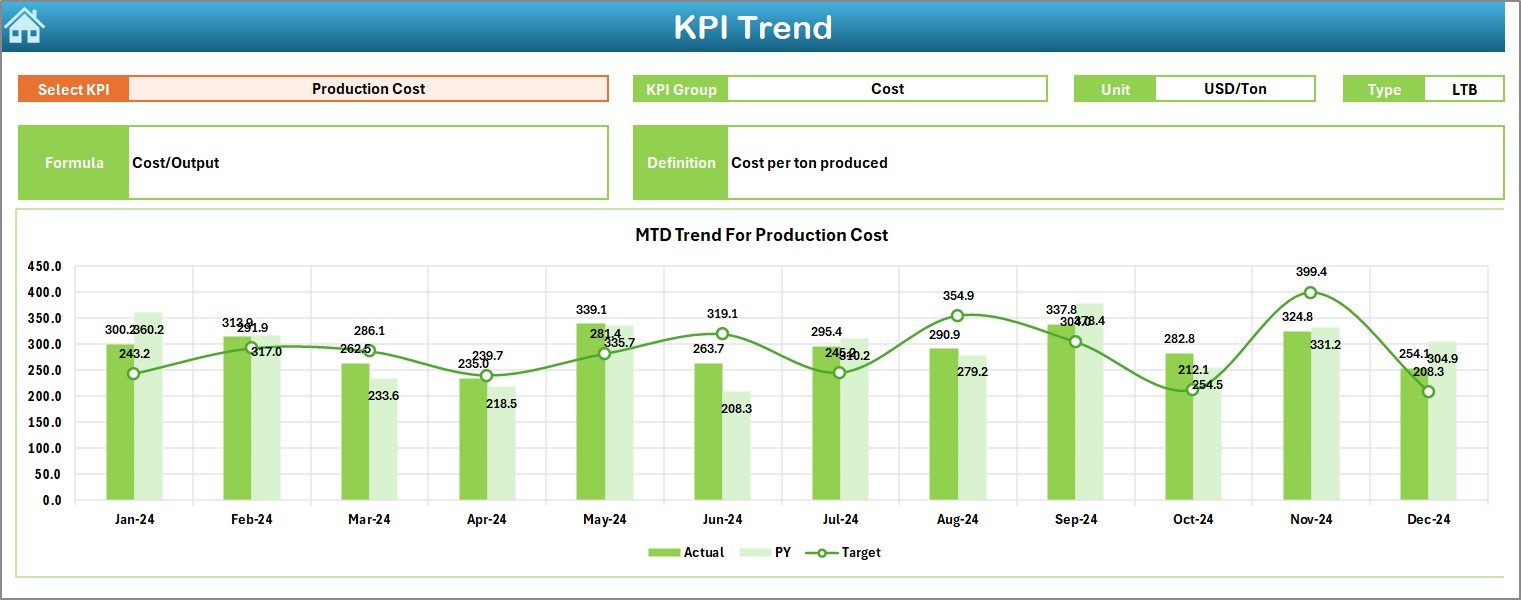
Trend Sheet Tab
The Trend Sheet focuses on individual KPI performance over time.
What You Can Do Here:
- Select a KPI name from the drop-down (Cell C3)
- View complete KPI metadata:
- KPI Group
- Unit of Measurement
- KPI Type (Lower the Better or Upper the Better)
- KPI Formula
- KPI Definition
Trend Charts Included:
- MTD Trend for Actual, Target, and PY
- YTD Trend for Actual, Target, and PY
Because trends tell stories, this sheet helps users detect recurring issues, seasonal problems, or continuous improvement patterns.
Click to buy Glass Manufacturing KPI Dashboard in Excel
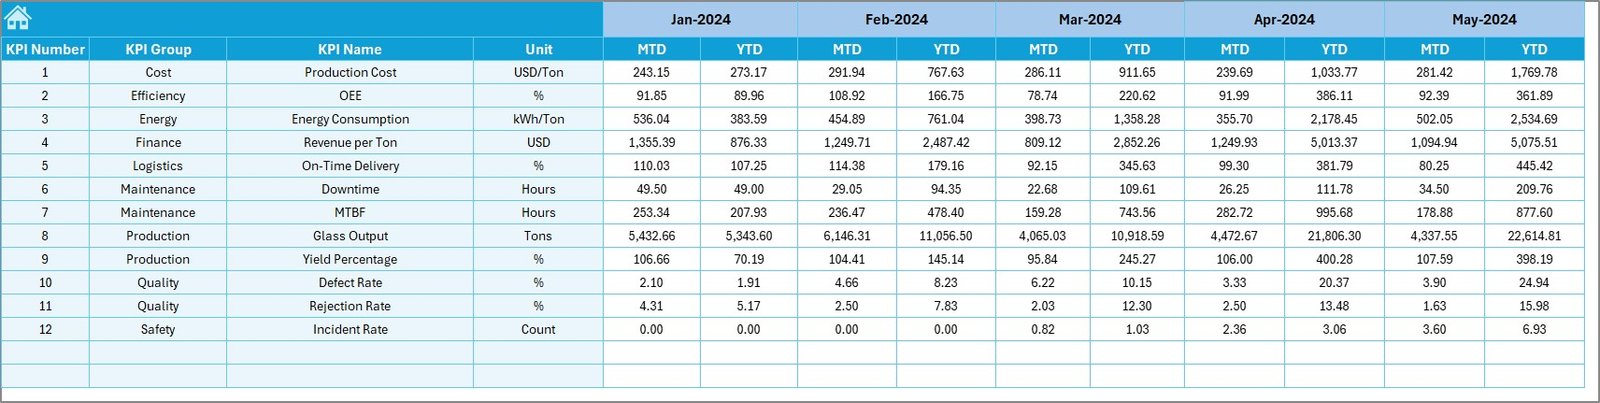
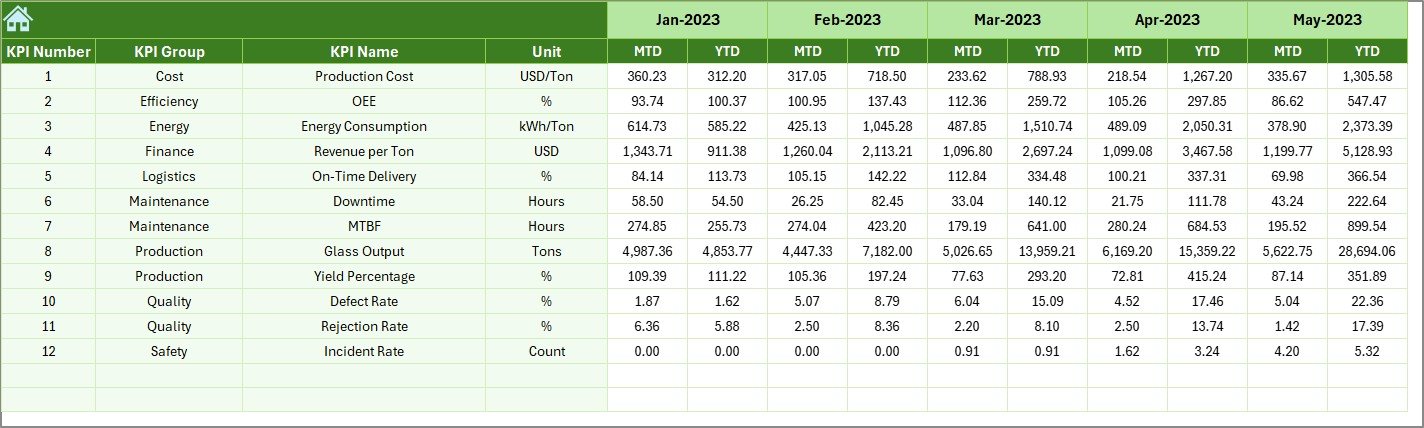
How Do You Enter Actual Production Data in the Dashboard?
Actual Numbers Input Sheet
The Actual Numbers Input Sheet captures real production performance.
How It Works:
- Enter MTD and YTD actual values for each KPI
- Change the first month of the year using Cell E1
- Monthly structure adjusts automatically
Because data entry remains simple and structured, users reduce errors and save time during reporting cycles.
How Does the Target Sheet Support Goal Tracking?
Click to buy Glass Manufacturing KPI Dashboard in Excel
Target Sheet Tab
The Target Sheet stores planned performance values.
Here, you enter:
- Monthly MTD targets
- Monthly YTD targets
- Targets for each KPI
As a result, the dashboard can compare Actual vs Target accurately and highlight deviations in real time.
Click to buy Glass Manufacturing KPI Dashboard in Excel
Why Is the Previous Year Sheet Important?
Previous Year Numbers Sheet Tab
Performance comparisons make sense only when you include historical context.
In this sheet:
- Enter previous year values
- Follow the same structure as the current year
- Enable YOY (Year-over-Year) analysis
Because of PY comparisons, managers can evaluate growth, decline, or consistency.
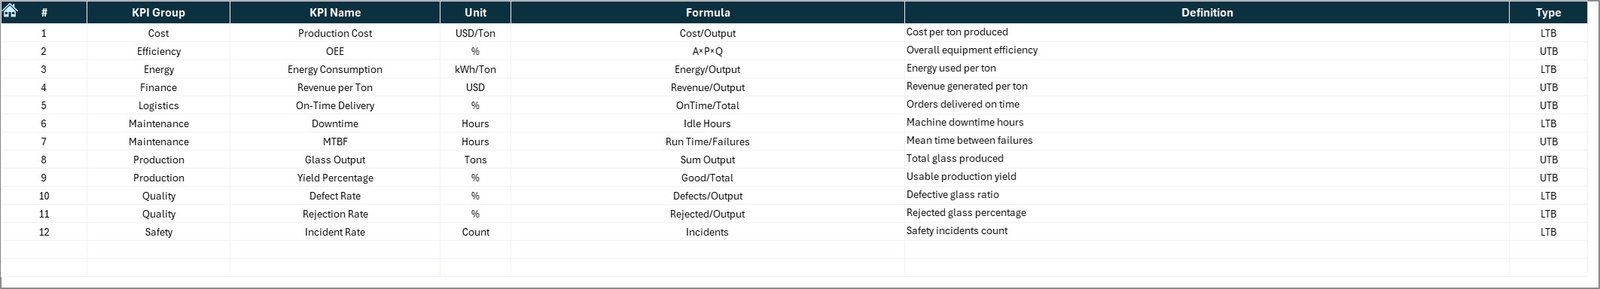
What Is the Purpose of the KPI Definition Sheet?
KPI Definition Sheet Tab
The KPI Definition Sheet serves as the foundation of the entire dashboard.
Here, you define:
- KPI Name
- KPI Group
- Unit
- Formula
- KPI Definition
Because KPI clarity matters, this sheet ensures everyone interprets metrics the same way.
What KPIs Can You Track in a Glass Manufacturing KPI Dashboard?
Although KPI selection depends on specific operations, common glass manufacturing KPIs include:
- Production Yield %
- Scrap Rate %
- Furnace Efficiency
- Energy Consumption per Ton
- Batch Loss %
- Downtime Hours
- On-Time Delivery %
- Rework Rate
- Capacity Utilization %
- Maintenance Cost per Unit
Because Excel handles flexibility well, you can easily customize KPIs.
Advantages of Glass Manufacturing KPI Dashboard in Excel
Using a Glass Manufacturing KPI Dashboard in Excel offers multiple strategic benefits.
Centralized Performance Monitoring
All KPIs appear in one place. Therefore, decision-makers avoid scattered files.
Real-Time Month Selection
Changing the month updates the entire dashboard instantly.
Clear Target vs Actual Visibility
Visual indicators highlight gaps without manual calculations.
Historical Comparison with Previous Year
YOY analysis improves planning accuracy.
No Coding Required
Anyone familiar with Excel can use and maintain the dashboard.
Easy Customization
Organizations can add or modify KPIs without rebuilding the model.
Faster Decision-Making
Visual trends drive quicker operational actions.
How Does This Dashboard Improve Glass Manufacturing Performance?
A Glass Manufacturing KPI Dashboard in Excel improves performance by:
- Reducing waste through early detection
- Improving quality via KPI transparency
- Enhancing energy efficiency
- Supporting proactive maintenance planning
- Enabling accountability across teams
Because data remains visible and actionable, teams stay aligned with goals.
Best Practices for the Glass Manufacturing KPI Dashboard in Excel
Following best practices ensures long-term dashboard success.
Define KPIs Clearly
Always maintain consistent formulas and definitions.
Limit KPI Count
Track only the most impactful KPIs to avoid clutter.
Update Data Regularly
Ensure actuals, targets, and PY data remain current.
Use Standard Time Formats
Align months and years across all sheets.
Validate Input Data
Avoid incorrect manual entries using data validation.
Review Trends Weekly
Don’t wait until month-end to analyze trends.
Align KPIs with Business Goals
Ensure KPIs support productivity, cost, and quality strategies.
Who Should Use a Glass Manufacturing KPI Dashboard in Excel?
This dashboard benefits:
- Plant Managers
- Production Heads
- Quality Managers
- Manufacturing Directors
- Operations Analysts
- Continuous Improvement Teams
Because Excel remains widely used, adoption becomes easy.
Conclusion
A Glass Manufacturing KPI Dashboard in Excel delivers clarity, control, and confidence to production teams. Instead of relying on delayed reports, organizations gain real-time visibility into performance, efficiency, quality, and trends.
Moreover, this dashboard structure—with Summary, Dashboard, Trend, Input, Target, PY, and KPI Definition sheets—ensures scalability and accuracy. When used correctly, it becomes a powerful performance management system rather than just a reporting file.
Ultimately, better data leads to better decisions—and better decisions drive better manufacturing outcomes.
Frequently Asked Questions (FAQs)
What is a Glass Manufacturing KPI Dashboard in Excel?
It is an Excel-based performance monitoring tool that tracks production KPIs using structured sheets and interactive visuals.
Can I customize KPIs in the dashboard?
Yes. You can modify, add, or remove KPIs using the KPI Definition sheet.
Does this dashboard support monthly and yearly analysis?
Yes. It supports both MTD and YTD analysis along with Previous Year comparisons.
Do I need advanced Excel skills to use it?
No. Basic Excel knowledge is sufficient.
Can this dashboard replace Power BI?
While Power BI offers advanced visuals, Excel dashboards work perfectly for quick, flexible, and cost-effective analysis.
How often should I update data?
Ideally, update data daily or weekly for optimal insights.
Is this dashboard suitable for different glass manufacturing processes?
Yes. You can adapt KPIs for float glass, container glass, or specialty glass operations.
Visit our YouTube channel to learn step-by-step video tutorials
Watch the step-by-step video tutorial:
Click to buy Glass Manufacturing KPI Dashboard in Excel