In today’s fast-moving digital workplaces, knowledge sharing and collaboration decide how fast teams learn, adapt, and perform. However, most organizations still struggle to measure how effectively employees share knowledge and collaborate across departments. As a result, leaders lack real visibility into collaboration gaps, content usage, and learning effectiveness.
That is exactly where the Knowledge Sharing & Collaboration KPI Dashboard in Excel becomes extremely valuable.
In this detailed article, you will learn what a Knowledge Sharing & Collaboration KPI Dashboard in Excel is, why your organization needs it, how it works, what sheets it includes, its advantages, best practices, and frequently asked questions. Moreover, the article explains how this ready-to-use Excel dashboard helps teams track performance clearly without complex tools.
Click to buy Knowledge Sharing & Collaboration KPI Dashboard in Excel
What Is a Knowledge Sharing & Collaboration KPI Dashboard in Excel?
A Knowledge Sharing & Collaboration KPI Dashboard in Excel is a ready-to-use analytical template designed to track, measure, and monitor collaboration-related KPIs in one centralized location. It converts raw monthly data into meaningful insights using Excel formulas, conditional formatting, charts, and structured sheets.
Instead of relying on scattered reports or manual reviews, this dashboard provides:
- A single view of all collaboration KPIs
- Monthly and yearly comparisons
- Clearly defined targets and performance gaps
- Trend analysis for better decision-making
Because Excel remains widely used across organizations, this dashboard works perfectly for HR teams, L&D managers, project managers, PMOs, and leadership teams.
Why Do Organizations Need a Knowledge Sharing KPI Dashboard?
Knowledge does not create impact unless teams share and apply it effectively. However, tracking collaboration manually often leads to confusion and delays. Therefore, organizations need a structured KPI system.
A Knowledge Sharing & Collaboration KPI Dashboard in Excel helps because:
- It quantifies collaboration performance
- It tracks progress against defined goals
- It highlights improvement areas quickly
- It supports data-driven learning strategies
- It saves time compared to manual reporting
Moreover, it enables leadership to align collaboration initiatives with business goals instead of relying on assumptions.
What KPIs Can You Track in This Dashboard?
This dashboard supports a wide range of collaboration and knowledge-sharing KPIs, such as:
- Knowledge Contribution Rate
- Content Usage Frequency
- Collaboration Participation %
- Training Completion Rate
- Cross-Team Collaboration Index
- Knowledge Reuse Ratio
- Employee Engagement Score
- Learning Effectiveness %
Because the dashboard includes a KPI Definition sheet, you can customize KPIs based on your organization’s needs.
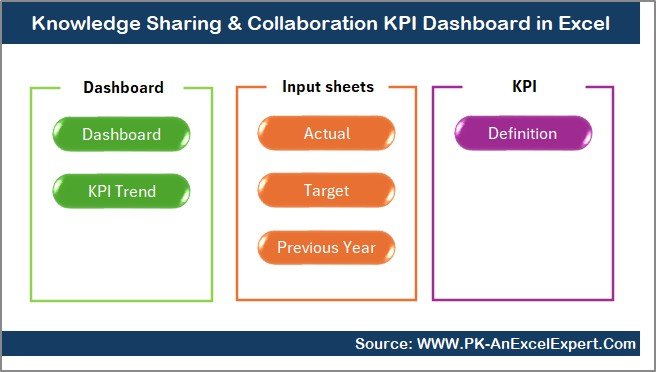
Key Features of the Knowledge Sharing & Collaboration KPI Dashboard in Excel
This dashboard comes with a structured 7-worksheet design, which ensures clarity, accuracy, and ease of use.
Let’s walk through each worksheet in detail.
Summary Page – Quick Navigation Hub
The Summary Page acts as an index sheet and navigation hub.
What does the Summary Page include?
- Six clickable buttons
- Easy jump to each major worksheet
- Clean and user-friendly layout
Because of this structure, users can move across the dashboard instantly without searching through Excel tabs. Consequently, this page saves time and improves usability.
Click to buy Knowledge Sharing & Collaboration KPI Dashboard in Excel
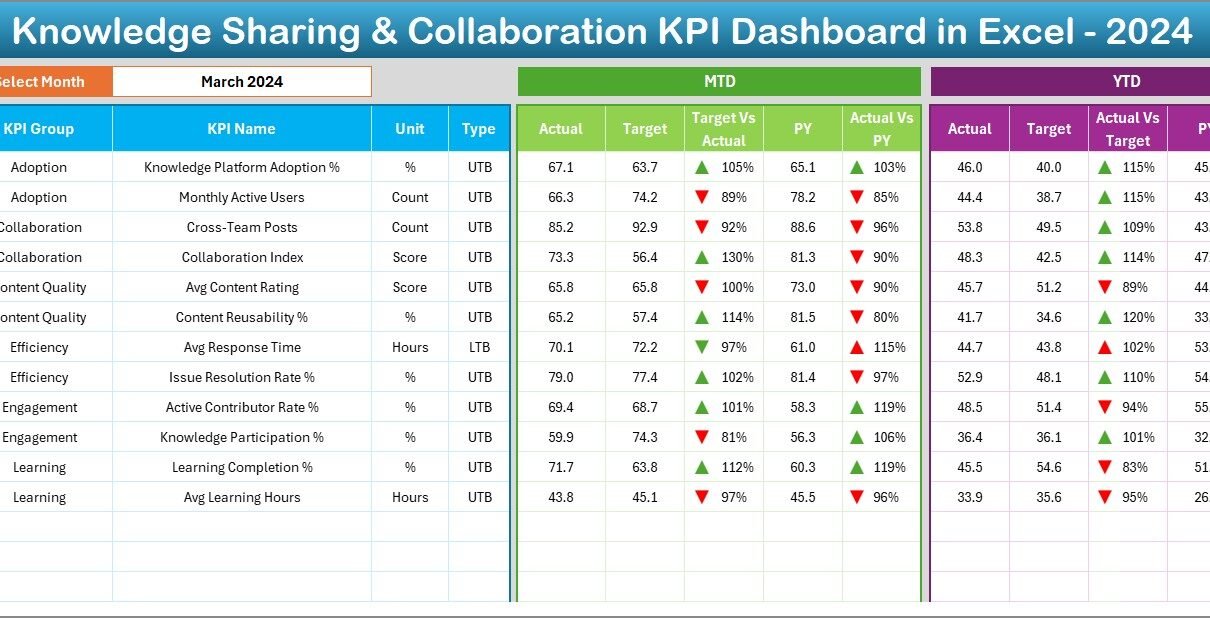
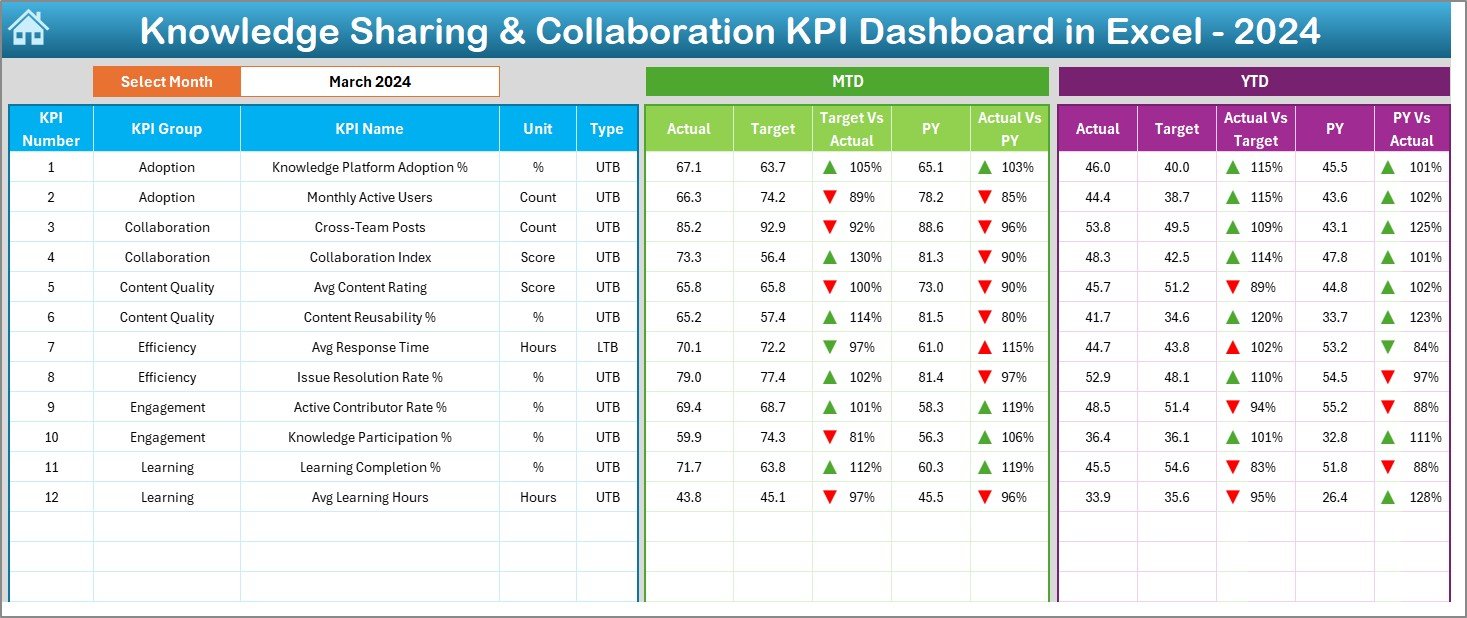
Dashboard Sheet – Central KPI Performance View
The Dashboard Sheet is the main analytical page of the entire Excel file.
How does the Dashboard Sheet work?
On cell D3, you can select the required month from a dropdown. As soon as you select the month, the entire dashboard updates automatically.
KPIs displayed in this sheet:
- MTD Actual vs Target
- MTD Actual vs Previous Year
- YTD Actual vs Target
- YTD Actual vs Previous Year
Visual performance indicators:
- Up arrow for performance improvement
- Down arrow for performance decline
- Conditional formatting for quick insights
As a result, managers can instantly identify whether collaboration KPIs meet expectations or require action.
Click to buy Knowledge Sharing & Collaboration KPI Dashboard in Excel
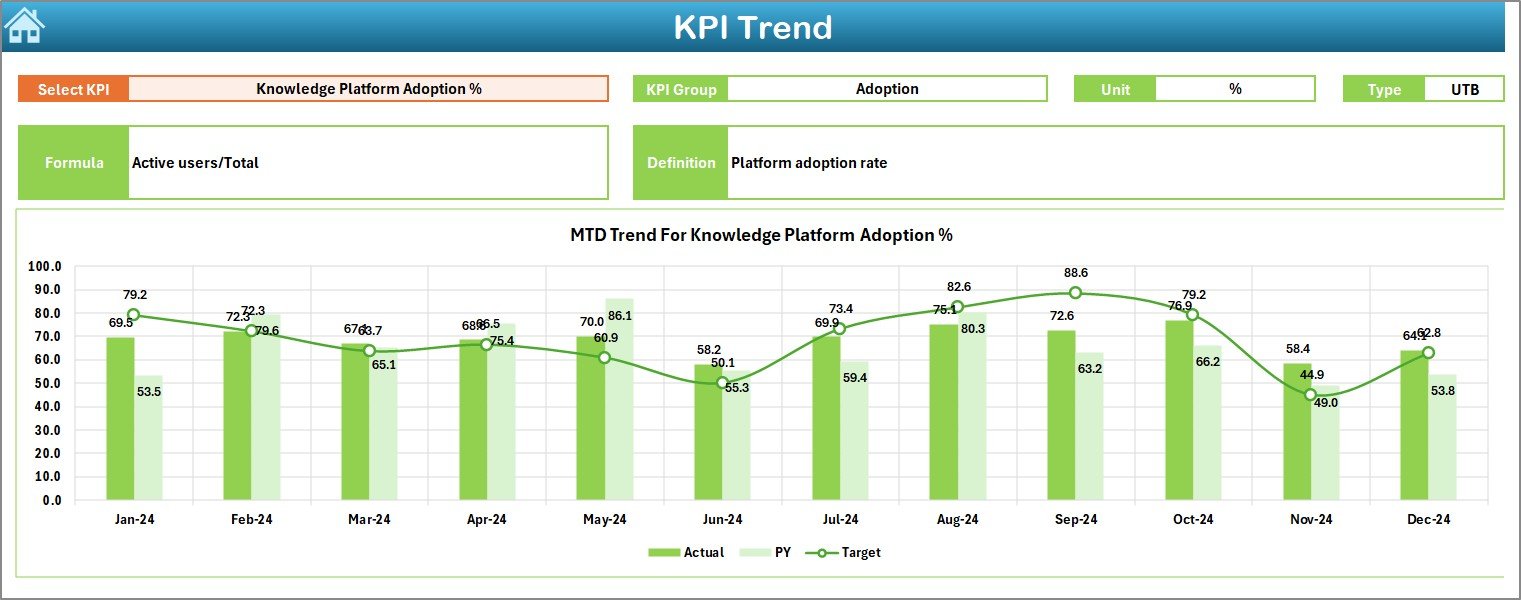
Trend Sheet – KPI-Wise Performance Analysis
The Trend Sheet provides deep analysis for individual KPIs.
What can you analyze in the Trend Sheet?
- Select KPI Name from dropdown (Cell C3)
- View KPI Group and Unit
- Understand KPI Type (LTB or UTB)
- Read KPI Formula and Definition
- Track MTD trends over months
- Track YTD trends for Actual, Target, and PY
Because this sheet shows trends visually, it helps teams understand performance direction rather than static numbers.
Click to buy Knowledge Sharing & Collaboration KPI Dashboard in Excel
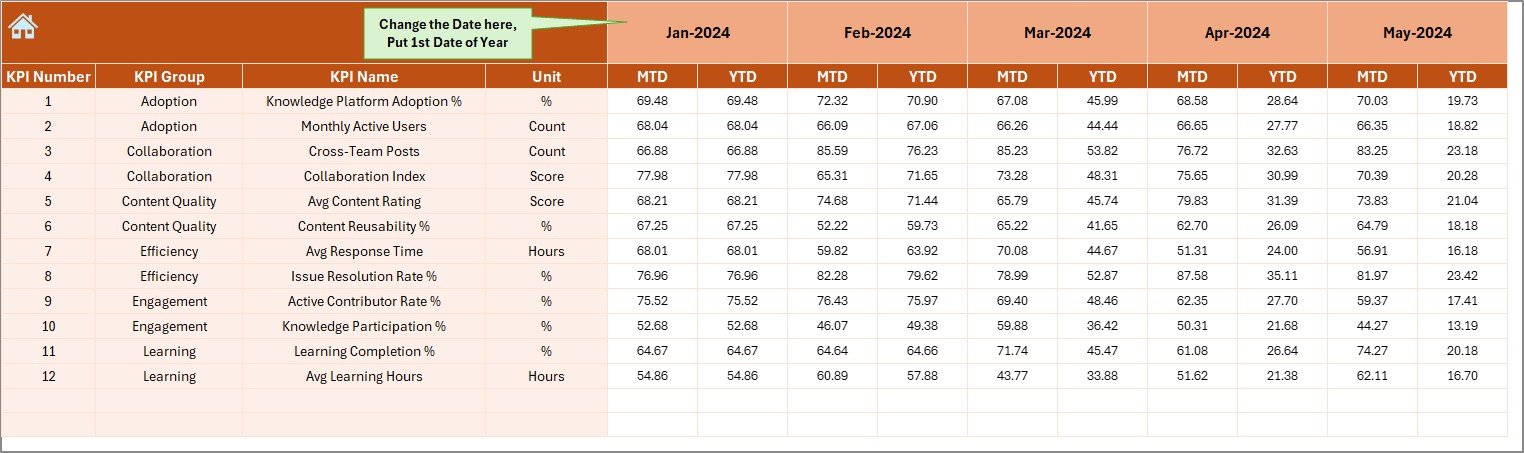
Actual Numbers Input Sheet – Monthly Data Entry
The Actual Numbers Input Sheet allows users to enter performance data easily.
How does data entry work?
- Select the start month in cell E1
- Enter MTD and YTD actual values
- Update data month-wise
- Automatic flow of data into charts and dashboard
Since this sheet controls actual performance values, accuracy here ensures reliable analytics.
Click to buy Knowledge Sharing & Collaboration KPI Dashboard in Excel
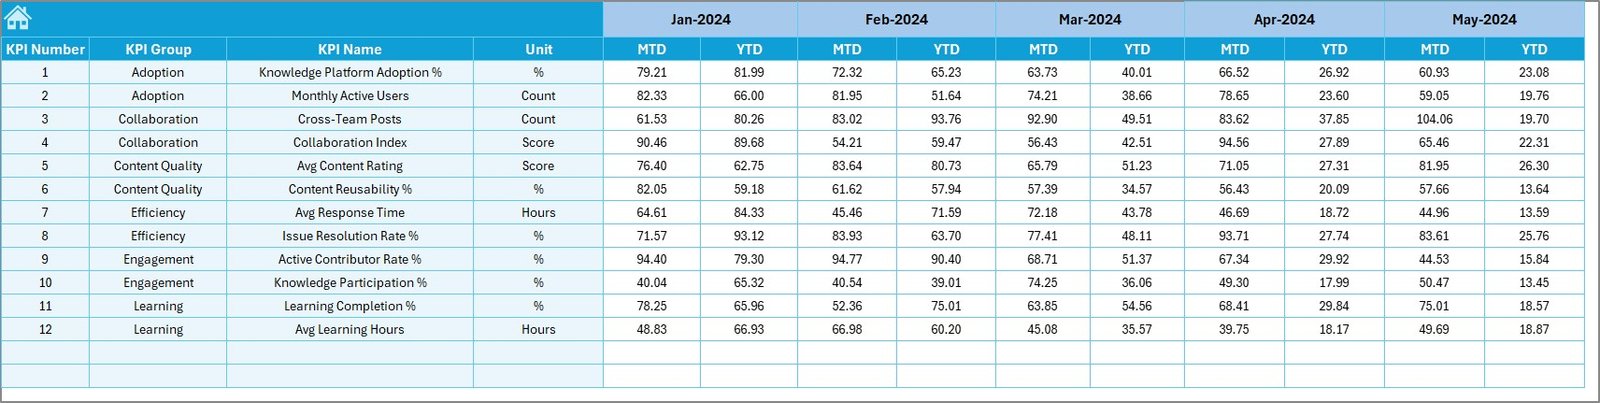
Target Sheet – Goal Setting and Measurement
The Target Sheet stores planned targets for each KPI.
What data do you enter here?
- KPI-wise MTD targets
- KPI-wise YTD targets
- Monthly performance expectations
By defining clear targets, organizations can evaluate collaboration goals objectively instead of guessing success.
Click to buy Knowledge Sharing & Collaboration KPI Dashboard in Excel
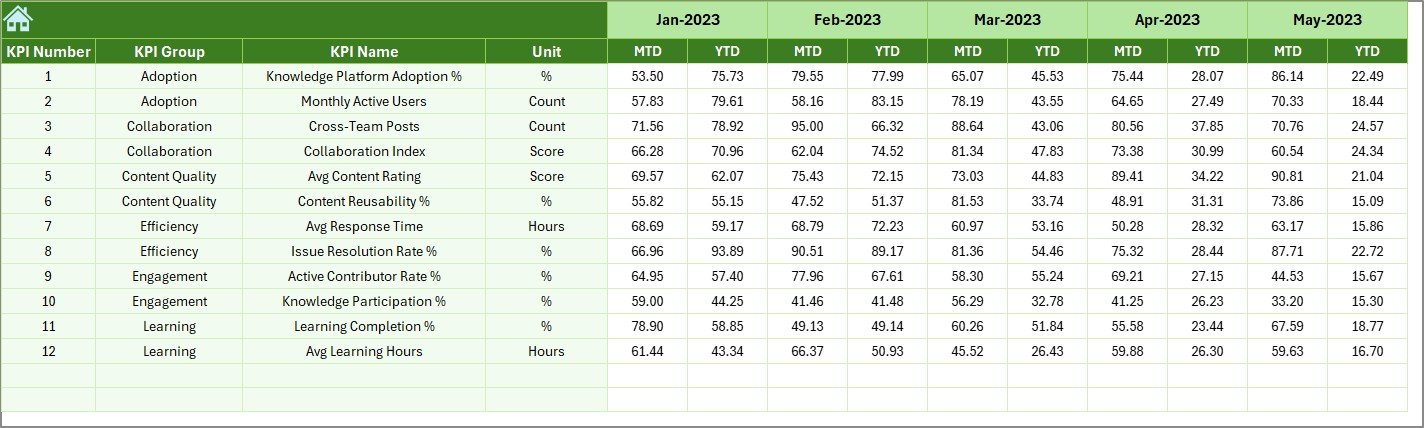
Previous Year Number Sheet – Benchmarking Analysis
The Previous Year Numbers Sheet captures historical data for comparison.
Why does this matter?
- Enables year-over-year performance comparison
- Highlights long-term improvement trends
- Identifies recurring collaboration issues
Because the dashboard calculates automatic comparisons, leaders gain accurate benchmarking insights easily.
Click to buy Knowledge Sharing & Collaboration KPI Dashboard in Excel
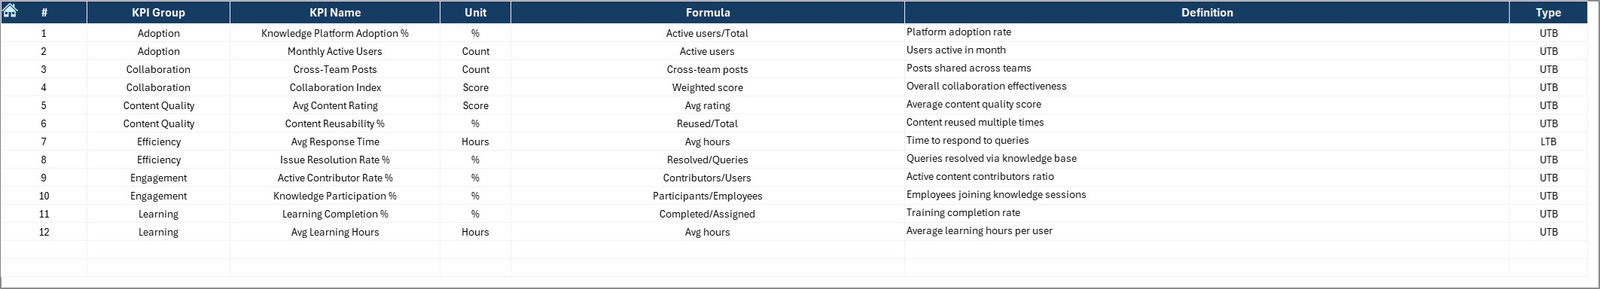
KPI Definition Sheet – Central KPI Reference
The KPI Definition Sheet acts as the backbone of the dashboard.
This sheet includes:
- KPI Name
- KPI Group
- Unit of Measurement
- KPI Formula
- KPI Definition
- KPI Type (LTB or UTB)
Click to buy Knowledge Sharing & Collaboration KPI Dashboard in Excel
As a result, everyone understands how KPIs work, which avoids confusion and misinterpretation.
Advantages of Knowledge Sharing & Collaboration KPI Dashboard in Excel
Using this dashboard offers multiple advantages across teams and leadership.
Clear Performance Visibility
The dashboard shows performance clearly through numbers and charts. Therefore, managers do not waste time interpreting complex spreadsheets.
Better Decision-Making
Since the dashboard highlights trends and gaps, leaders can take timely action to improve collaboration practices.
Easy Customization
Because it works in Excel, teams can easily adjust KPIs, targets, and formats without technical knowledge.
Time-Saving Reporting
The dashboard eliminates repetitive monthly reporting and speeds up analysis significantly.
Improved Accountability
When teams track KPIs regularly, ownership and accountability increase naturally.
Who Should Use This Dashboard?
This dashboard works perfectly for:
- HR and People Analytics teams
- Learning & Development managers
- Knowledge management teams
- Project and program managers
- Corporate strategy teams
- SMEs and large enterprises
Even small organizations can use this Excel-based dashboard without additional software investment.
Best Practices for the Knowledge Sharing & Collaboration KPI Dashboard
To get maximum value, follow these best practices.
Define KPIs Clearly
Always ensure that each KPI has a clear formula and definition in the KPI Definition Sheet.
Update Data Monthly
Enter actual and target data consistently every month for accurate trend analysis.
Use Meaningful Targets
Set realistic and measurable targets that align with business goals.
Review Trends, Not Just Numbers
Focus on trend charts instead of only current performance values.
Train Users
Brief users on how to enter data and interpret visuals to avoid errors.
How Does This Dashboard Improve Collaboration Culture?
When teams track collaboration KPIs regularly, several cultural benefits emerge:
- Transparent performance tracking
- Data-driven feedback discussions
- Improved participation in knowledge sharing
- Higher engagement in learning initiatives
- Continuous improvement mindset
Therefore, the dashboard acts not only as a reporting tool but also as a cultural enabler.
Why Choose Excel for Knowledge Sharing KPIs?
Although many advanced tools exist, Excel remains powerful because:
- Almost everyone knows Excel
- No additional software cost
- High flexibility
- Easy sharing and collaboration
- Strong formula and chart capabilities
Hence, Excel dashboards remain practical and effective for collaboration analytics.
Conclusion
The Knowledge Sharing & Collaboration KPI Dashboard in Excel provides a structured, easy-to-use, and powerful way to track collaboration performance across an organization. By combining clear KPI definitions, monthly data input, performance comparisons, and trend analysis, this dashboard helps teams move from assumption-based decisions to data-driven actions.
If your organization values learning, collaboration, and continuous improvement, then this Excel KPI dashboard becomes an essential management tool.
Frequently Asked Questions (FAQs)
- What is the main purpose of a Knowledge Sharing KPI Dashboard?
The main purpose is to track and measure how effectively employees share knowledge and collaborate using defined KPIs.
- Can I customize KPIs in this Excel dashboard?
Yes, you can fully customize KPIs, formulas, targets, and definitions using the KPI Definition Sheet.
- Does this dashboard support monthly and yearly analysis?
Yes, it supports MTD, YTD, and previous year comparisons automatically.
- Do I need advanced Excel skills to use this dashboard?
No, basic Excel knowledge is sufficient to use and update the dashboard.
- Can small teams use this dashboard?
Yes, both small teams and large organizations can use it easily.
- How often should data be updated?
Ideally, update data monthly to maintain accurate insights and trends.
- Can this dashboard support multiple KPI groups?
Yes, the dashboard supports multiple KPI groups and categories effortlessly.
Visit our YouTube channel to learn step-by-step video tutorials
Watch the step-by-step video tutorial:
Click to buy Knowledge Sharing & Collaboration KPI Dashboard in Excel