Effective tracking and analysis of pharmaceutical sales, profit margins, inventory, and other key performance indicators (KPIs) is essential for any business operating in the healthcare industry. The Pharmaceutical Dashboard in Power BI is a powerful, ready-to-use tool designed to help pharmaceutical companies gain valuable insights into their sales performance, inventory levels, and overall financial health.
In this article, we will explore the key features of the Pharmaceutical Dashboard in Power BI, explaining how each element of the dashboard can help improve decision-making, optimize processes, and drive profitability in the pharmaceutical industry.
What is the Pharmaceutical Dashboard in Power BI?
The Pharmaceutical Dashboard in Power BI is a comprehensive tool designed for tracking and analyzing various KPIs related to pharmaceutical sales, profit, and inventory management. It provides clear visuals of important metrics such as revenue, profit, units sold, stock status, and expiration risks. The dashboard allows businesses to monitor performance across different regions, sales channels, and categories.
The dashboard consists of three main sheets, each designed to provide a different level of insight:
Key Features of the Pharmaceutical Dashboard
1) Dashboard Sheet Tab: Overview of Key Metrics
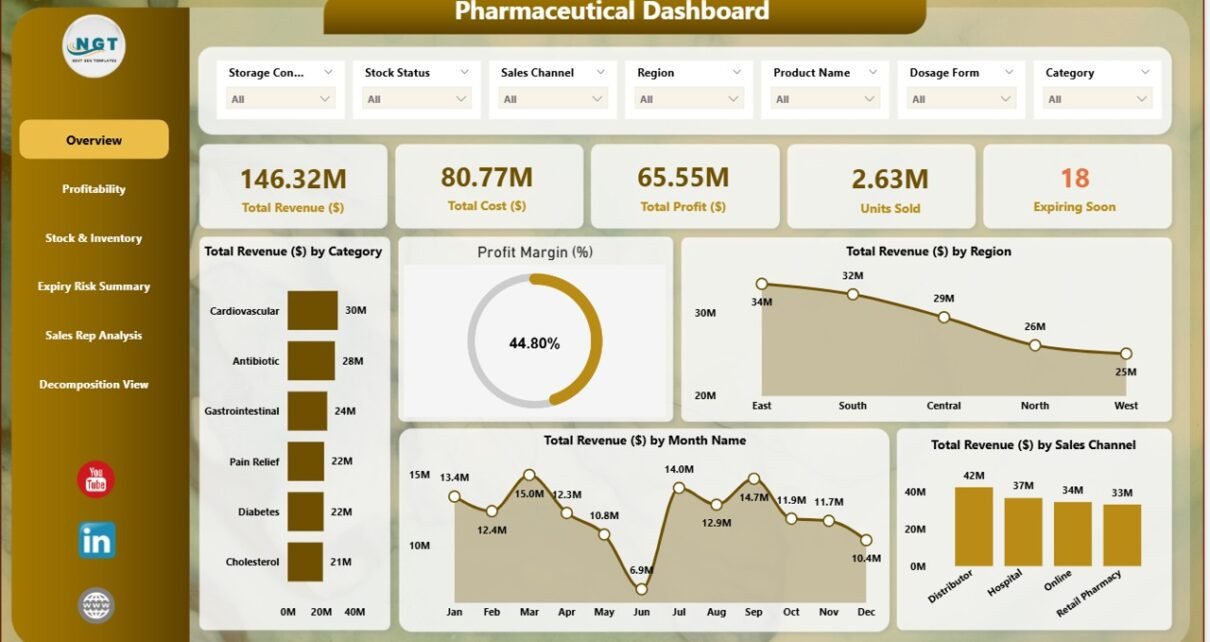
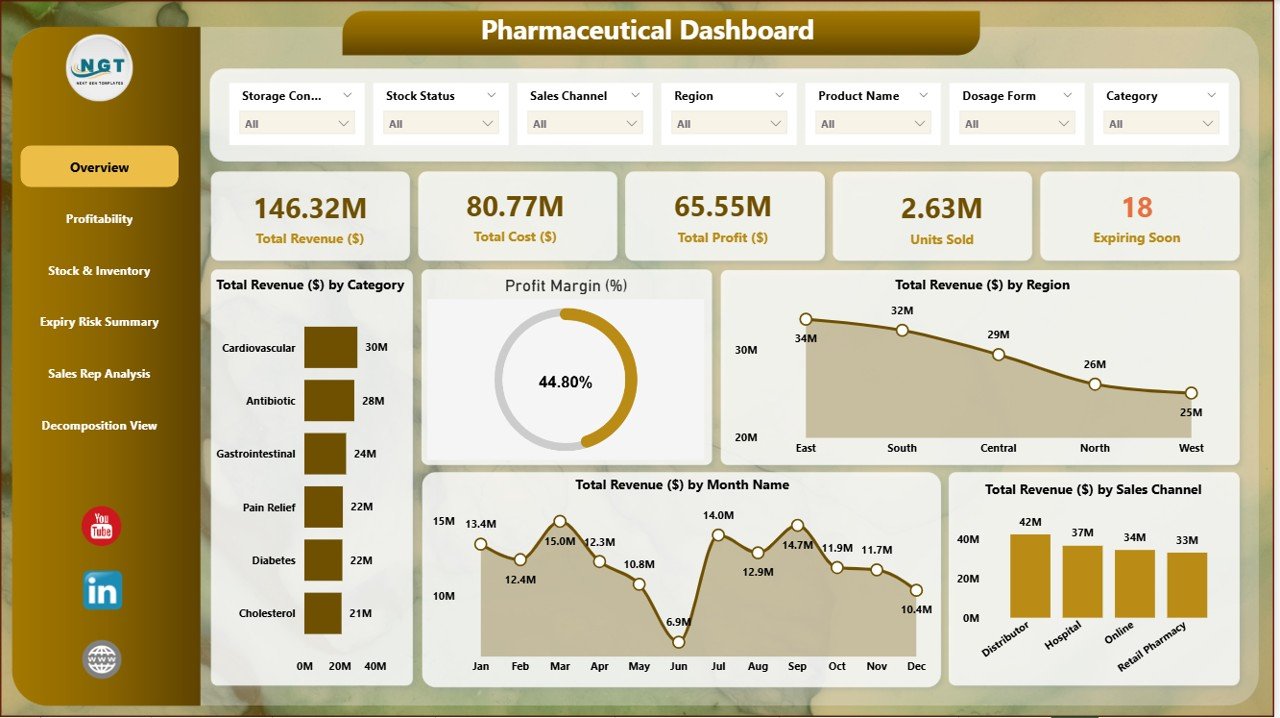
The Dashboard Sheet Tab is the central hub where you can view high-level performance indicators at a glance. The sheet includes the following elements:
Cards:
- Total Revenue ($): Displays the total revenue generated by the pharmaceutical company.
- Total Profit ($): Shows the total profit from pharmaceutical sales after costs are deducted.
- Units Sold: Tracks the total number of units sold during the selected period.
- Total Cost ($): Displays the total cost incurred for the products sold.
- Profit Margin (%): Calculates the profit margin by dividing profit by revenue.
These cards provide a quick snapshot of the company’s financial performance, making it easier to assess the overall health of the business.
Click to buy Pharmaceutical Dashboard in Power BI
2) Overview Page: Detailed Analysis of Revenue and Profit
The Overview Page offers detailed insights into various aspects of pharmaceutical sales performance. Key charts include:
-
Total Revenue ($) by Category: Breaks down the total revenue by product category (e.g., pain relief, antibiotics, vaccines).
-
Profit Margin (%): Displays the profit margin for each product category, providing insight into profitability.
-
Total Revenue ($) by Region: Shows revenue distribution across different geographical regions (e.g., North, South, East, West).
-
Total Revenue ($) by Month Name: Displays revenue trends by month, allowing you to track seasonal performance and identify periods of high or low sales.
-
Total Revenue ($) by Sales Channel: Breaks down revenue by sales channels (e.g., retail pharmacy, distributor, hospital).
These charts give an in-depth analysis of revenue and profitability across different categories, regions, months, and sales channels, helping managers and decision-makers understand performance drivers.
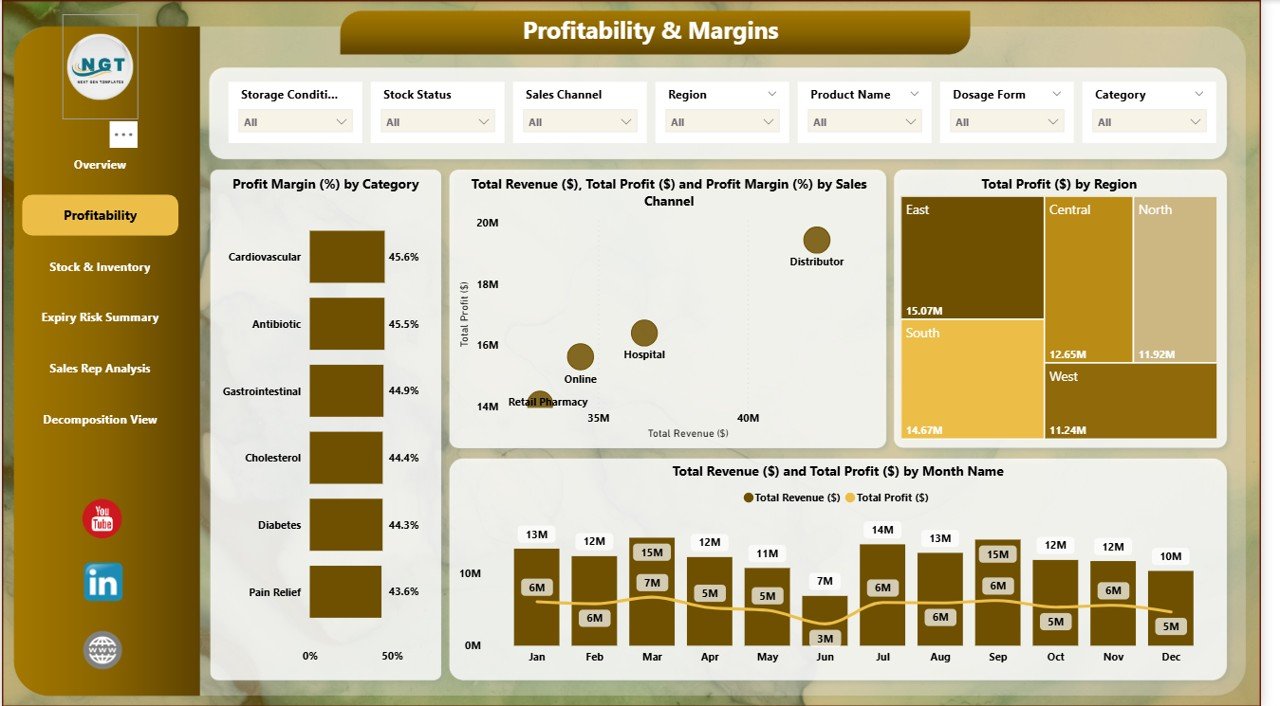
3) Profitability & Margins: Detailed Profit and Margin Analysis
The Profitability & Margins section focuses on analyzing profit margins and revenue performance in greater detail. Key charts include:
-
Profit Margin (%) by Category: Displays the profit margin for each product category.
-
Total Revenue ($), Total Profit ($), and Profit Margin (%) by Sales Channel: This chart compares total revenue, profit, and profit margin across different sales channels.
-
Total Profit ($) by Region: Breaks down total profit by region, helping you understand where profits are being maximized or minimized.
-
Total Revenue ($) and Total Profit ($) by Month Name: Analyzes total revenue and profit trends over time, helping you identify seasonal patterns.
This section allows you to track profitability and margins across various dimensions, providing valuable insights into how your business can improve profitability.
Click to buy Pharmaceutical Dashboard in Power BI
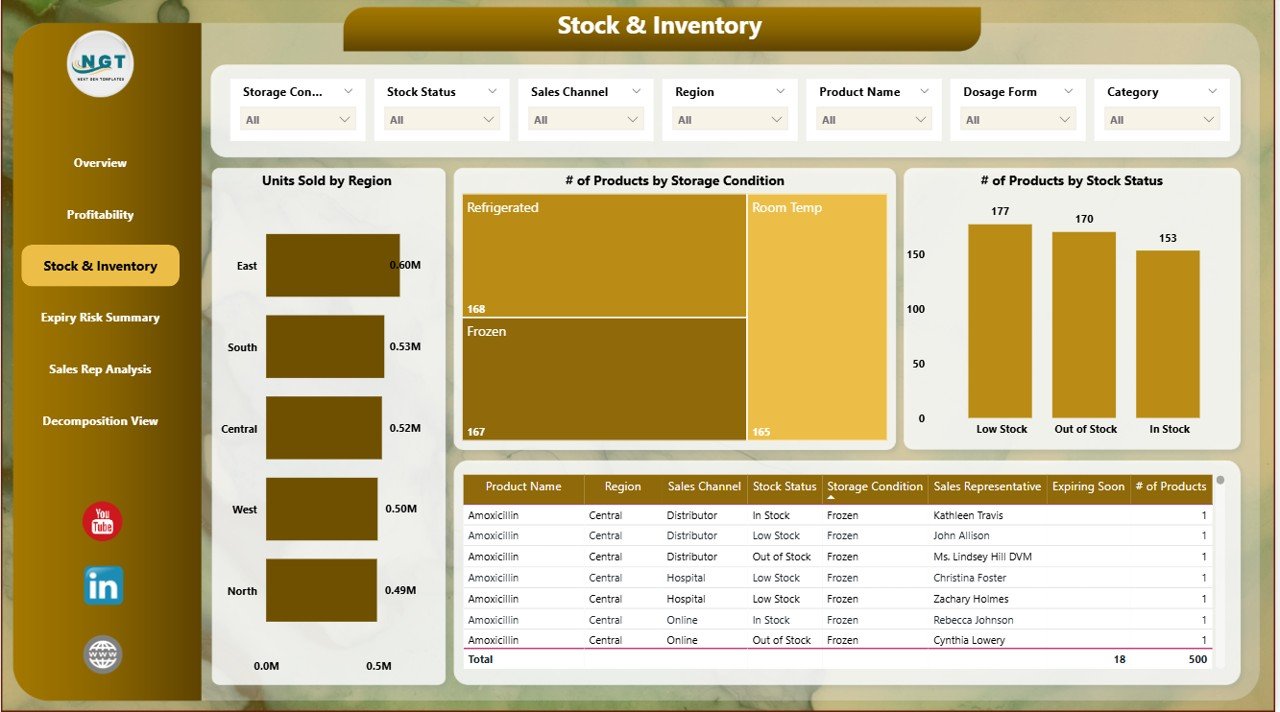
4) Stock & Inventory Page: Managing Inventory and Expiry Risks
The Stock & Inventory Page is dedicated to tracking pharmaceutical inventory and identifying potential expiry risks. Key charts include:
-
Units Sold by Region: Tracks the number of units sold in different regions.
-
# of Products by Storage Condition: Shows the distribution of products based on their storage conditions (e.g., refrigerated, frozen, room temperature).
-
# of Products by Stock Status: Displays the number of products categorized by their stock status (e.g., in stock, out of stock, low stock).
-
Expiring Soon by Region: Shows products that are nearing expiration, broken down by region.
-
Expiring Soon by Storage Condition: Displays products approaching their expiration date, categorized by storage condition.
-
Expiring Soon by Sales Channel: Provides insights into expiring products by different sales channels.
-
Expiring Soon by Category: Breaks down expiring products by product category.
This section helps you monitor inventory health, ensuring that products are sold or distributed before they expire, reducing waste and improving inventory turnover.
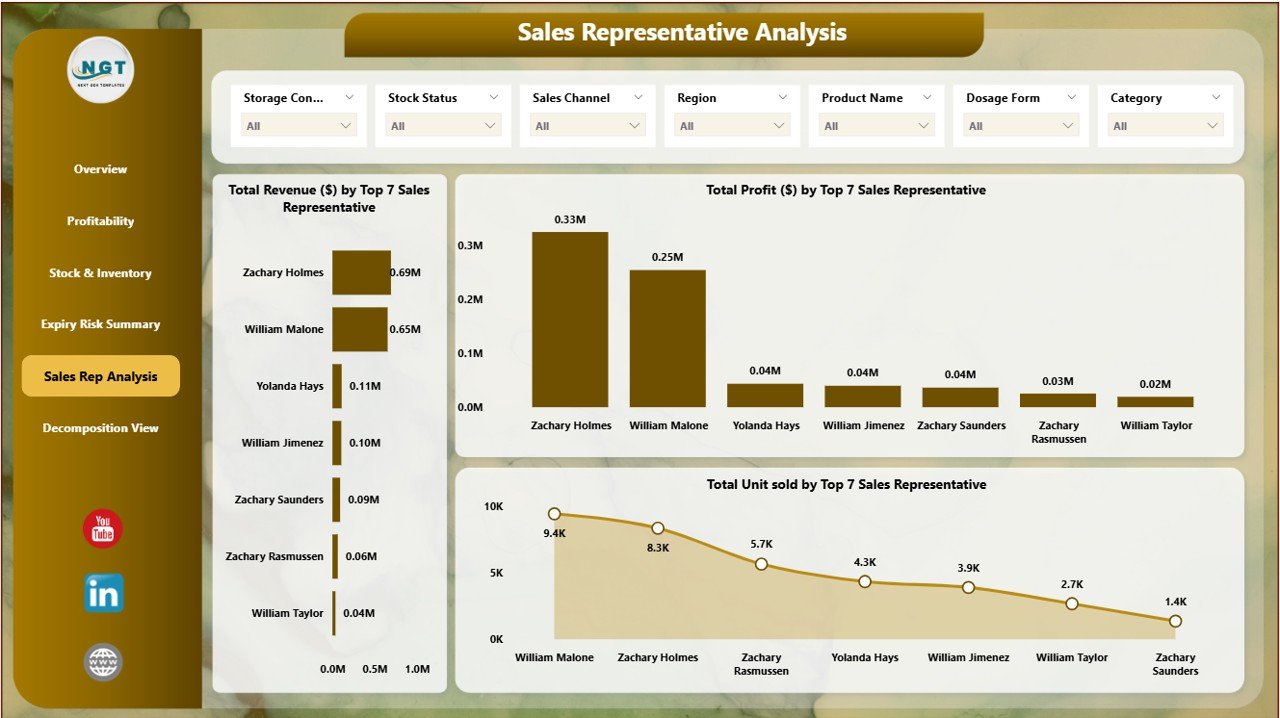
5) Sales Rep Analysis: Performance by Sales Representative
The Sales Rep Analysis page allows you to evaluate the performance of individual sales representatives. Key charts include:
-
Total Profit ($) by Top 7 Sales Representative: Displays the total profit generated by the top 7 sales representatives.
-
Total Revenue ($) by Top 7 Sales Representative: Tracks revenue generated by top-performing sales reps.
-
Total Units Sold by Top 7 Sales Representative: Shows the number of units sold by the top 7 sales reps.
This page helps you identify high-performing sales representatives and offers insights into their contributions to overall sales performance.
Click to buy Pharmaceutical Dashboard in Power BI
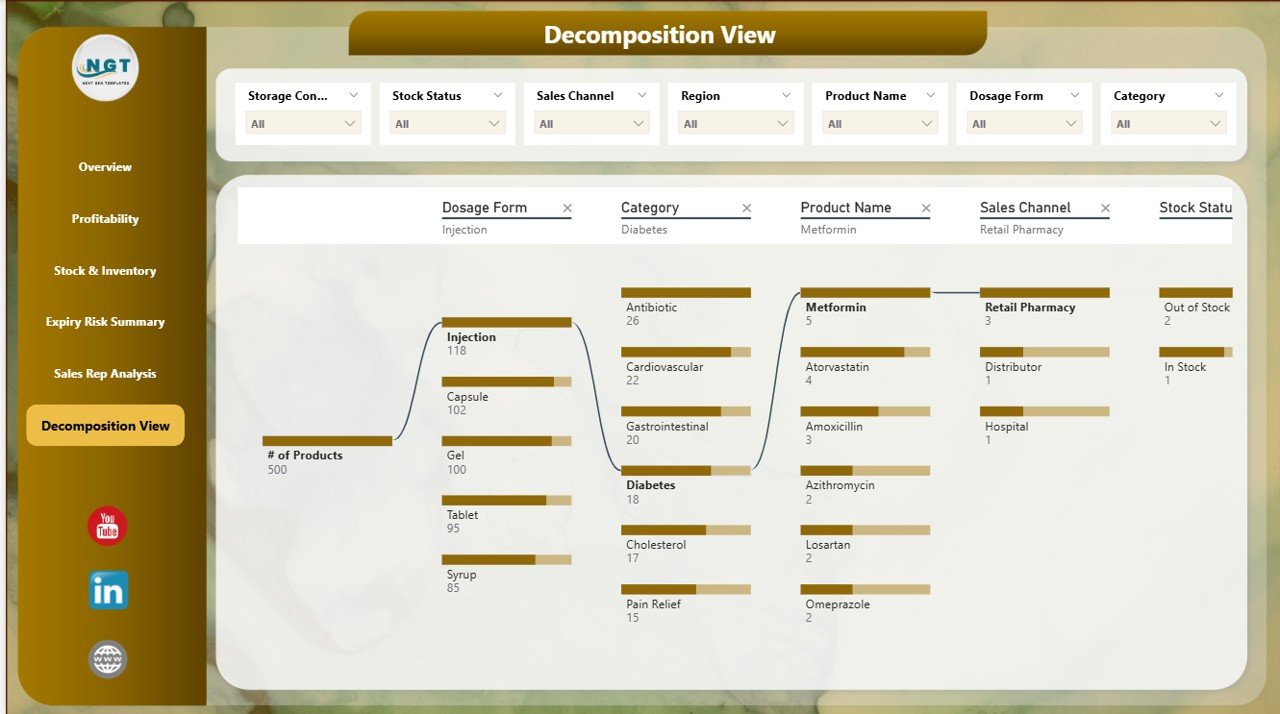
6) Decomposition View: Detailed Breakdown of Sales Performance
The Decomposition View provides a detailed breakdown of various KPIs, helping you analyze the data further. The decomposition view is an interactive feature in Power BI that breaks down complex metrics into smaller, more digestible components, allowing you to identify specific areas of performance.
Benefits of Using the Pharmaceutical Dashboard in Power BI
The Pharmaceutical Dashboard in Power BI offers several advantages that can help businesses optimize their operations:
-
Comprehensive Data Tracking: The dashboard consolidates sales, profit, inventory, and performance data into a single view, making it easier to track and manage key metrics.
-
Visual Insights: The interactive charts and cards provide clear visual insights, allowing you to quickly assess performance and identify trends.
-
Real-Time Monitoring: The dashboard is connected to live data, ensuring real-time updates on sales, profit, and inventory metrics.
-
Improved Decision Making: With in-depth analysis of sales, profitability, and inventory, the dashboard provides actionable insights that can drive business decisions.
-
Customizable: The template is fully customizable, allowing businesses to adjust the dashboard to their specific needs by adding new metrics or modifying existing charts.
Best Practices for Using the Pharmaceutical Dashboard
Click to buy Pharmaceutical Dashboard in Power BI
To maximize the effectiveness of the Pharmaceutical Dashboard in Power BI, follow these best practices:
-
Regularly Update Data: Ensure that the dashboard is updated with the latest sales, profit, and inventory data to get accurate, real-time insights.
-
Monitor Key Metrics: Focus on the most important KPIs such as total revenue, total profit, and units sold to assess business performance.
-
Analyze Inventory Data: Use the Stock & Inventory section to monitor product expiration dates and ensure efficient inventory management.
-
Track Sales Performance: Use the Sales Rep Analysis page to evaluate the performance of individual sales representatives and identify areas for improvement.
-
Leverage Decomposition View: Use the Decomposition View to break down complex metrics and analyze data at a more granular level.
Conclusion
The Pharmaceutical Dashboard in Power BI is an essential tool for businesses in the pharmaceutical industry. By providing real-time insights into key metrics such as revenue, profit, units sold, and inventory status, this dashboard helps businesses optimize their sales, inventory management, and overall performance. With its customizable features and interactive charts, this dashboard empowers decision-makers to make data-driven decisions and improve business outcomes.
Frequently Asked Questions (FAQs)
1. How often should I update the Pharmaceutical Dashboard?
It is recommended to update the dashboard regularly, ideally on a monthly basis or after each significant sales event, to ensure that you have the latest data for decision-making.
2. Can I add additional metrics to the dashboard?
Yes, the dashboard is fully customizable. You can add new metrics, adjust existing ones, or modify the layout to fit your business needs.
3. Can I track performance by region and sales channel?
Yes, the Overview Page and Stock & Inventory Page provide detailed analysis of sales by region and sales channel, helping you identify high-performing regions and channels.
4. How does the Decomposition View work?
The Decomposition View breaks down complex metrics into smaller components, allowing you to drill down into the data and analyze performance at a more granular level.
5. Can I share the Pharmaceutical Dashboard with my team?
Yes, since the dashboard is built in Power BI, you can share it with team members for real-time collaboration and data analysis.
Visit our YouTube channel to learn step-by-step video tutorials
Watch the step-by-step video Demo:
Click to buy Pharmaceutical Dashboard in Power BI