In today’s fast-evolving pharmaceutical industry, accurate performance tracking is essential. Every department — from manufacturing and quality assurance to sales and compliance — plays a vital role in the overall success of a pharmaceutical company. However, managing all these data points manually can become confusing and time-consuming.
That’s where a Pharmaceuticals KPI Dashboard in Excel comes in.
This dynamic and user-friendly tool brings together all your key performance indicators (KPIs) in one interactive dashboard. It helps you track performance trends, compare actual results with targets, and make informed decisions quickly and effectively.
Click to buy Pharmaceuticals KPI Dashboard in Excel
What Is a Pharmaceuticals KPI Dashboard in Excel?
A Pharmaceuticals KPI Dashboard in Excel is a data visualization and performance monitoring tool designed to evaluate business performance across multiple dimensions — such as production efficiency, product quality, compliance adherence, R&D productivity, and sales growth.
This Excel-based dashboard uses automation, formulas, and visual indicators to show both Month-to-Date (MTD) and Year-to-Date (YTD) performance.
It enables business leaders and managers to view trends, analyze gaps, and identify areas that require improvement.
In short, this dashboard converts raw pharmaceutical data into actionable insights — all within the simplicity of Microsoft Excel.
Why the Pharmaceutical Industry Needs KPI Dashboards
The pharmaceutical sector is data-intensive.
Organizations must constantly monitor metrics like production yield, on-time delivery, quality compliance, and cost per batch. Without a structured tracking mechanism, it’s easy to lose sight of performance objectives.
Using a KPI Dashboard in Excel ensures that:
- Teams stay aligned with company goals.
- Managers can easily measure progress against targets.
- Executives can make quick and data-driven decisions.
- Every department has a transparent view of performance.
This eliminates manual tracking errors, improves data consistency, and boosts overall efficiency.
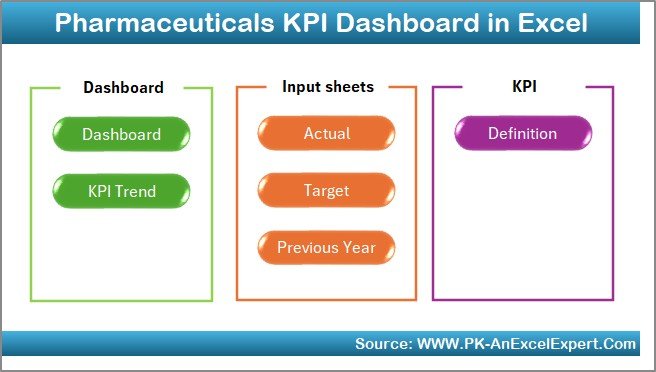
Structure of the Pharmaceuticals KPI Dashboard in Excel
This ready-to-use dashboard template contains seven worksheet tabs, each serving a unique purpose. Together, they form a complete performance management system that can be customized for any pharmaceutical business.
Let’s look at each sheet in detail.
Home Sheet
The Home sheet works as an index or navigation page.
Here, six interactive buttons allow you to jump directly to different sections of the dashboard — such as Dashboard, KPI Trend, Target, Actual, and Definition sheets.
This setup provides quick access and makes navigation seamless, even for non-technical users. You don’t have to scroll through multiple sheets manually — simply click a button and move to the required page instantly.
Click to buy Pharmaceuticals KPI Dashboard in Excel
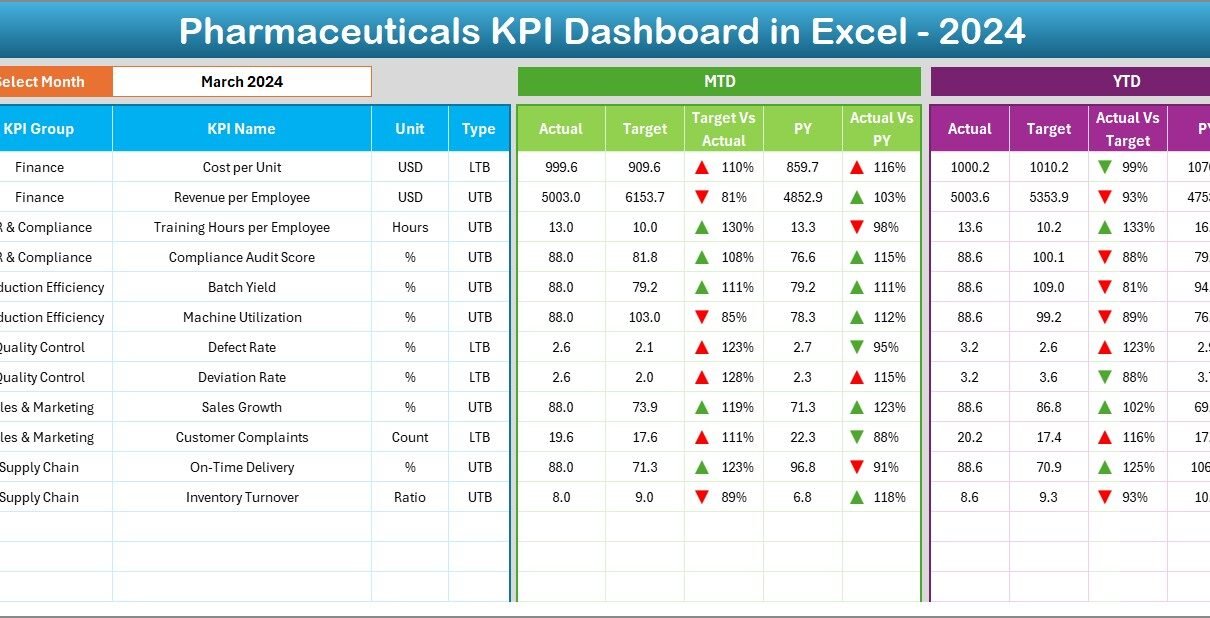
Dashboard Sheet
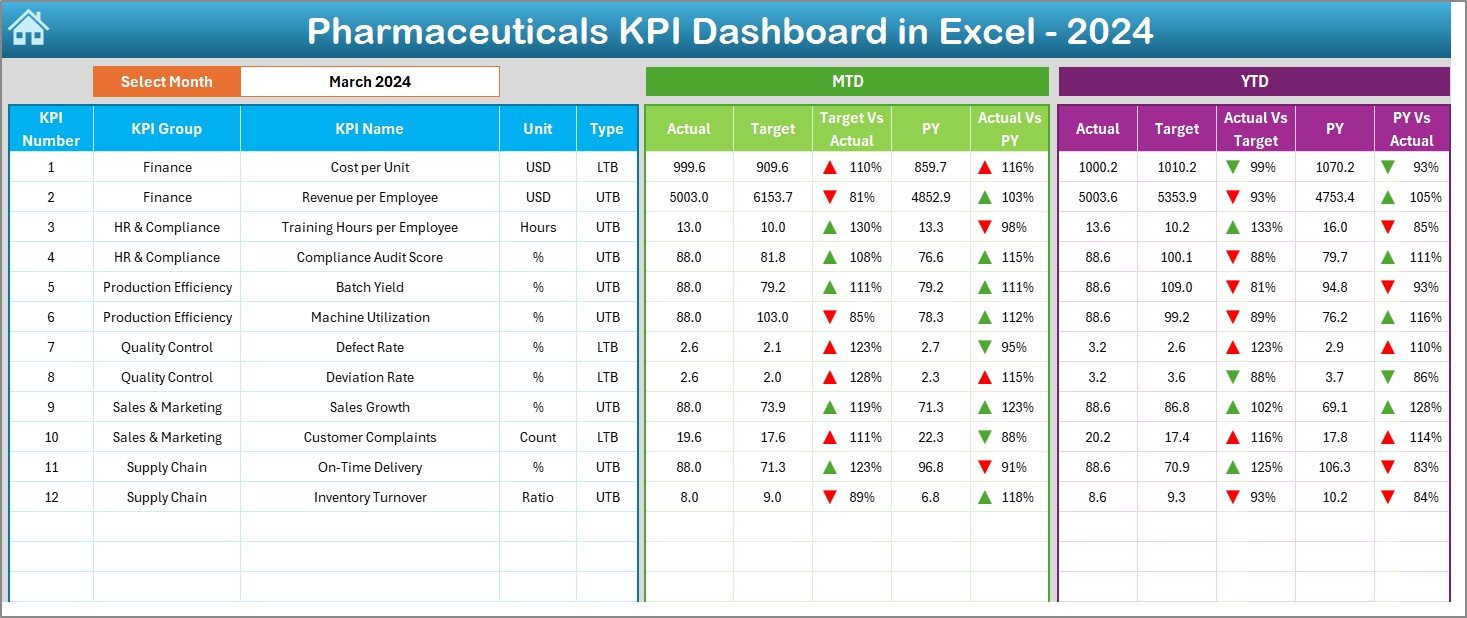
The Dashboard sheet is the heart of this Excel file.
It provides a complete visual overview of all your KPIs, showing key insights for every month.
- On cell D3, you can select the desired month from a drop-down list.
- Once selected, the entire dashboard automatically refreshes to display that month’s data.
- You can view MTD (Month-to-Date) and YTD (Year-to-Date) data for Actual, Target, and Previous Year values.
- The dashboard also calculates Target vs. Actual and Previous Year vs. Actual comparisons.
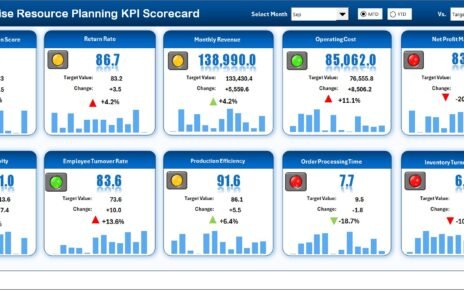
- Conditional formatting arrows (up or down) make performance visualization quick and intuitive.
For example, a green upward arrow may indicate improved performance, while a red downward arrow shows a decline compared to the previous period.
This makes it easy to spot strengths and weaknesses across departments instantly.
Click to buy Pharmaceuticals KPI Dashboard in Excel
KPI Trend Sheet
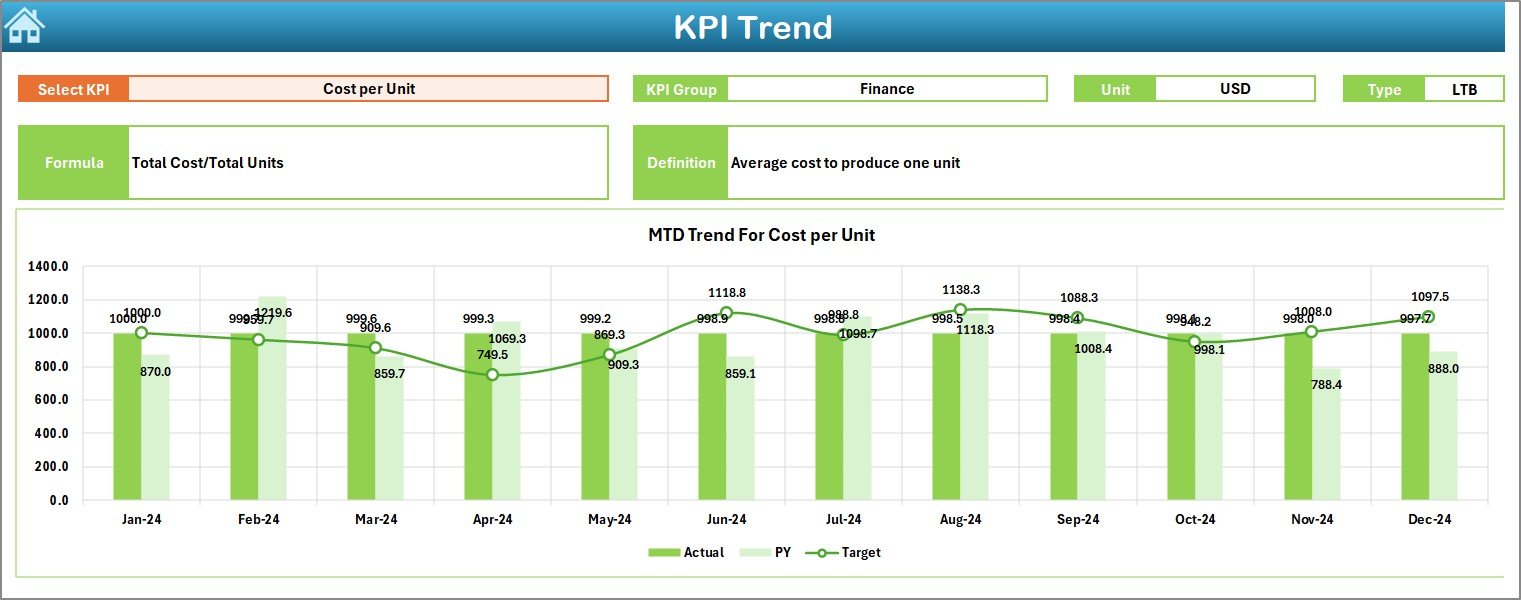
The KPI Trend sheet allows you to focus on one KPI at a time.
You can select any KPI from a drop-down menu located at cell C3.
Once a KPI is selected, the sheet displays:
- KPI Group (e.g., Production, Quality, Sales, R&D)
- Unit of Measurement (e.g., %, Units, Days)
- Type of KPI — whether Lower-the-Better (LTB) or Upper-the-Better (UTB)
- Formula used for calculation
- Short KPI definition
Below these details, you’ll find two trend charts that show MTD and YTD progress of Actual, Target, and Previous Year numbers.
These visual trends make it simple to track performance over time and identify whether the team is improving or lagging.
Actual Numbers Input Sheet
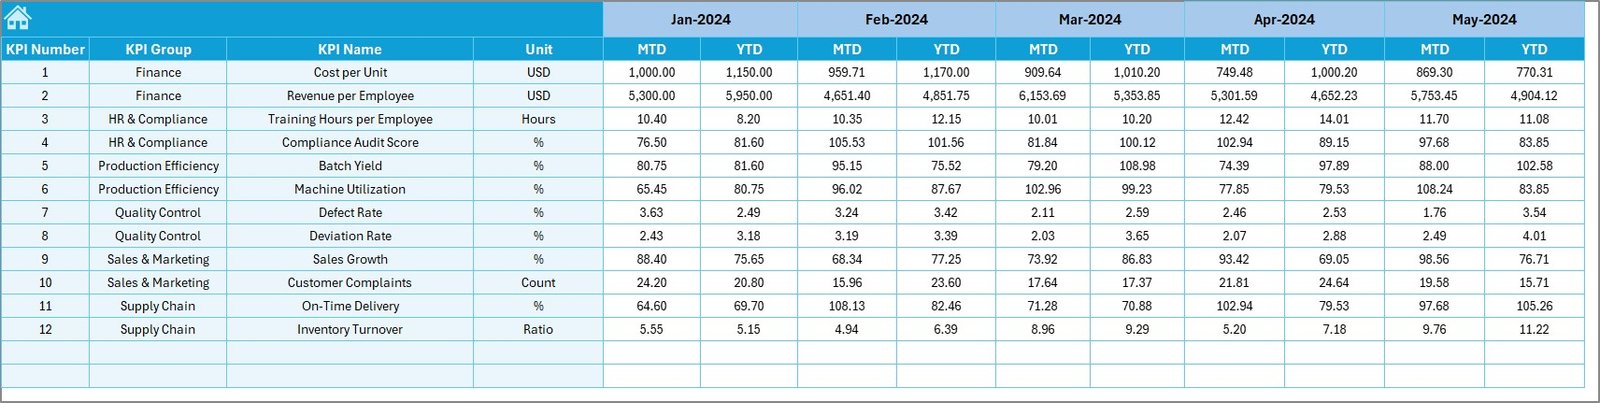
The Actual Numbers Input sheet is the data entry section for real performance figures.
Here, you’ll input the monthly MTD and YTD numbers for each KPI.
At the top of this sheet (range E1), you can define the first month of your financial year.
The rest of the months update automatically, keeping your reporting aligned with your chosen start period.
This sheet ensures that all actual performance data feeds directly into the dashboard visuals without the need for any complex formulas or macros.
Click to buy Pharmaceuticals KPI Dashboard in Excel
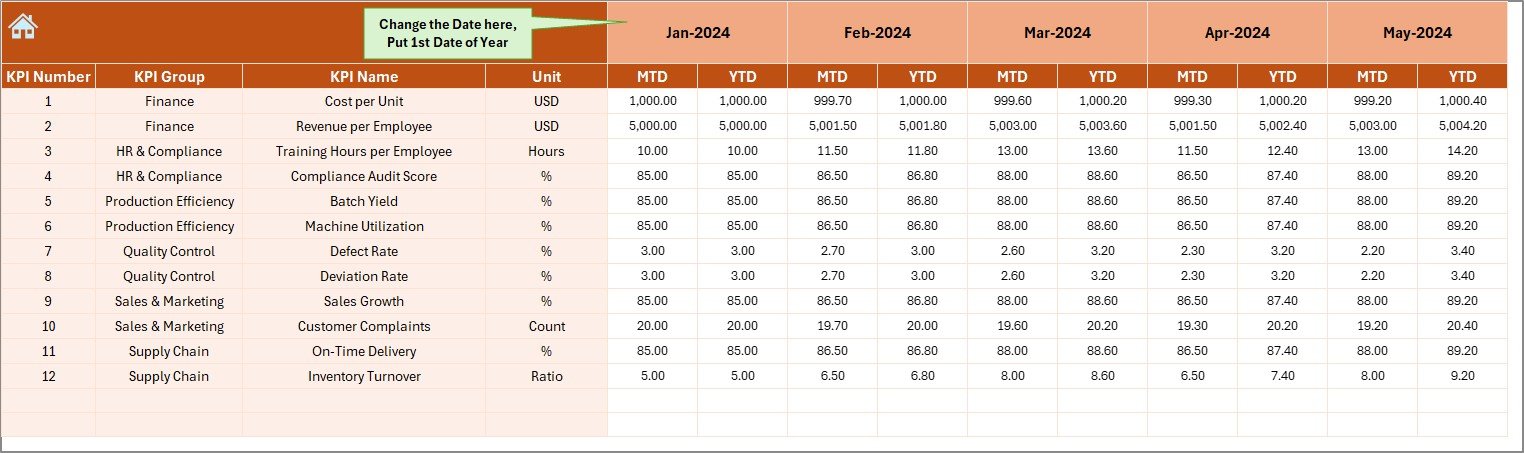
Target Sheet
The Target sheet captures the target values for each KPI, both MTD and YTD.
Targets can be defined monthly to help set performance goals for teams and departments.
For example:
- Production Yield Target (MTD) = 95%
- R&D Cycle Time Target (YTD) = 30 Days
By defining clear targets, teams can compare their performance regularly and stay motivated to achieve business goals.
Previous Year Number Sheet
The Previous Year sheet stores last year’s KPI data.
It follows the same structure as the current year’s data, ensuring easy year-over-year comparison.
This feature allows pharmaceutical companies to analyze performance trends, identify seasonal variations, and understand whether new strategies are actually improving results.
KPI Definition Sheet
The KPI Definition sheet acts as a reference document for all KPIs used in the dashboard.
It contains columns for:
- KPI Name
- KPI Group
- Unit
- Formula
- Definition
This sheet provides clarity and ensures that everyone in the organization understands each KPI’s meaning and purpose.
It prevents confusion and helps standardize reporting across multiple teams.
Key Performance Indicators Used in the Dashboard
A well-structured pharmaceutical dashboard tracks KPIs across major functions.
Here are some common examples you can include or customize based on your needs:
Advantages of a Pharmaceuticals KPI Dashboard in Excel
A pharmaceutical organization gains multiple benefits from using an Excel-based KPI dashboard.
- Centralized Data Management
- All information stays in one structured workbook.
You no longer need multiple files or systems to track KPIs from various departments. - Real-Time Performance Tracking
- With automated formulas and drop-downs, the dashboard updates instantly whenever new data is entered.
- Simplified Visualization
- Conditional formatting, charts, and comparison arrows make it easy to interpret results without complex reports.
- Customizable Design
- You can modify KPI names, groups, targets, or charts based on your company’s specific requirements.
- Cost-Effective Solution
- Unlike expensive BI tools, Excel dashboards are budget-friendly and require no additional software licenses.
- Enhanced Decision-Making
- With all critical KPIs visible at a glance, leaders can make quick, data-driven decisions.
- Improved Accountability
- Each KPI links to a department or responsible person, ensuring transparency and ownership.
How to Use the Pharmaceuticals KPI Dashboard
Follow these steps to get the best out of your dashboard:
- Set Up KPI Definitions:
Use the KPI Definition sheet to define each KPI clearly — include its formula, unit, and responsible team. - Enter Target Data:
Fill in monthly MTD and YTD target values in the Target sheet. - Add Actual Numbers:
Input actual performance data regularly in the Actual sheet. - Update Previous Year Data:
Enter last year’s values for accurate comparisons. - Navigate Using the Home Sheet:
Use the buttons on the Home page to move quickly between sheets. - Analyze Results:
Go to the Dashboard sheet, select a month in cell D3, and view updated results instantly. - Monitor Trends:
Check the KPI Trend sheet to identify upward or downward performance movements.
Best Practices for Using the Pharmaceuticals KPI Dashboard
Following a few best practices ensures the dashboard delivers the maximum value:
- Keep Data Consistent: Use the same units and naming conventions throughout all sheets.
- Update Regularly: Enter actual data at least once a month to maintain accuracy.
- Validate KPIs: Review each KPI definition periodically to ensure relevance.
- Avoid Overcrowding: Focus only on the most critical KPIs that align with strategic goals.
- Protect Sheets: Lock formula cells to prevent accidental changes.
- Visualize Effectively: Use clear charts, color codes, and arrows for better readability.
- Back Up Files: Save versions periodically to avoid data loss.
Common Challenges Solved by the Dashboard
- Manual Errors:
Automation in Excel formulas reduces the risk of calculation mistakes. - Data Fragmentation:
Centralized data entry ensures consistency across all departments. - Performance Visibility:
Managers can quickly identify low-performing areas and take action. - Lack of Accountability:
Each KPI ties to a responsible team, ensuring ownership of results. - Delayed Reporting:
Dashboards update in real time, cutting down reporting delays.
Conclusion
The Pharmaceuticals KPI Dashboard in Excel is more than just a reporting tool — it’s a strategic performance management solution.
It helps pharmaceutical companies gain full visibility into their operations, track trends, and make better decisions without needing complex software.
Whether you’re overseeing manufacturing output, R&D progress, or regulatory compliance, this Excel dashboard provides everything in one place. It’s easy to use, cost-effective, and completely customizable.
By implementing this dashboard, your organization can streamline data management, boost productivity, and maintain a competitive edge in the pharmaceutical market.
Frequently Asked Questions (FAQs)
- What is a Pharmaceuticals KPI Dashboard in Excel?
- It’s an Excel-based tool designed to track and visualize key performance indicators across pharmaceutical operations, including production, quality, compliance, R&D, and sales.
- Who can use this dashboard?
- This dashboard is ideal for pharmaceutical managers, quality analysts, production supervisors, R&D teams, and top-level executives who want real-time insights into performance.
- How often should I update the dashboard?
- You should update MTD and YTD data at least once every month or as soon as new performance figures become available.
- Can I customize the KPIs?
- Yes, you can modify KPI names, groups, formulas, and targets in the KPI Definition and Target sheets based on your organization’s goals.
- Does this dashboard require VBA or macros?
- No. It works entirely with standard Excel formulas, drop-downs, and conditional formatting, making it simple to use.
- What benefits does this dashboard offer over manual tracking?
- It eliminates manual calculation errors, saves time, enhances visualization, and provides an instant view of all KPIs in one place.
- Can this dashboard compare current and previous year performance?
- Yes, it displays both current year and previous year data side by side with clear comparison arrows.
- Is this dashboard suitable for large teams?
Absolutely. You can share the file across departments so each team can input data into designated sheets and review results collectively.
Visit our YouTube channel to learn step-by-step video tutorials
Watch the step-by-step video tutorial:
Click to buy Pharmaceuticals KPI Dashboard in Excel