Managing contracts in port operations demands accuracy, speed, and full visibility. Ports handle high-value contracts related to terminal operations, logistics, maintenance, dredging, security, IT services, and infrastructure development. Therefore, contract managers, finance teams, and leadership must track performance continuously. However, when contract KPIs remain scattered across multiple Excel files, emails, and manual reports, control weakens quickly.
That is exactly why a Port Contract Management KPI Dashboard in Excel becomes a powerful, business-ready solution.
In this in-depth article, you will learn what a Port Contract Management KPI Dashboard in Excel is, why it matters, how it works, its complete worksheet structure, key KPIs, advantages, best practices, and frequently asked questions. Moreover, this guide uses simple language, strong transitions, and practical port-industry logic so you can apply it confidently in real-world scenarios.
Click to buy Port Contract Management KPI Dashboard in Excel
What Is a Port Contract Management KPI Dashboard in Excel?
A Port Contract Management KPI Dashboard in Excel is a centralized, interactive reporting tool designed to monitor, analyze, and visualize contract-related KPIs for port operations.
Instead of reviewing raw contract data manually, this dashboard transforms numbers into clear KPIs, trends, and performance indicators. As a result, port authorities and contract teams gain instant visibility into contract value, compliance, cost control, performance risks, and financial impact.
Moreover, because it runs entirely in Excel, teams can deploy it quickly without investing in expensive BI tools.
Why Do Ports Need a Contract Management KPI Dashboard?
Ports manage hundreds of contracts simultaneously. Each contract includes cost commitments, service-level agreements, renewal dates, penalties, and vendor obligations. Therefore, teams must track performance proactively.
However, traditional reporting creates several problems:
- Data stays spread across files
- KPI tracking becomes slow and manual
- Risk indicators appear too late
- Decision-making becomes reactive
In contrast, a Port Contract Management KPI Dashboard in Excel solves these challenges by offering real-time insights in one screen.
How Does a Port Contract Management KPI Dashboard in Excel Work?
The dashboard works by connecting structured KPI data with Excel formulas, drop-downs, and charts. Because of this structure, users can update numbers once and see results everywhere instantly.
- Here is how the process flows:
- Enter actual values monthly
- Enter target values for KPIs
- Enter previous year data
- Select month or KPI using drop-downs
- Review MTD and YTD performance instantly
- As a result, teams shift from manual tracking to data-driven contract control.
What Are the Key Features of a Port Contract Management KPI Dashboard in Excel?
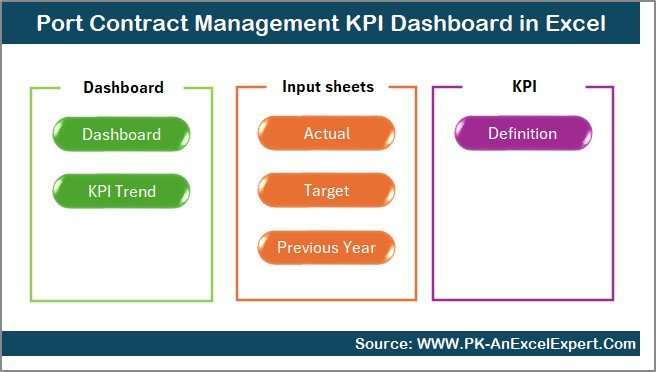
This dashboard includes 7 well-structured worksheets, each serving a specific purpose. Together, they create a complete contract KPI monitoring system.
Summary Page
The Summary Page acts as the navigation hub of the entire dashboard.
Key Highlights of the Summary Page
- Works as an index sheet
- Includes 6 navigation buttons
- Allows instant jump to any analysis sheet
- Improves usability and speed
Because of this page, users never waste time searching for sheets. Instead, they move directly to the required analysis.
Click to buy Port Contract Management KPI Dashboard in Excel
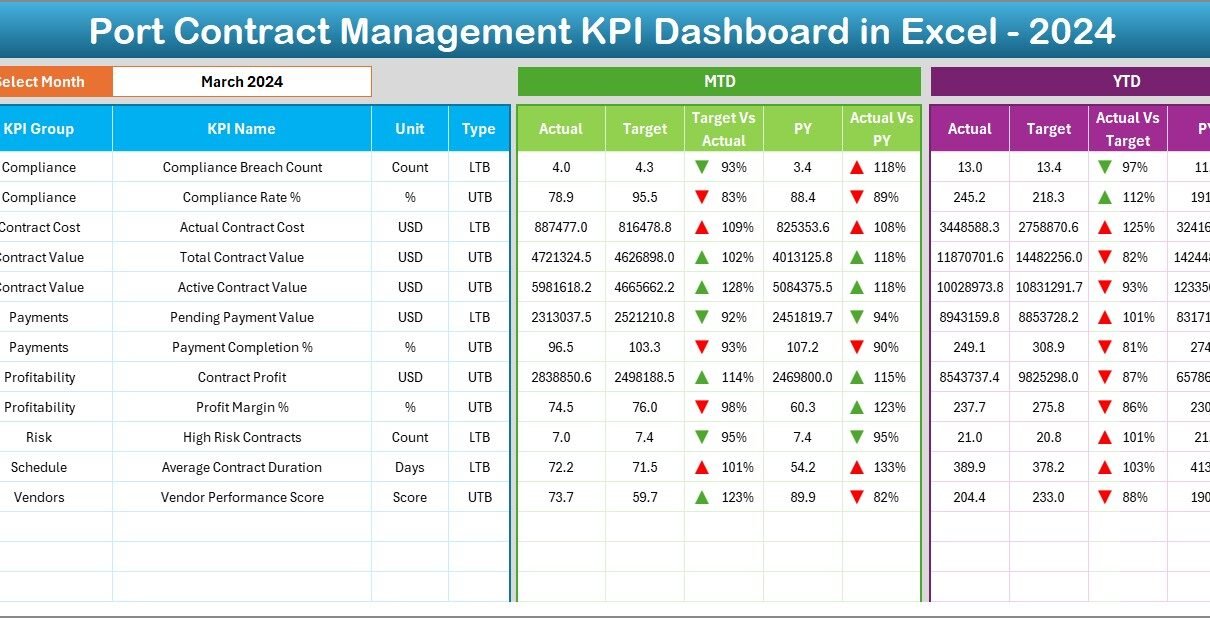
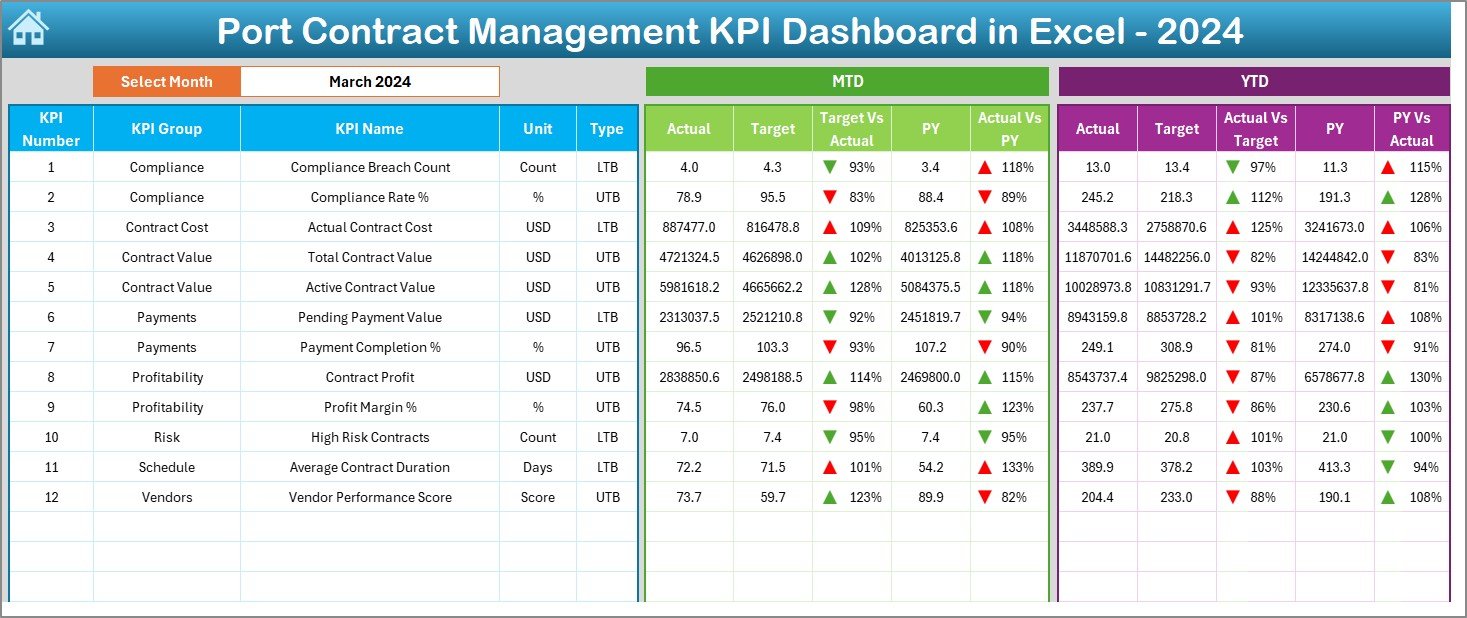
Dashboard Sheet
The Dashboard Sheet serves as the main analytical view.
Key Functions of the Dashboard Sheet
- Displays all KPIs in one place
- Includes a Month selector at cell D3
- Updates all KPIs dynamically based on month selection
KPIs Displayed on the Dashboard
- MTD Actual
- MTD Target
- MTD Previous Year
- Target vs Actual
- PY vs Actual
- YTD Actual
- YTD Target
- YTD Previous Year
Moreover, the dashboard uses conditional formatting with up and down arrows, which immediately highlights positive and negative performance.
As a result, decision-makers identify risks and opportunities at a glance.
Click to buy Port Contract Management KPI Dashboard in Excel
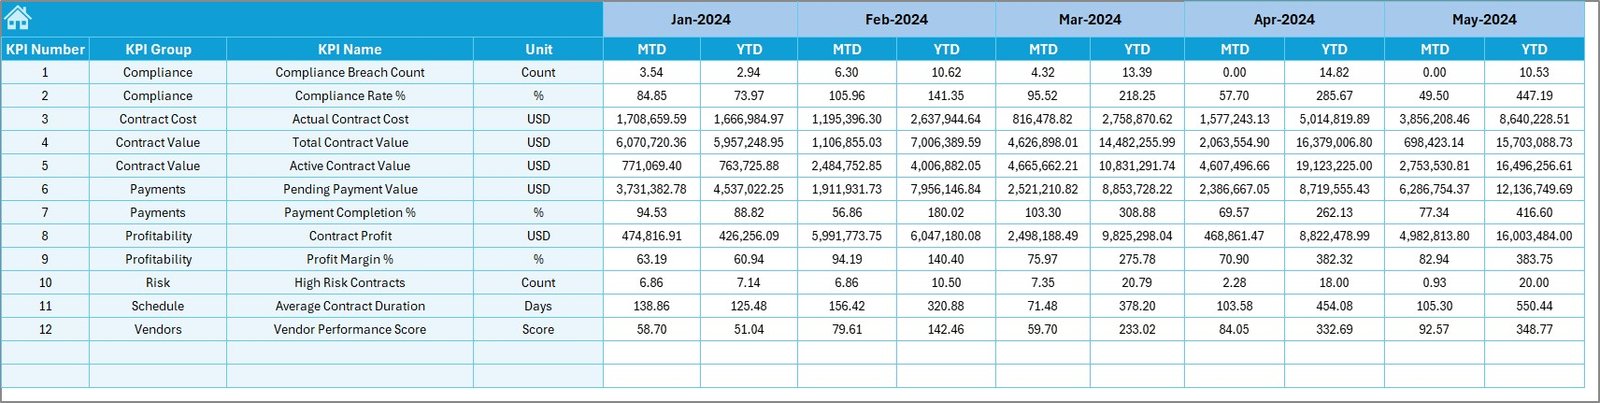
Trend Sheet
The Trend Sheet Tab focuses on KPI-level deep analysis.
What Can You Do on the Trend Sheet?
- Select KPI Name from drop-down (Cell C3)
- View KPI Group and Unit
- Identify KPI Type (Lower the Better / Upper the Better)
- Review Formula and Definition
Trend Analysis Provided
- MTD trend for Actual, Target, and PY
- YTD trend for Actual, Target, and PY
Because of this structure, users can easily analyze performance movement over time and identify early warning signals.

Click to buy Port Contract Management KPI Dashboard in Excel
Actual Numbers
The Actual Numbers Input Sheet allows users to enter real contract performance data.
Key Features
- Enter MTD and YTD actual values
- Change reporting month using Cell E1
- Input the first month of the year once
- Automatically aligns all calculations
Because data entry remains centralized, errors reduce significantly.

Click to buy Port Contract Management KPI Dashboard in Excel
Target Sheet Tab
The Target Sheet Tab defines expected performance.
Key Responsibilities
- Enter monthly MTD targets
- Enter YTD targets
- Set clear benchmarks for KPIs
Therefore, the dashboard always compares actual performance against defined goals.
Click to buy Port Contract Management KPI Dashboard in Excel
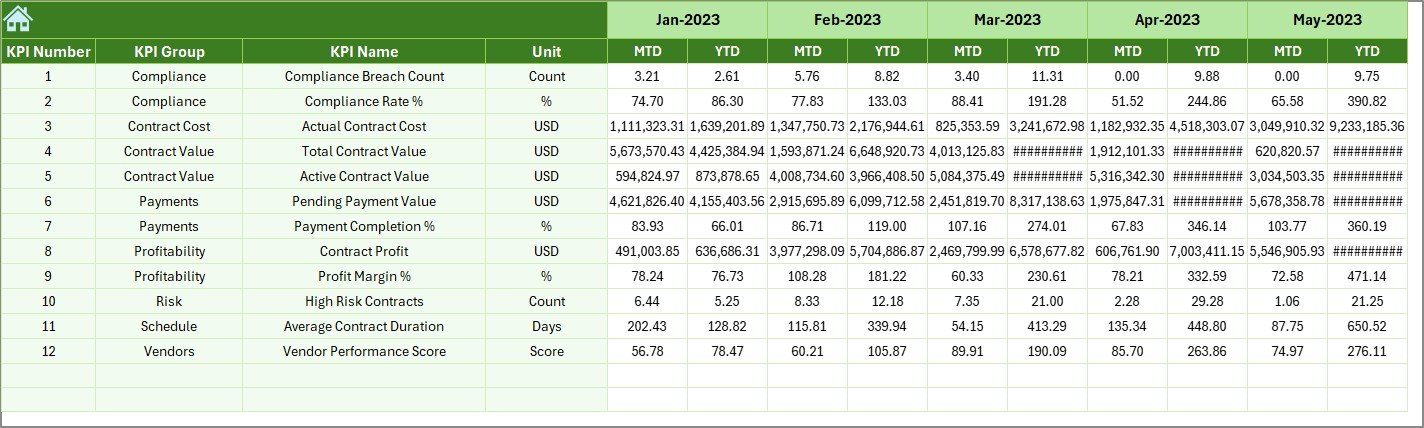
Previous Year Number Sheet
The Previous Year Number Sheet enables year-over-year comparison.
Benefits of This Sheet
- Enter historical KPI data
- Compare current year vs previous year
- Identify long-term performance improvement or decline
As a result, management gains historical context for every KPI.
Click to buy Port Contract Management KPI Dashboard in Excel
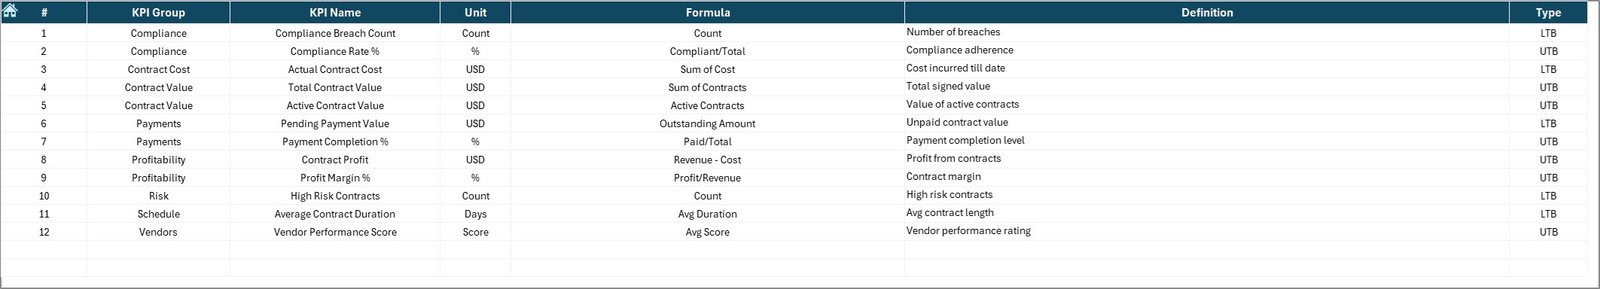
KPI Definition Sheet
The KPI Definition Sheet acts as the foundation of the dashboard.
Information Maintained Here
- KPI Name
- KPI Group
- Unit of Measurement
- Formula
- KPI Definition
Because of this sheet, all users understand KPIs clearly, which improves consistency and governance.
Click to buy Port Contract Management KPI Dashboard in Excel
What Are Common KPIs Used in Port Contract Management?
A Port Contract Management KPI Dashboard in Excel typically includes KPIs such as:
- Contract Value Utilization %
- Cost Variance %
- Contract Compliance Rate
- SLA Adherence %
- Penalty Exposure Amount
- Vendor Performance Score
- Contract Renewal Timeliness %
- Invoice Accuracy Rate
- Revenue Leakage %
- Dispute Resolution Time
These KPIs cover financial, operational, compliance, and risk dimensions.
Advantages of Port Contract Management KPI Dashboard in Excel
Why Should Ports Use This Dashboard?
- Centralized contract KPI visibility
- Faster decision-making
- Improved contract compliance
- Early risk identification
- Reduced manual reporting effort
- Better financial control
- Easy month-wise and KPI-wise analysis
Moreover, Excel makes this solution cost-effective and scalable.
Who Can Benefit from This Dashboard?
This dashboard benefits multiple stakeholders, including:
- Port Authorities
- Contract Managers
- Finance & Accounting Teams
- Procurement Teams
- Compliance Officers
- Senior Management
Because each role sees the same data, alignment improves across departments.
How Does This Dashboard Improve Decision-Making?
The dashboard improves decision-making in three major ways:
- Visibility – All KPIs appear in one place
- Speed – Instant updates with drop-downs
- Clarity – Visual indicators highlight issues
As a result, teams act proactively instead of reacting late.
Best Practices for the Port Contract Management KPI Dashboard in Excel
How Can You Get the Best Results?
- Define KPIs clearly before implementation
- Maintain consistent data entry formats
- Update actuals monthly without delay
- Validate targets regularly
- Review trends instead of only monthly values
- Use KPI definitions for training new users
- Archive historical versions annually
When teams follow these practices, dashboard accuracy and trust increase significantly.
How Often Should You Update the Dashboard?
Ideally, teams should update the dashboard monthly. However, high-risk contracts may require weekly updates.
Regular updates ensure that KPIs remain relevant and actionable.
How Does This Dashboard Support Risk Management?
The dashboard highlights risks using:
- Target vs Actual variance
- PY vs Actual comparison
- Trend deterioration patterns
- Conditional formatting alerts
Therefore, teams identify issues early and take corrective action before escalation.
Can This Dashboard Scale with Growing Port Operations?
Yes, the dashboard scales easily.
Because KPI definitions and data entry remain flexible, users can:
- Add new KPIs
- Add new contract categories
- Extend years and months
- Customize charts
As port operations grow, the dashboard grows with them.
Conclusion: Why Port Contract Management KPI Dashboard in Excel Matters
A Port Contract Management KPI Dashboard in Excel transforms scattered contract data into a clear, structured, and decision-ready system. Instead of manual tracking, teams gain centralized control, visual insights, and proactive risk management.
Because ports operate in high-value, high-risk environments, contract performance visibility becomes non-negotiable. This dashboard delivers that visibility without complexity or high cost.
If ports aim to improve compliance, profitability, and operational efficiency, implementing this KPI dashboard becomes a smart and practical step.
Frequently Asked Questions (FAQs)
- What is a Port Contract Management KPI Dashboard in Excel?
It is an Excel-based tool that tracks and visualizes key performance indicators related to port contracts in a centralized dashboard.
- Do I need advanced Excel skills to use this dashboard?
No. Basic Excel knowledge works well because the dashboard uses drop-downs, formulas, and simple data entry sheets.
- Can I customize KPIs in the dashboard?
Yes. You can easily add, modify, or remove KPIs using the KPI Definition Sheet.
- How does the dashboard compare actual vs target performance?
The dashboard automatically calculates variance and displays it using conditional formatting arrows.
- Can this dashboard handle multiple years of data?
Yes. You can extend the structure to include additional years without redesigning the dashboard.
- Is this dashboard suitable for both small and large ports?
Absolutely. The dashboard works effectively for small ports and scales well for large, multi-terminal ports.
Visit our YouTube channel to learn step-by-step video tutorials
Watch the step-by-step video tutorial:
Click to buy Port Contract Management KPI Dashboard in Excel