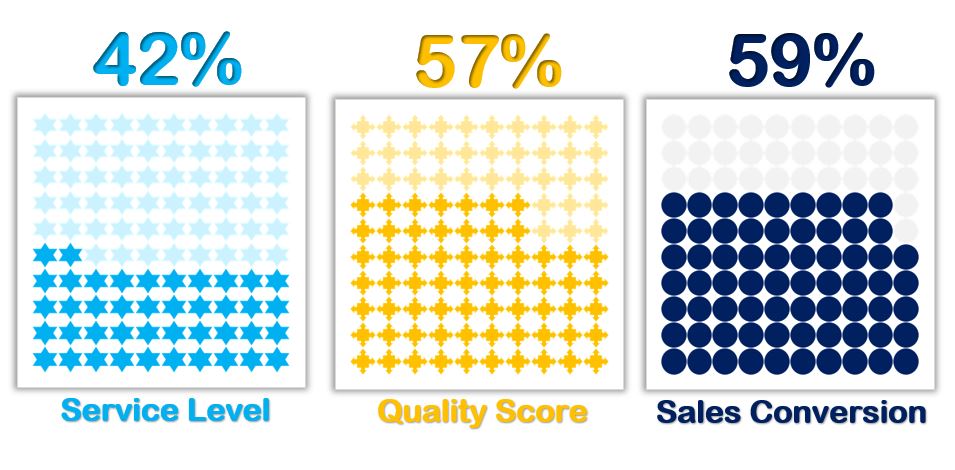
Waffle Charts in Excel Without Macro
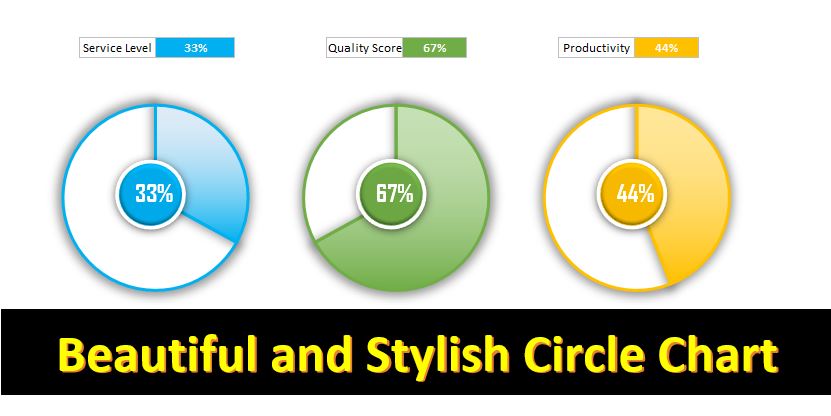
The Waffle Chart is an attractive 10x10 grid in which each cell represents one percentage point. You can use this chart to display your KPI metrics like Service Level %,
Transforming Data into Decisions