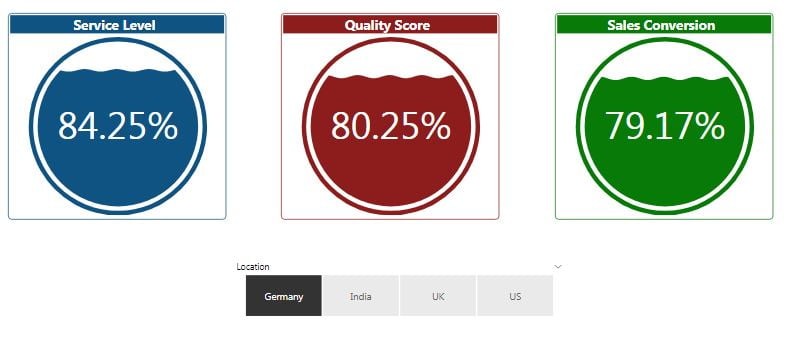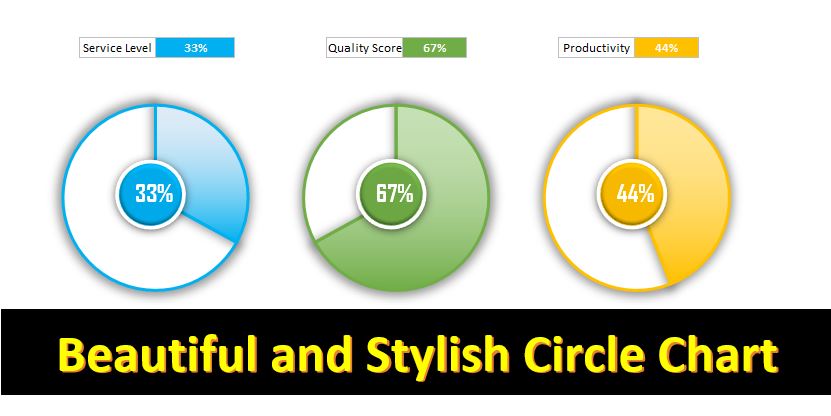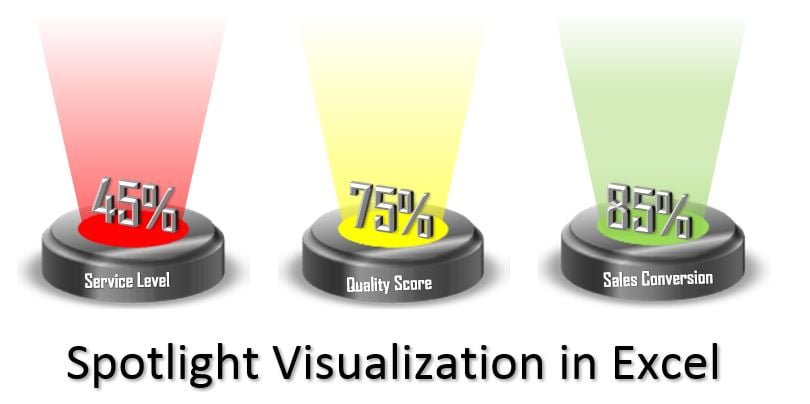
Spotlight Visualization in Excel (Part-1)
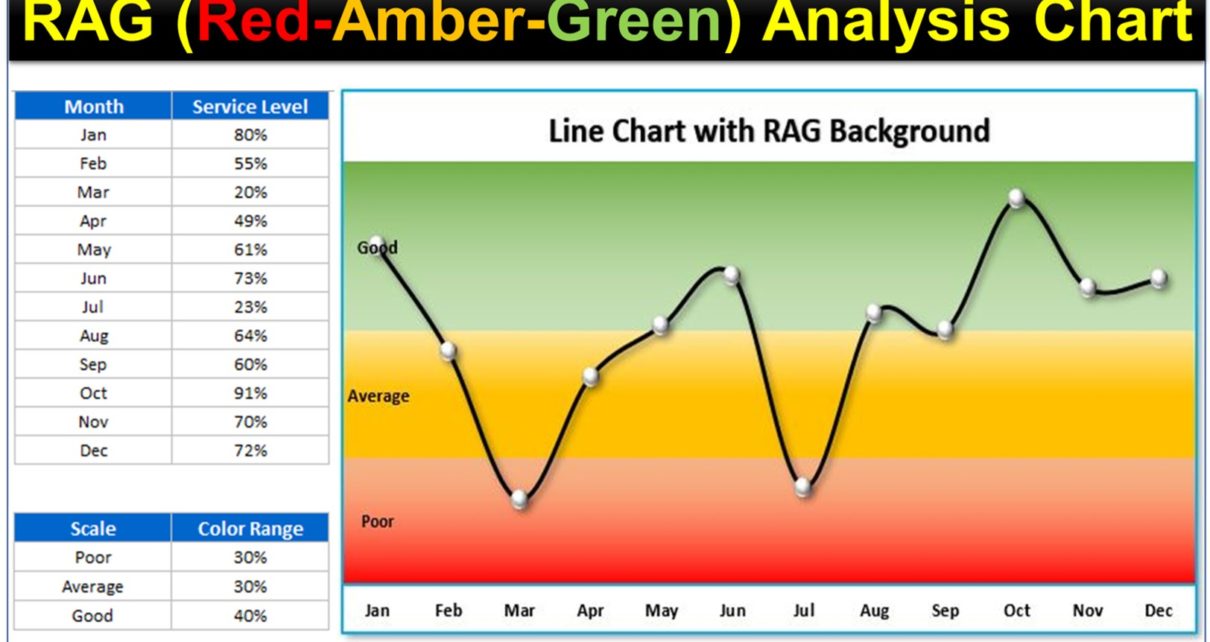
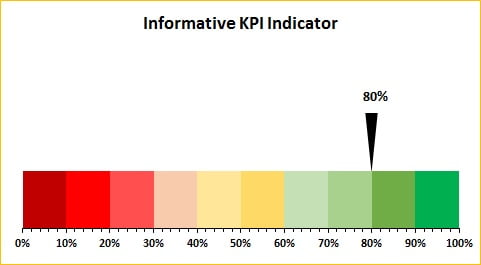
This is the first part of Spotlight visualization in excel Here we have used RAG (Red, Amber and Green) color code to display metric performance like – Service Level, Quality Score
Transforming Data into Decisions