New: NextGenTemplates Academy - video courses on Excel formulas with AI and Pivot Tables & dashboards. Early-bird: 20% off with code EARLYBIRD20 - first 20 orders only. See the courses →
  • Learn Excel (Free Course)
    • 1. Shortcut Keys
    • 2. Fill & Flash Fill
    • 3. Find & Replace
    • 4. Sort & Filter
    • 5. Formulas & Functions
    • 6. Data Validation
    • 7. Conditional Formatting
    • 8. Basic Charts
    • 9. Advanced Charts
    • 10. Pivot Tables
    • 11. Excel Dashboards
    • 12. VBA Course
    • 13. Excel Formulas with AI
  • Templates
  • Tutorials
    • Charts and Visualization
    • VBA
    • Excel Tips and Tricks
    • Excel Dashboards
    • Power Pivot & DAX
  • Power BI
  • Template Store
    • Ready to Use Templates
  • Courses
  • Academy
    • Excel + AI Mastery: 100 Formulas
    • Excel Pivot Tables & Dashboards
  • About Us
  • Contact Us

PK: An Excel Expert

Transforming Data into Decisions

Tag: KPI Dashboard

Power BI

Robotics Process Automation Dashboard in Power BI

August 7, 2026August 7, 2026 PKComments Off on Robotics Process Automation Dashboard in Power BI
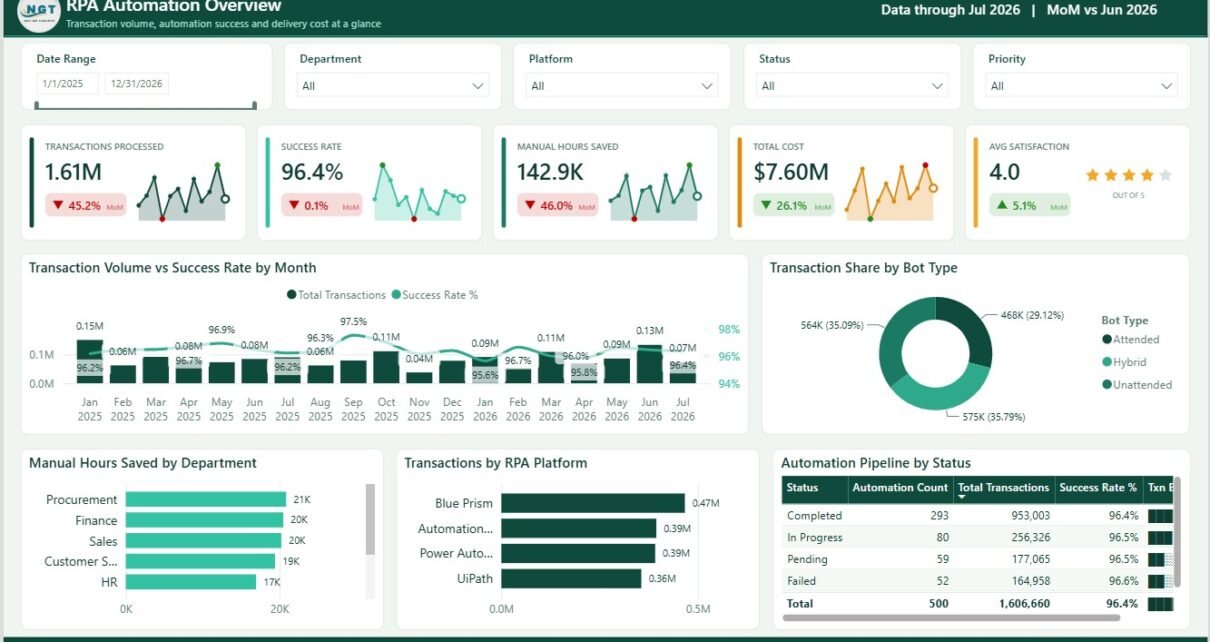
Robotics Process Automation Dashboard in Power BI Key Features of Robotics Process Automation Dashboard in Power BI 5 Power BI pages: Overview, Automation Trend, Department View, Bot Performance, and Cost
Read More
Dashboard

Robotics Process Automation Dashboard in Excel

August 7, 2026August 7, 2026 PKComments Off on Robotics Process Automation Dashboard in Excel
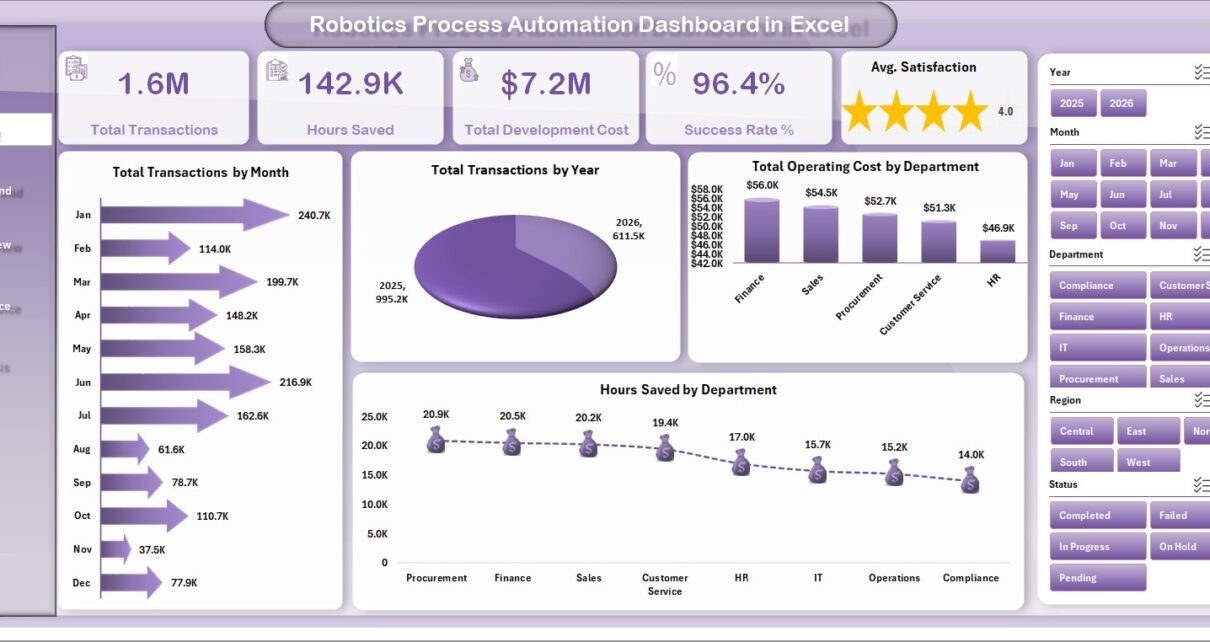
Robotics Process Automation Dashboard in Excel helps RPA managers, automation teams, IT leaders, and process improvement analysts turn automation records into a clear reporting workbook. Instead of checking separate files for
Read More
Dashboard

Roadside Assistance Networks Dashboard in Excel

August 5, 2026August 5, 2026 PKComments Off on Roadside Assistance Networks Dashboard in Excel
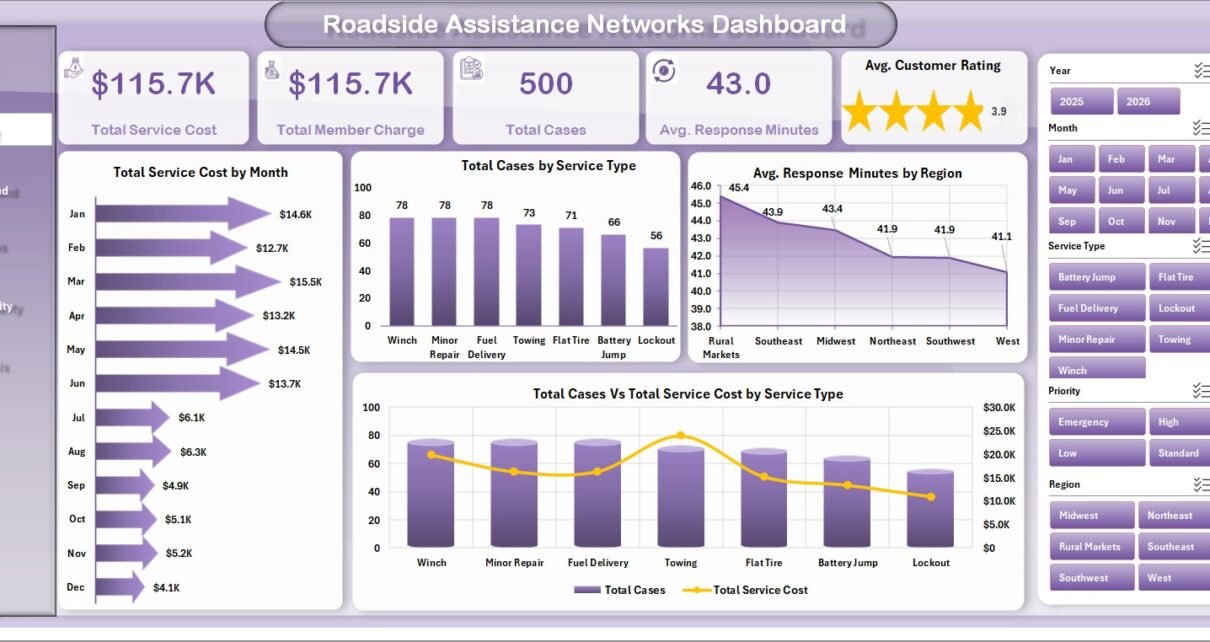
Roadside Assistance Networks Dashboard in Excel is a ready-to-use reporting workbook for teams that need a clearer view of roadside service cost, member charges, case volume, response time, customer rating, provider
Read More
Dashboard Templates

Risk Assessment Firms Dashboard in Excel

August 5, 2026August 5, 2026 PKComments Off on Risk Assessment Firms Dashboard in Excel
Risk assessment firms often manage dozens of client assessments, findings, remediation estimates, completion updates, and compliance standards at the same time. Even a small firm handling 25 clients, 5 industries,
Read More
Power BI

RetailTech Dashboard in Power BI

August 4, 2026August 4, 2026 PKComments Off on RetailTech Dashboard in Power BI
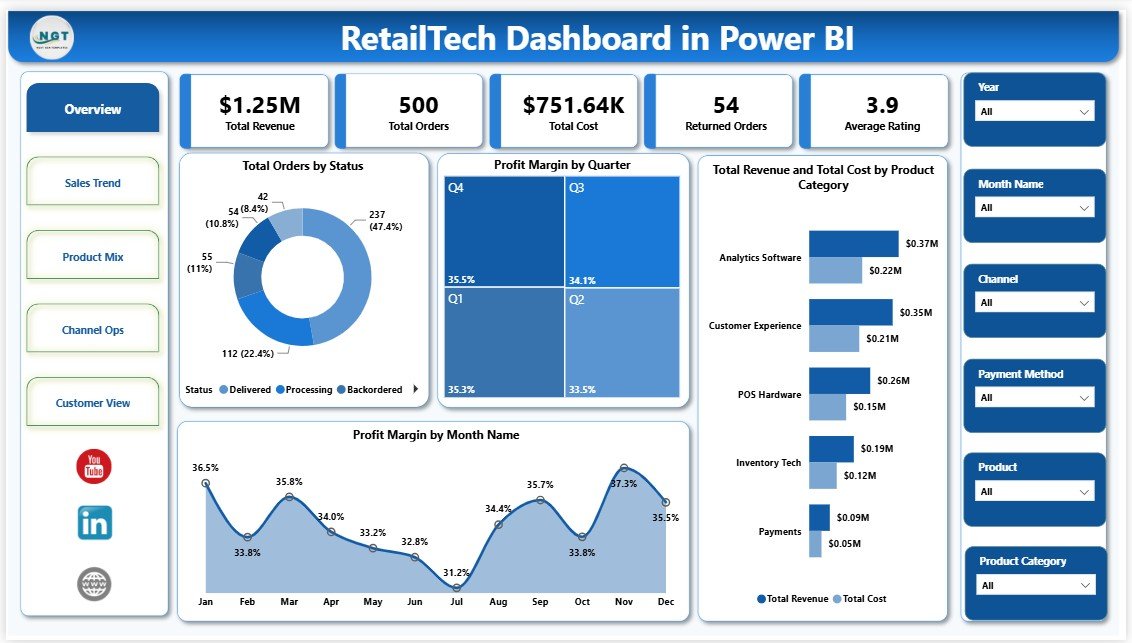
Retail businesses can generate thousands of records every month across orders, revenue, product categories, costs, channels, payment methods, regions, cities, customer segments, returns, and ratings. The RetailTech Dashboard in Power
Read More
Power BI Templates

Recycling Infrastructure Dashboard in Power BI

August 2, 2026August 2, 2026 PKComments Off on Recycling Infrastructure Dashboard in Power BI
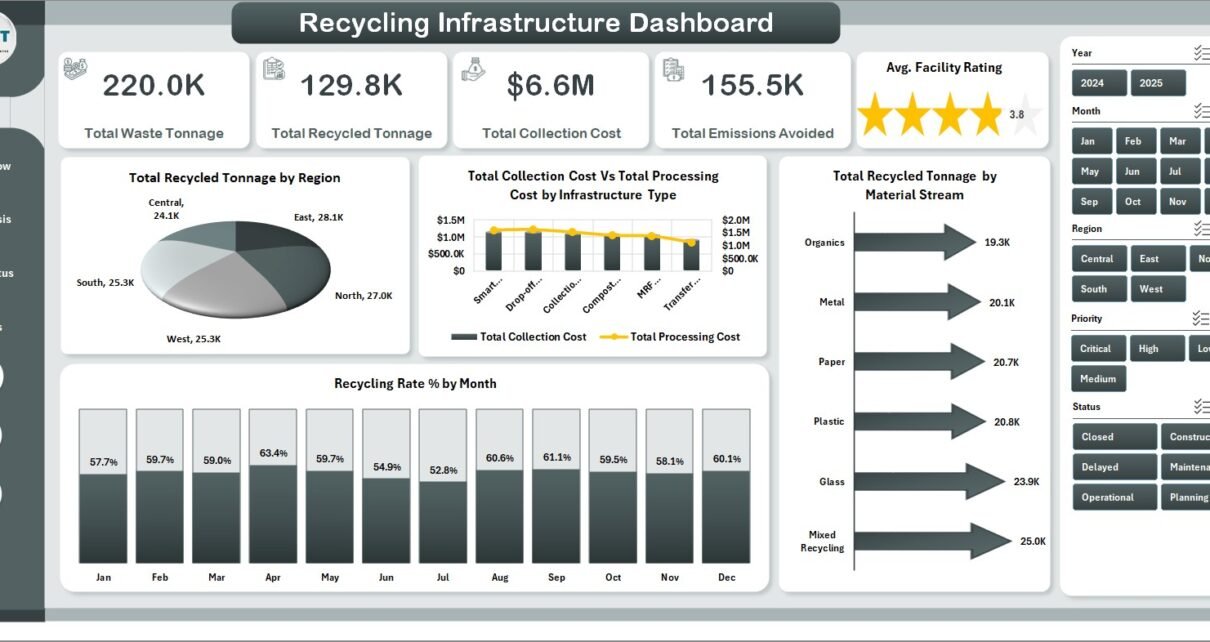
Recycling infrastructure is no longer a simple monthly tonnage report. Teams often need to track collection cost, processing cost, total waste tonnage, recycled tonnage, recycling rate, facility readiness, project delays,
Read More
Dashboard Templates

Recycling Infrastructure Dashboard in Excel

August 1, 2026August 1, 2026 PKComments Off on Recycling Infrastructure Dashboard in Excel
Recycling programs create value only when teams can see the full operating picture: waste collected, tonnage recycled, recycling rate, cost per tonne, facility performance, project status, and avoided emissions. Many
Read More
Power BI Templates

Quantum Computing Labs Dashboard in Power BI

July 30, 2026October 10, 2026 PKComments Off on Quantum Computing Labs Dashboard in Power BI
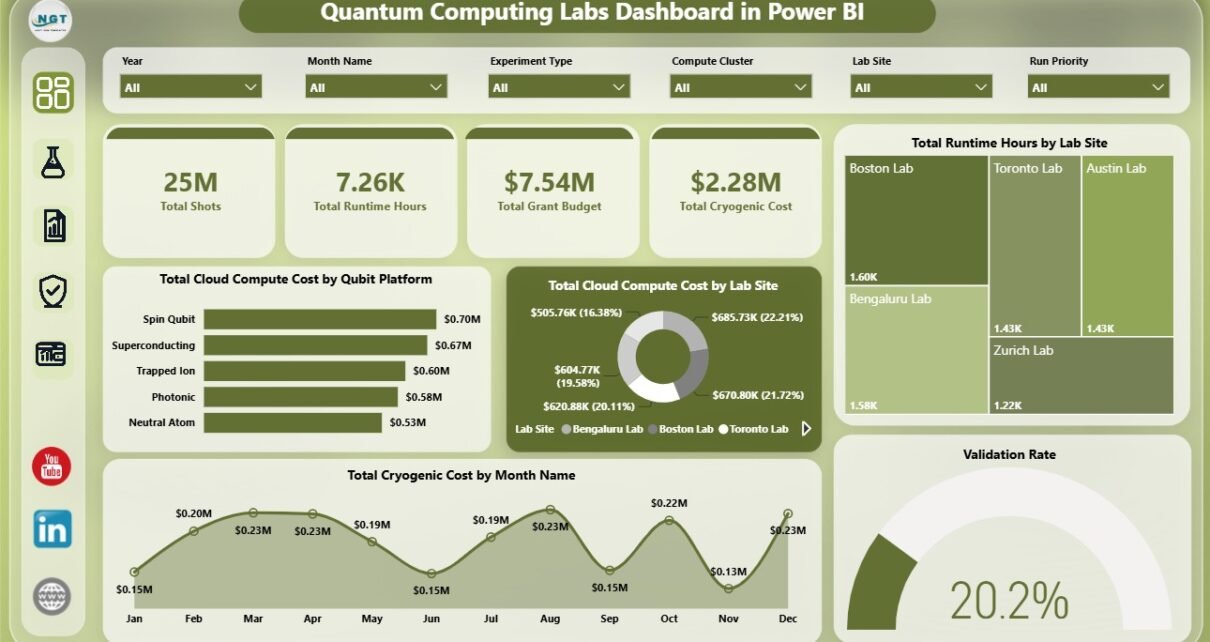
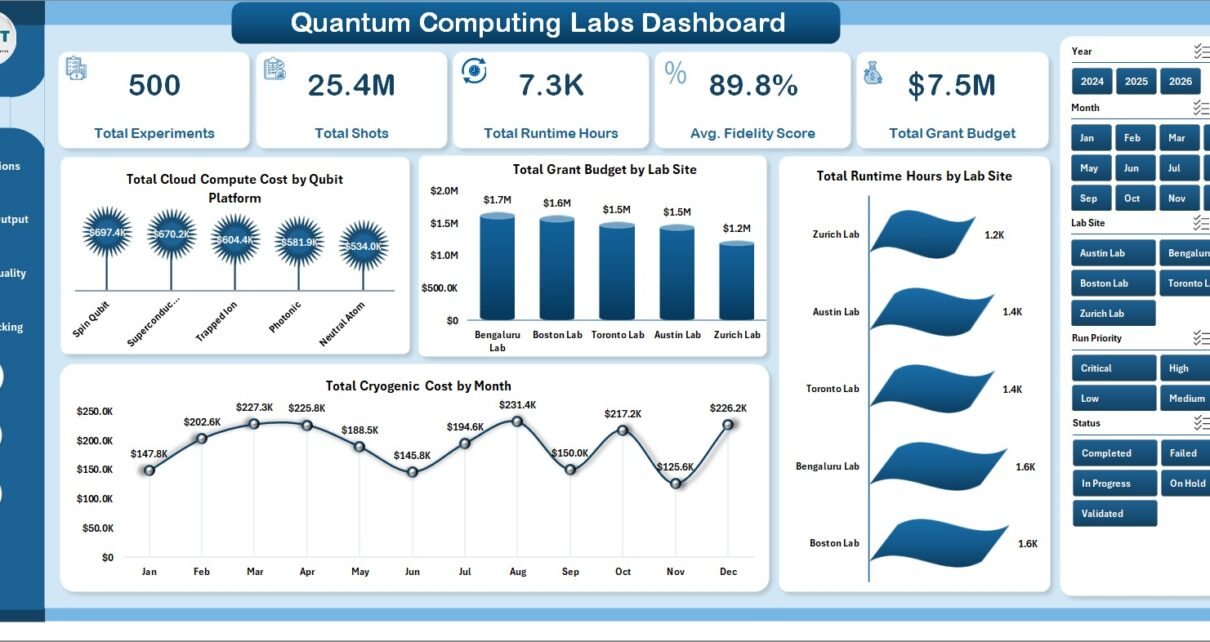
Quantum Computing Labs Dashboard in Power BI helps research teams monitor experiments, shots, runtime hours, grant budget, cryogenic cost, cloud compute cost, fidelity, and validation in one editable PBIX report.
Read More
Dashboard Templates

Quantum Computing Labs Dashboard in Excel

July 30, 2026October 10, 2026 PKComments Off on Quantum Computing Labs Dashboard in Excel
Quantum Computing Labs Dashboard in Excel helps research teams turn quantum experiment records into clear management reporting. Quantum labs often need to compare experiments, shots, runtime hours, fidelity scores, grant
Read More
Power BI Templates

Precision Medicine Dashboard in Power BI

July 28, 2026July 28, 2026 PKComments Off on Precision Medicine Dashboard in Power BI
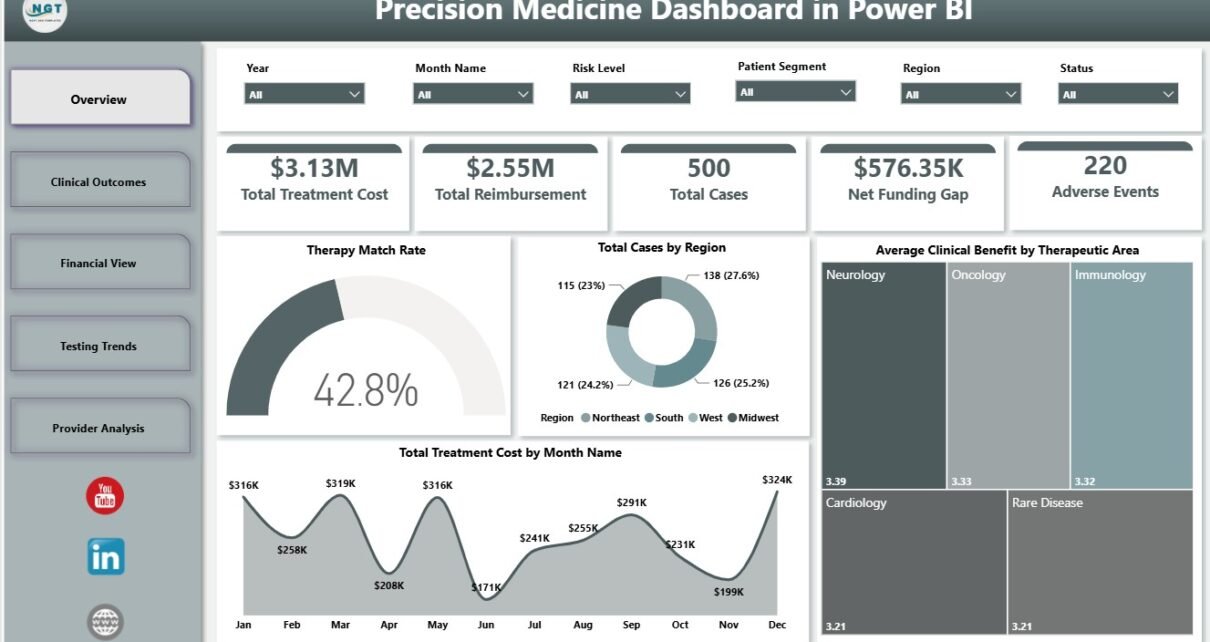
Precision medicine programs need clear analytics because each case can involve genomic testing, therapy matching, reimbursement review, treatment cost monitoring, adverse event tracking, and provider performance analysis. The Precision Medicine
Read More

Posts pagination

Previous 1 … 3 4 5 … 83 Next
  • Learn Excel (Free Course)
    • 1. Shortcut Keys
    • 2. Fill & Flash Fill
    • 3. Find & Replace
    • 4. Sort & Filter
    • 5. Formulas & Functions
    • 6. Data Validation
    • 7. Conditional Formatting
    • 8. Basic Charts
    • 9. Advanced Charts
    • 10. Pivot Tables
    • 11. Excel Dashboards
    • 12. VBA Course
    • 13. Excel Formulas with AI
  • Templates
  • Tutorials
    • Charts and Visualization
    • VBA
    • Excel Tips and Tricks
    • Excel Dashboards
    • Power Pivot & DAX
  • Power BI
  • Template Store
    • Ready to Use Templates
  • Courses
  • Academy
    • Excel + AI Mastery: 100 Formulas
    • Excel Pivot Tables & Dashboards
  • About Us
  • Contact Us
Copyright © 2023 PK-AnExcelExpert.com - Privacy Policy