Key Features of Robotics Process Automation Dashboard in Power BI
- 5 Power BI pages: Overview, Automation Trend, Department View, Bot Performance, and Cost Analysis.
- High-level KPI cards: Transactions Processed, Success Rate, Manual Hours Saved, Total Cost, and Avg Satisfaction.
- Trend reporting: Analyze monthly transaction volume, hours saved, success rate, failed transactions, and cost movement.
- Department analysis: Compare automation usage, savings, cost, count, priority, and success rate by business area.
- Bot performance views: Review platform errors, owner results, bot type failure rate, process success rate, and errors per 1K transactions.
- Cost and ROI page: Track total cost, cost per transaction, proxy ROI, regional cost, department ROI, and break-even by process.
- Power BI flexibility: Edit visuals, fields, measures, colors, slicers, and model connections in Power BI Desktop.
Dashboard Pages Explanation
1. Overview Page
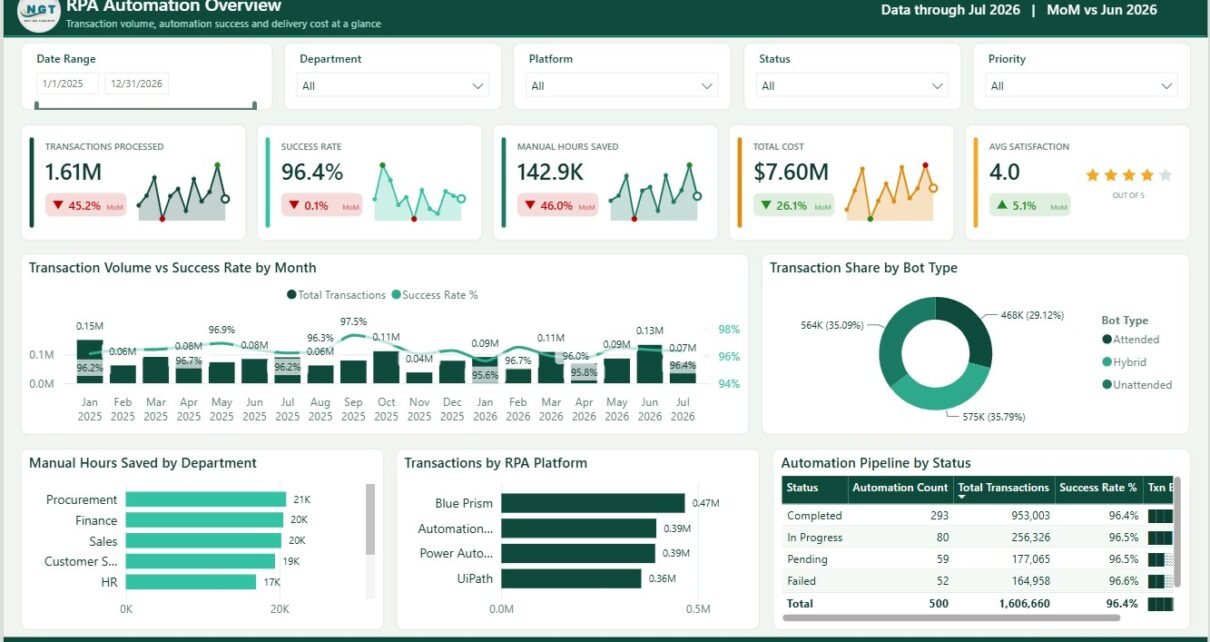
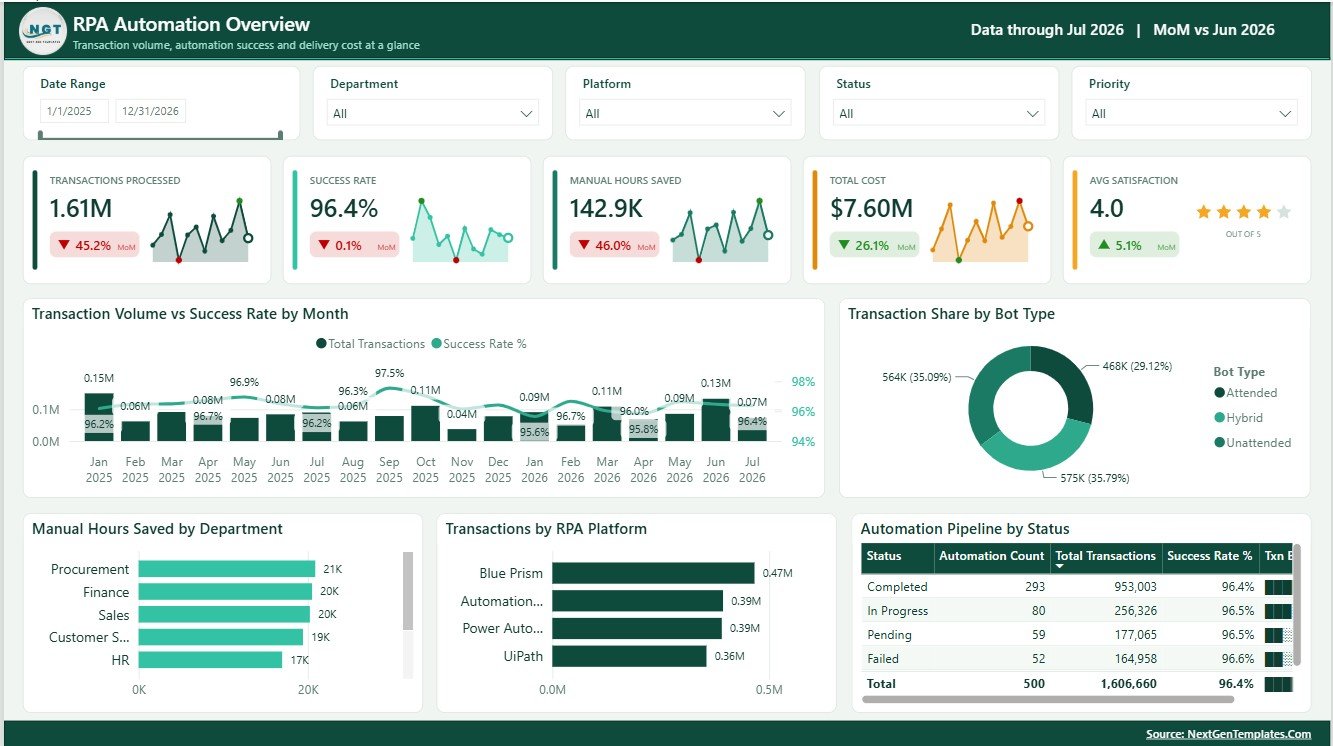
The Overview Page gives a high-level summary of the RPA program. The top KPI cards show Transactions Processed, Success Rate, Manual Hours Saved, Total Cost, and Avg Satisfaction so leaders can quickly understand scale, quality, effort saved, cost, and stakeholder experience.
Transaction Volume and Success Rate by Month: This chart compares transaction growth with execution quality. It helps you confirm whether higher automation volume is still supported by a reliable success rate.
Transaction Share by Bot Type: This visual shows how transaction volume is split by bot category. It helps compare attended, unattended, API, desktop, or other bot types in your automation portfolio.
Manual Hours Saved by Department: This chart shows which departments are saving the most manual effort. It is useful for proving productivity impact and identifying areas where RPA adoption is strongest.
Transactions by RPA Platform: This chart compares workload by automation platform. It helps IT and automation support teams see which platform is carrying the most transaction volume.
Automation Count by Status: This visual shows the number of automations by lifecycle or operating status. It helps leaders review active, planned, paused, completed, or issue-heavy automations.
Total Transactions by Status: This chart connects transaction volume with automation status. It helps identify whether high-volume workloads are running through stable or at-risk processes.
Success Rate by Status: This chart compares quality by status group. It helps explain whether specific workflow statuses are reducing overall RPA reliability.
2. Automation Trend
The Automation Trend page focuses on time-based movement across months and quarters. It helps teams review volume, savings, successful transactions, failed transactions, cost, cost per transaction, and success rate over time.
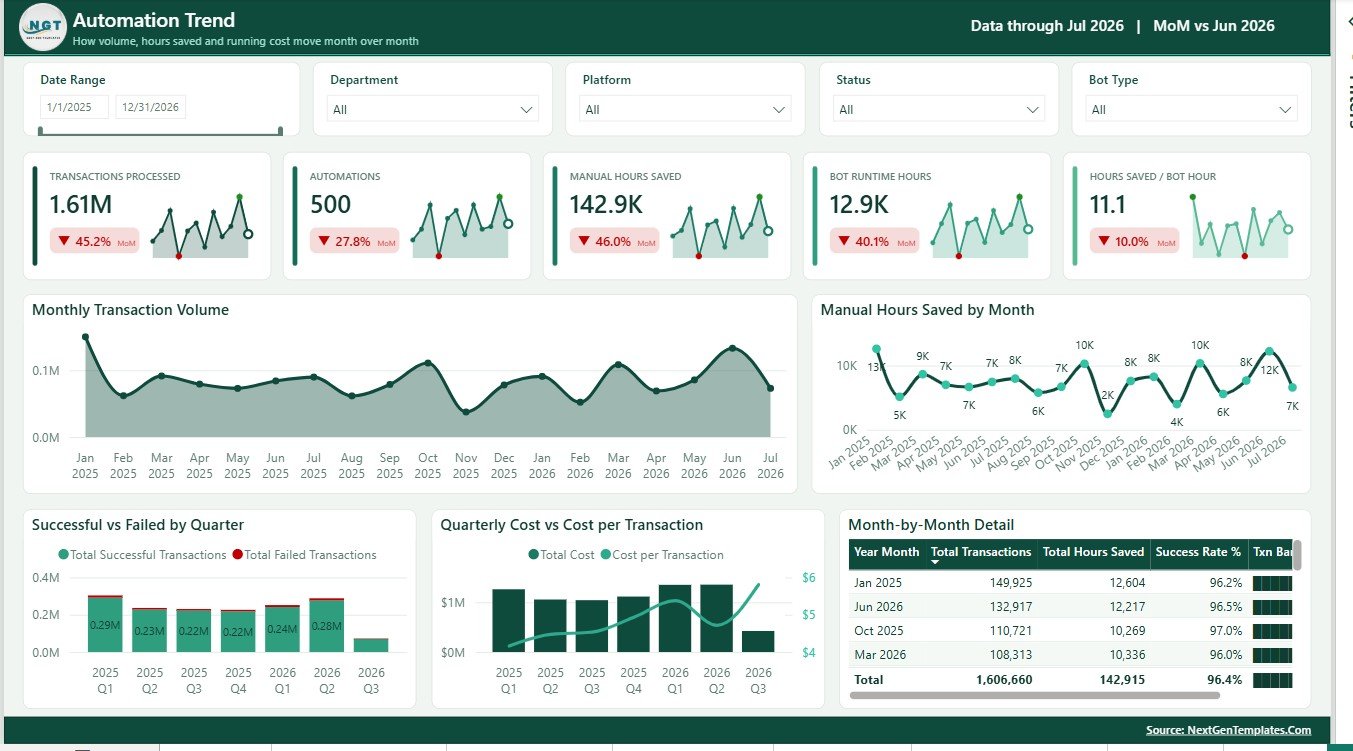
The page includes Monthly Transaction Volume by Month, Manual Hours Saved by Month, Successful Transactions and Failed Transactions by Quarter, Total Cost and Cost per Transaction by Quarter, Total Transactions by Month, Total Hours Saved by Month, and Success Rate by Month.
3. Department View
The Department View page compares automation outcomes across business departments. It is useful for department heads, RPA center-of-excellence teams, shared services managers, and transformation analysts who need to see where automation is creating measurable value.
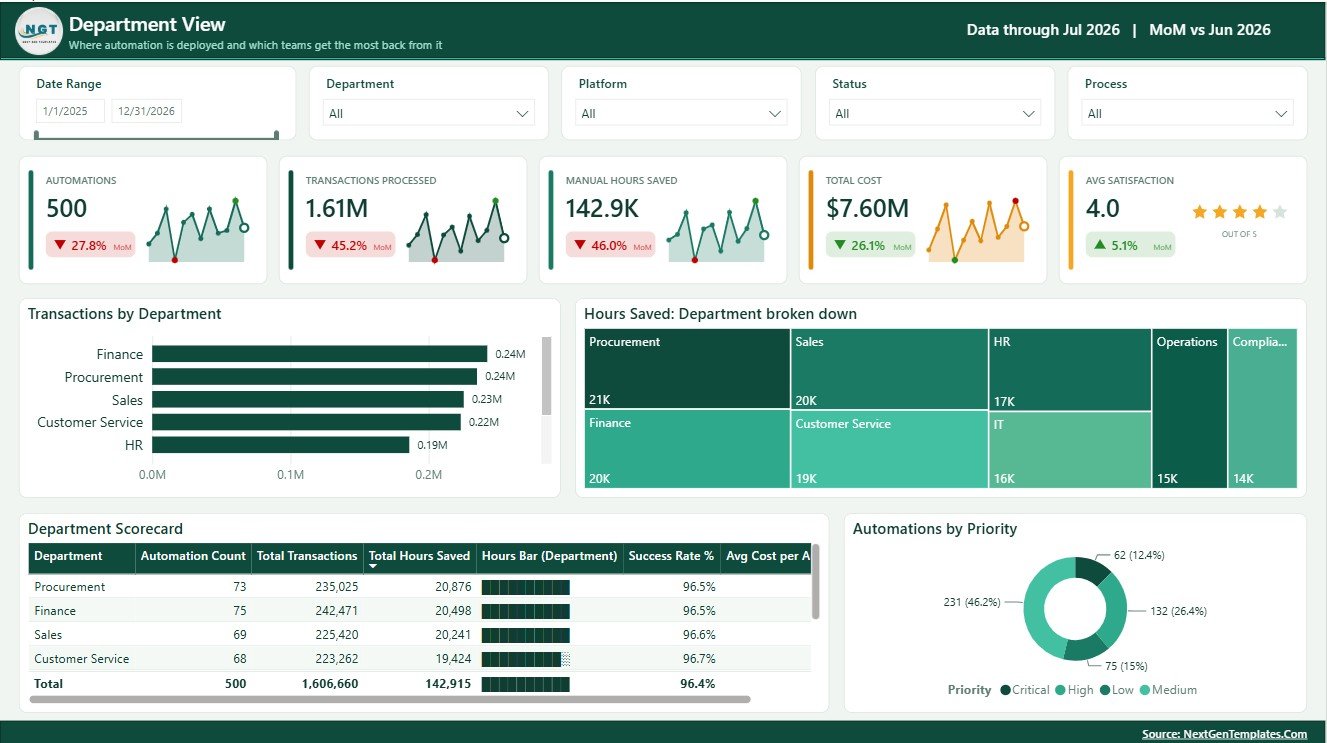
The page includes Transactions by Department, Manual Hours Saved by Department, Automation Count by Department, Total Transactions by Department, Total Hours Saved by Department, Success Rate by Department, Avg Cost per Automation by Department, and Automations by Priority.
4. Bot Performance
The Bot Performance page is built for RPA support and operations teams. It helps users understand errors, process owner performance, bot type reliability, process-level success rate, and errors per 1K transactions.
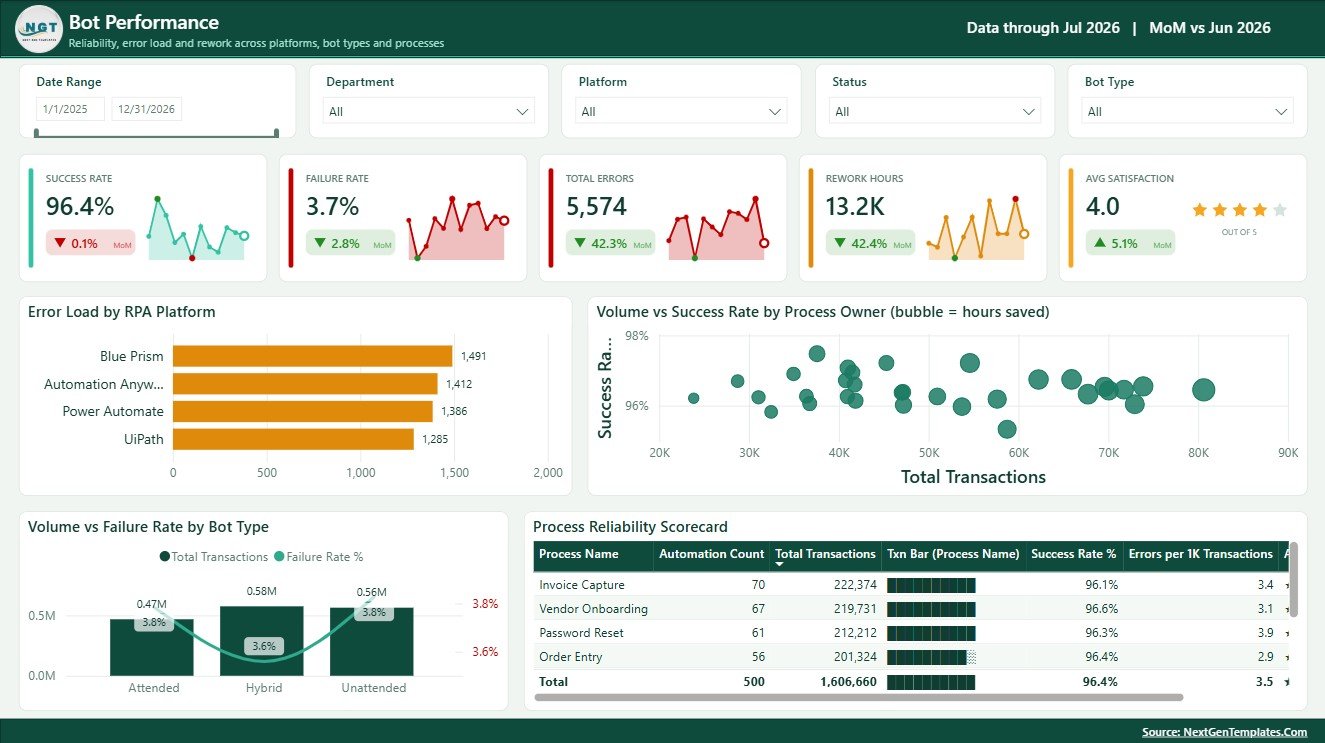
The page includes Error Load by RPA Platform, Success Rate by Process Owner, Total Transactions by Process Owner, Failure Rate by Bot Type, Total Transactions by Bot Type, Success Rate by Process Name, and Errors per 1K Transactions by Process Name.
5. Cost Analysis
The Cost Analysis page connects automation activity with financial performance. It helps teams compare cost, proxy ROI, region, department, process-level cost, cost per transaction, and break-even performance.
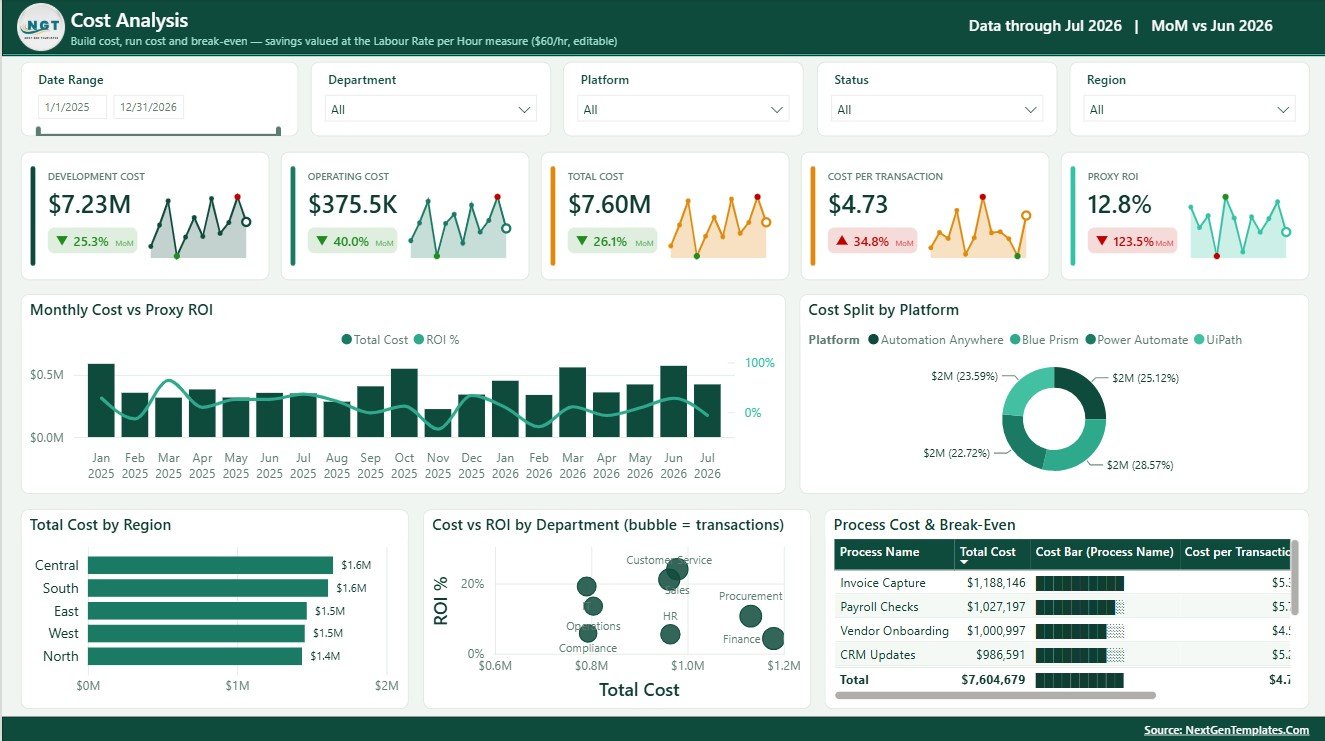
The page includes Total Cost and Proxy ROI by Month, Cost Split by Platform, Total Cost by Region, Cost and ROI by Department, Total Cost by Process Name, Cost per Transaction by Process Name, and Break-Even by Process Name.
Robotics Process Automation Dashboard in Power BI vs. Tableau vs. Paid RPA/SaaS – Feature Comparison
| Feature | This Power BI dashboard | Tableau alternative | Paid RPA/SaaS analytics |
|---|---|---|---|
| Cost | One-time template purchase | Requires Tableau access and build time | Recurring license or enterprise contract |
| Platform | Power BI Desktop and Power BI Service | Tableau Desktop or Tableau Cloud | Vendor-hosted platform |
| Setup time | Open PBIX, review model, connect data | Build workbook and calculations | Implementation and configuration |
| Real-time team collaboration | Available through Power BI Service | Available through Tableau Cloud | Usually included by user role |
| Mobile access | Available through Power BI apps after publishing | Available through Tableau apps | Depends on vendor plan |
| Customizable fields | Editable fields, measures, visuals, and model | Editable with Tableau skills | Often limited by product settings |
| Share with link | Available with Power BI sharing permissions | Available with Tableau sharing permissions | Usually login controlled |
| Year-1 cost at 5 users | Template cost plus Power BI access | Software plus build effort | Often much higher with licenses |
| RPA analytics fit | Best for reusable reporting and executive review | Best for teams standardized on Tableau | Best for live orchestration and enterprise monitoring |
Who Should Use This Template
This dashboard is useful for RPA program managers, IT operations leaders, automation center-of-excellence teams, shared services departments, business transformation analysts, finance operations teams, process owners, and consultants. It is especially useful when your team exports automation data from tools such as UiPath, Automation Anywhere, Power Automate, Blue Prism, custom bots, or service logs and wants a repeatable Power BI report.
Real-World Use Cases
Anika, RPA Program Manager: uses the Overview and Automation Trend pages before monthly governance meetings to explain transaction volume, success rate, failed transactions, and hours saved.
Rohit, Automation Support Lead: uses the Bot Performance page to find high-error platforms, bot types, process owners, and processes that need support attention.
Meera, Finance Transformation Analyst: uses Cost Analysis to compare total cost, cost per transaction, ROI proxy, regional cost, and break-even results by process.
Advantages of Robotics Process Automation Dashboard in Power BI
The main advantage is that the dashboard brings business, technical, and cost metrics together in one report. Instead of reviewing separate spreadsheets for transactions, errors, departments, and cost, users can filter the same Power BI report and move from executive overview to detailed performance analysis.
Another advantage is customization. Because this is a Power BI file, users can adjust measures, visuals, fields, slicers, report themes, and data connections. This makes the template useful as a starting point for internal RPA reporting instead of a locked reporting product.
Opportunities for Improvement
This dashboard is not a live bot control room. It does not start bots, stop bots, manage queues, or replace a native RPA orchestrator. Teams that need real-time incident handling, role-based workflow approvals, or process mining should use this dashboard as a reporting layer alongside their operational tools.
Users should also validate the data model before using the report for executive decisions. Field names, cost logic, bot type definitions, and ROI assumptions should match your internal RPA reporting standards.
Best Practices
- Keep consistent process names, department names, bot types, platform names, and status values in the source data.
- Define success rate, failure rate, cost per transaction, and proxy ROI clearly before leadership reporting.
- Review failed transactions by process owner and bot type before making automation investment decisions.
- Use monthly and quarterly trend pages to separate temporary spikes from long-term performance changes.
- Publish to Power BI Service only after checking data privacy, sharing permissions, and refresh settings.
For Power BI publishing, sharing, and service concepts, you can also review the official Microsoft Power BI documentation.
Explore Relevant Templates
- Robotics Process Automation Dashboard in Power BI
- Robotics Process Automation Dashboard in Excel
- Robotics Industry KPI Dashboard in Power BI
- Power BI Templates
Frequently Asked Questions
What is the Robotics Process Automation Dashboard in Power BI?
It is a Power BI dashboard template for tracking RPA transactions, success rate, manual hours saved, cost, bot performance, department results, and ROI indicators.
Can I use my own RPA data?
Yes. You can replace or connect your own RPA source data in Power BI Desktop, then refresh the dashboard.
Does the dashboard run bots?
No. It is a reporting and analytics dashboard. It does not run bots, manage queues, or control automation workflows.
Which Power BI tool do I need?
You need Power BI Desktop to open and edit the PBIX file. You can publish to Power BI Service if you have the right account and permissions.
Can I customize the visuals?
Yes. You can edit visuals, measures, colors, slicers, pages, fields, and data connections.
Who is this dashboard best for?
It is best for RPA managers, IT leaders, automation support teams, process owners, finance transformation analysts, and consultants.
About the Author
Built by PK – Microsoft Certified Professional with 15+ years of Excel, Google Sheets, and Power BI experience. Founder of NextGenTemplates, reaching 300K+ subscribers across YouTube channels. Every template is hand-built and tested before release.
Conclusion
The Robotics Process Automation Dashboard in Power BI gives automation teams a structured way to explain RPA volume, reliability, savings, cost, bot performance, process performance, and ROI. It is practical for recurring reporting, flexible enough for customization, and useful for teams that want a Power BI reporting layer without building every page from scratch.
Visit our YouTube channel for step-by-step tutorials: Youtube.com/@PKAnExcelExpert