
Risk assessment firms often manage dozens of client assessments, findings, remediation estimates, completion updates, and compliance standards at the same time. Even a small firm handling 25 clients, 5 industries, 4 risk levels, and monthly follow-ups can create hundreds of records in a year. The Risk Assessment Firms Dashboard in Excel turns those records into a ready reporting workbook for assessment fees, remediation cost, findings, critical findings, risk scores, assessment volume, firm delivery, and compliance performance.
Click here to purchase the Risk Assessment Firms Dashboard in Excel
This Excel dashboard is designed for consulting firms, GRC teams, internal audit departments, cyber risk reviewers, client delivery managers, and compliance analysts who need practical reporting without building pivot tables, slicers, cards, and charts from a blank workbook. Users can replace the sample records in the Data Sheet, click Refresh All from the Excel Data ribbon, and review the updated dashboard pages quickly.
Key Features of Risk Assessment Firms Dashboard in Excel
- 5 dashboard pages: Overview, Client Risk, Industry Trends, Firm Delivery, and Compliance.
- 5 high-level KPI cards: Total Assessment Fee, Total Remediation Cost, Total Findings, Critical Finding Count, and Total Assessments.
- Multiple slicers: Filter dashboard views by client, industry, region, risk firm, assessment type, compliance standard, priority, risk level, status, and time period.
- Fee and remediation analysis: Compare assessment fee and remediation cost by month, industry, risk level, region, and client.
- Risk score visibility: Analyze average risk score by industry, region, and assessment type.
- Firm delivery tracking: Review satisfaction score, assessment status, completion percentage, and findings by compliance standard.
- Data and support sheets: Add raw records, refresh pivot-backed visuals, and keep the support pivots hidden if needed.
Dashboard Pages Explanation
1. Overview Page
Risk Assessment Firms Dashboard in Excel
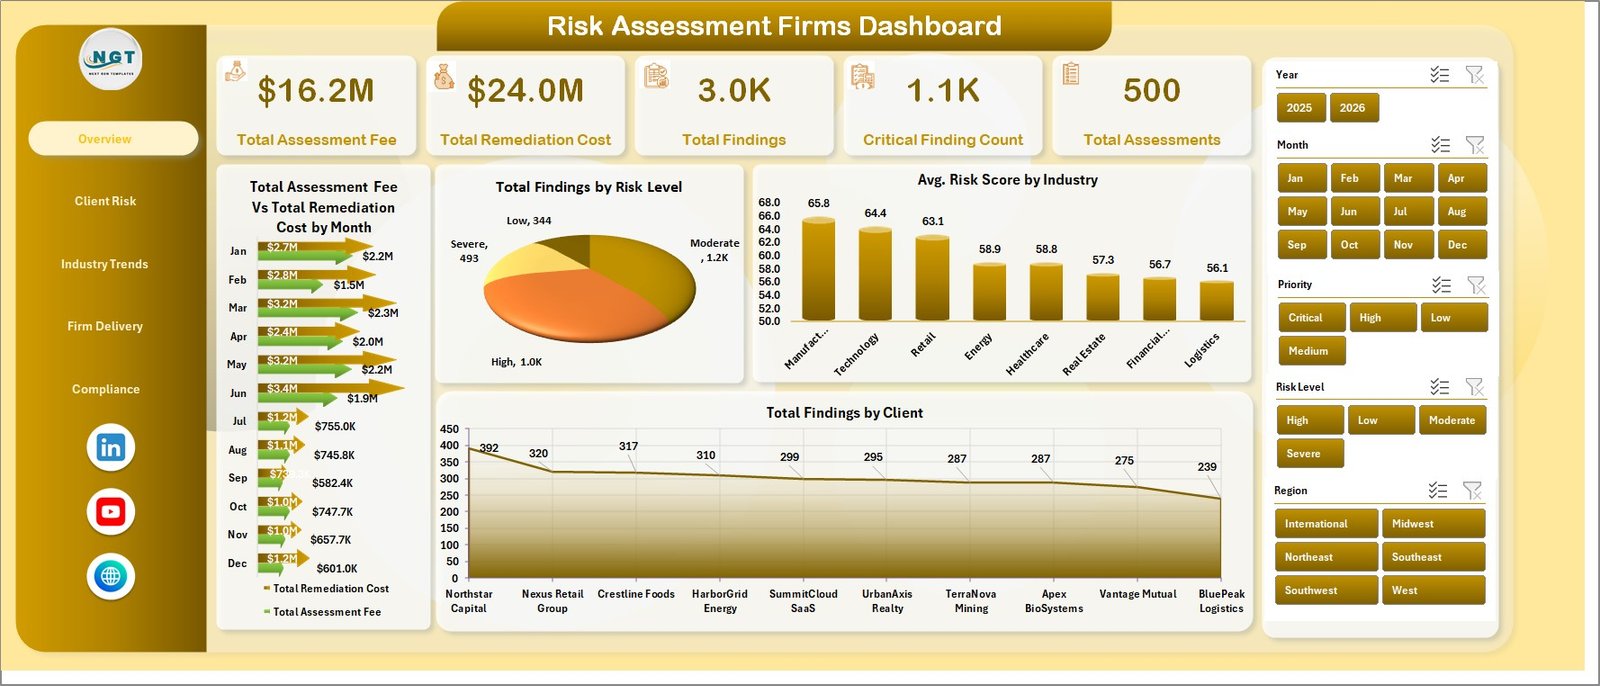
The Overview page is the executive summary of the workbook. It shows Total Assessment Fee, Total Remediation Cost, Total Findings, Critical Finding Count, and Total Assessments at the top, with charts and slicers underneath for fast filtering.
Total Assessment Fee Vs Total Remediation Cost by Month
This chart compares billed assessment work with expected remediation cost month by month. It helps firms see whether remediation exposure is increasing faster than assessment fee volume.
Total Findings by Risk Level
This chart groups findings by risk level. It helps teams understand whether issues are mostly low priority or whether high and critical findings require immediate attention.
Avg. Risk Score by Industry
This visual compares risk score across industries. It helps consultants identify industries where control maturity may be weaker or where additional assessment depth is needed.
Total Findings by Client
This chart ranks clients by total findings. It supports account reviews, remediation planning, and prioritization for follow-up meetings.
2. Client Risk
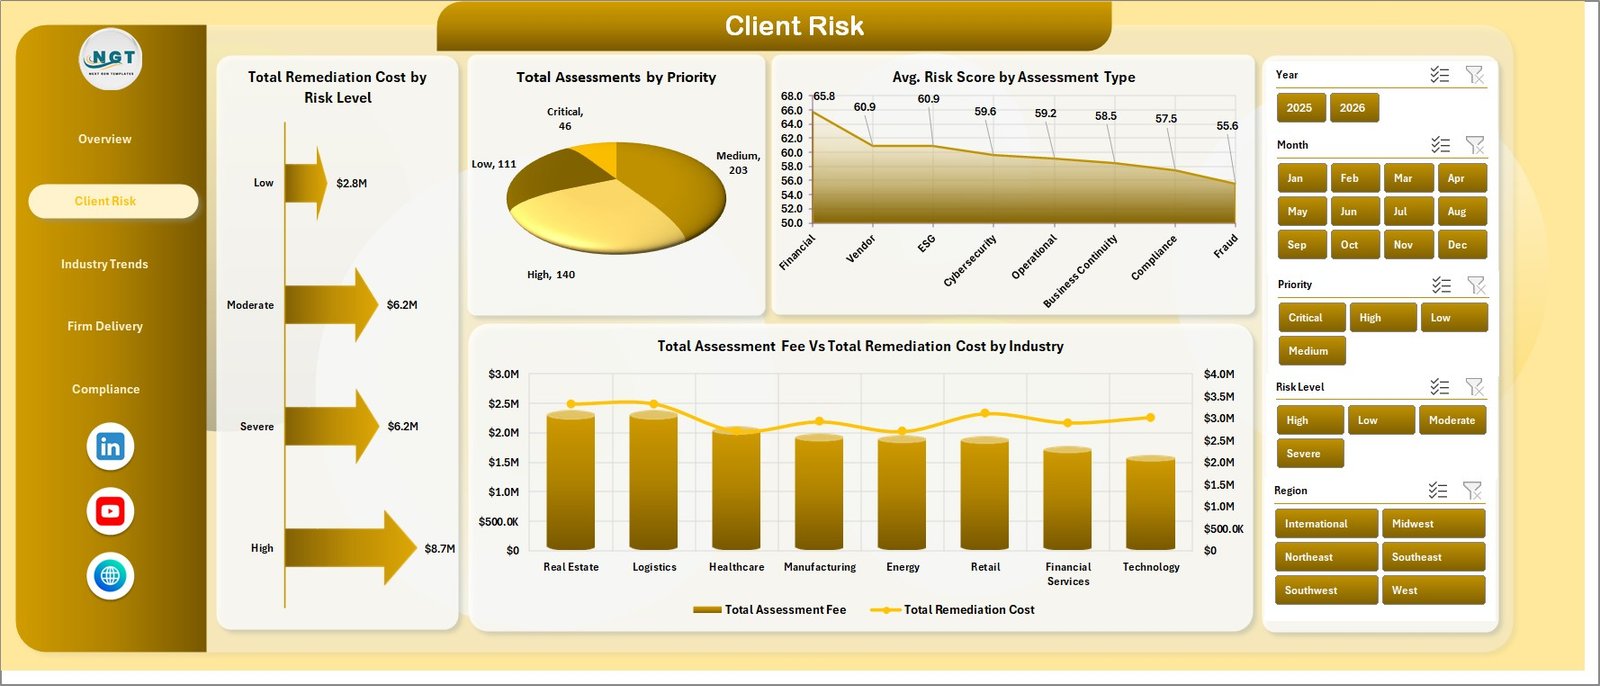
The Client Risk tab focuses on exposure at the client and priority level. It is useful when teams need to explain where remediation cost is concentrated and which assessment types are creating higher risk scores.
Total Remediation Cost by Risk Level shows how remediation spend is distributed across risk levels. It helps users estimate whether critical and high risks are driving the bulk of follow-up cost.
Total Assessments by Priority groups assessments by priority. It gives leaders a quick view of workload urgency.
Avg. Risk Score by Assessment Type compares score patterns across assessment categories. This helps firms understand which services reveal deeper risk.
Total Assessment Fee Vs Total Remediation Cost by Industry compares revenue and estimated remediation cost by industry. It helps explain whether certain industries create larger downstream remediation obligations.
Client Risk
3. Industry Trends
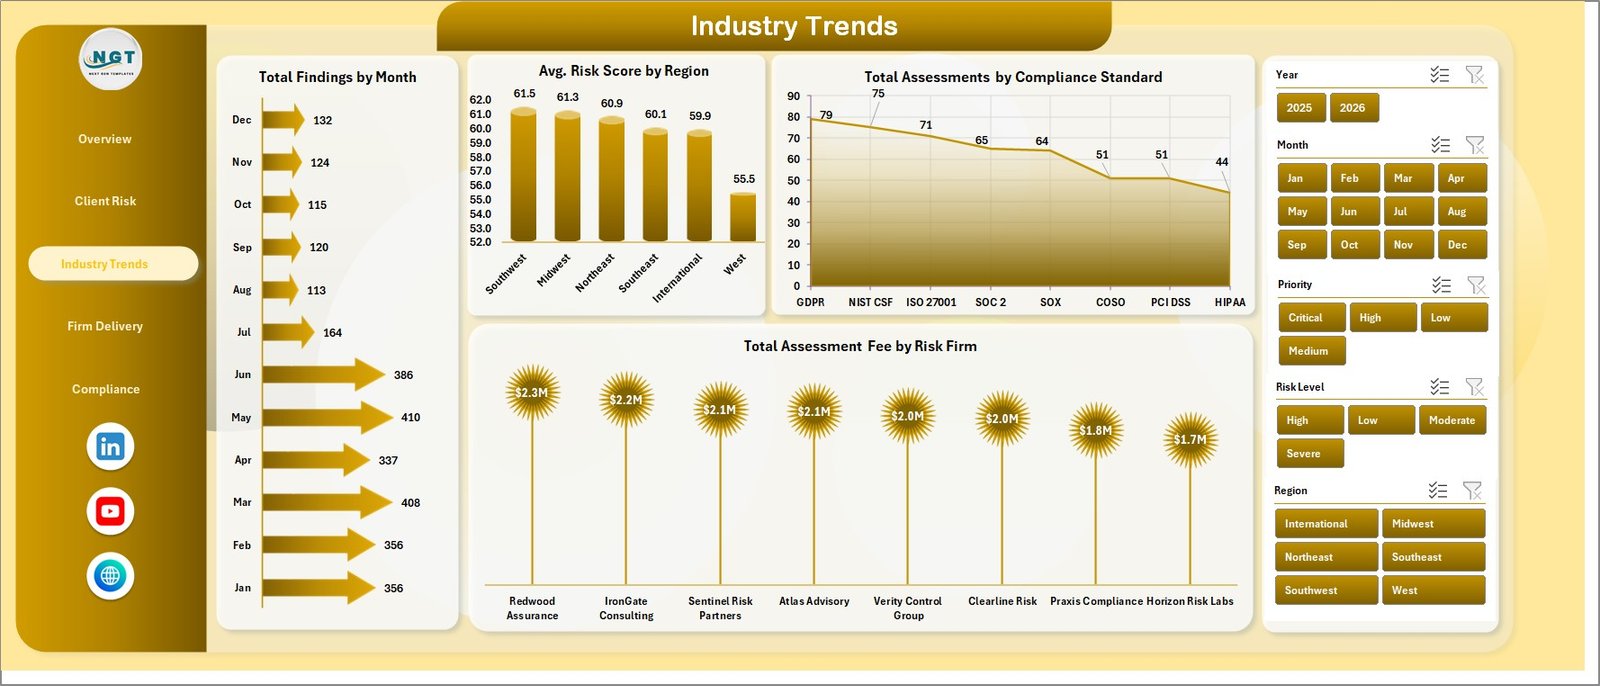
The Industry Trends tab helps users understand how risk work changes by month, region, standard, and firm. It is practical for market reviews, service line analysis, and recurring management meetings.
Total Findings by Month tracks finding volume over time. It helps identify busy periods, recurring spikes, or improvement after remediation programs.
Avg. Risk Score by Region compares regional risk levels. It helps leadership focus attention where risk score is consistently higher.
Total Assessments by Compliance Standard shows assessment volume by framework or standard. It helps firms see which standards are driving work.
Total Assessment Fee by Risk Firm compares fee volume across firms. It supports partner, vendor, or internal delivery reviews.
Industry Trends
4. Firm Delivery
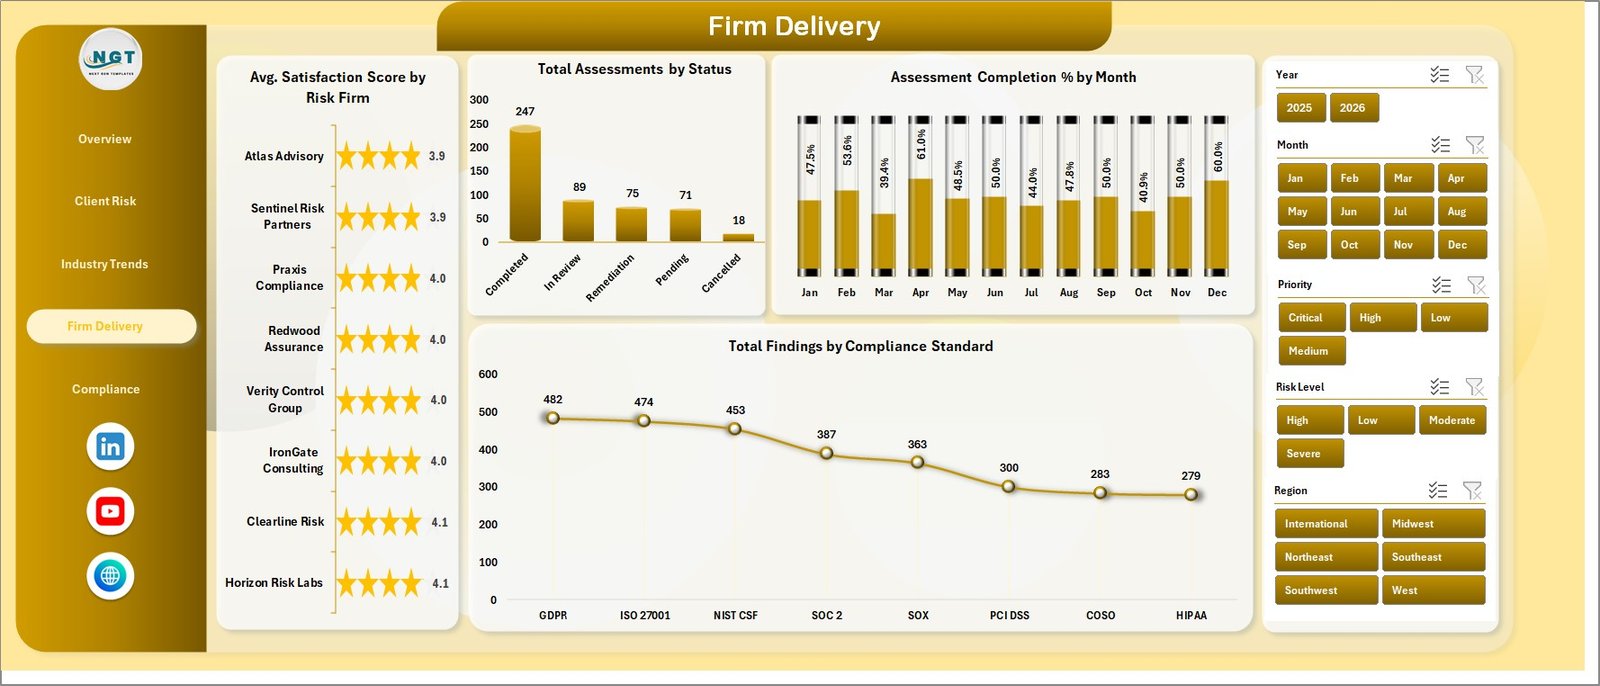
The Firm Delivery tab connects delivery performance with client outcomes. It is useful for quality reviews where satisfaction, status, completion, and findings must be seen together.
Avg. Satisfaction Score by Risk Firm compares client satisfaction across firms. It helps identify delivery teams that are meeting expectations and those that may need coaching.
Total Assessments by Status shows how many assessments are open, completed, delayed, or otherwise classified. This gives managers a quick workload status view.
Assessment Completion % by Month tracks monthly completion performance. It helps delivery leads understand whether throughput is improving or slowing down.
Total Findings by Compliance Standard connects findings to compliance frameworks. It helps teams see which standards produce the most issues.
Firm Delivery
5. Compliance
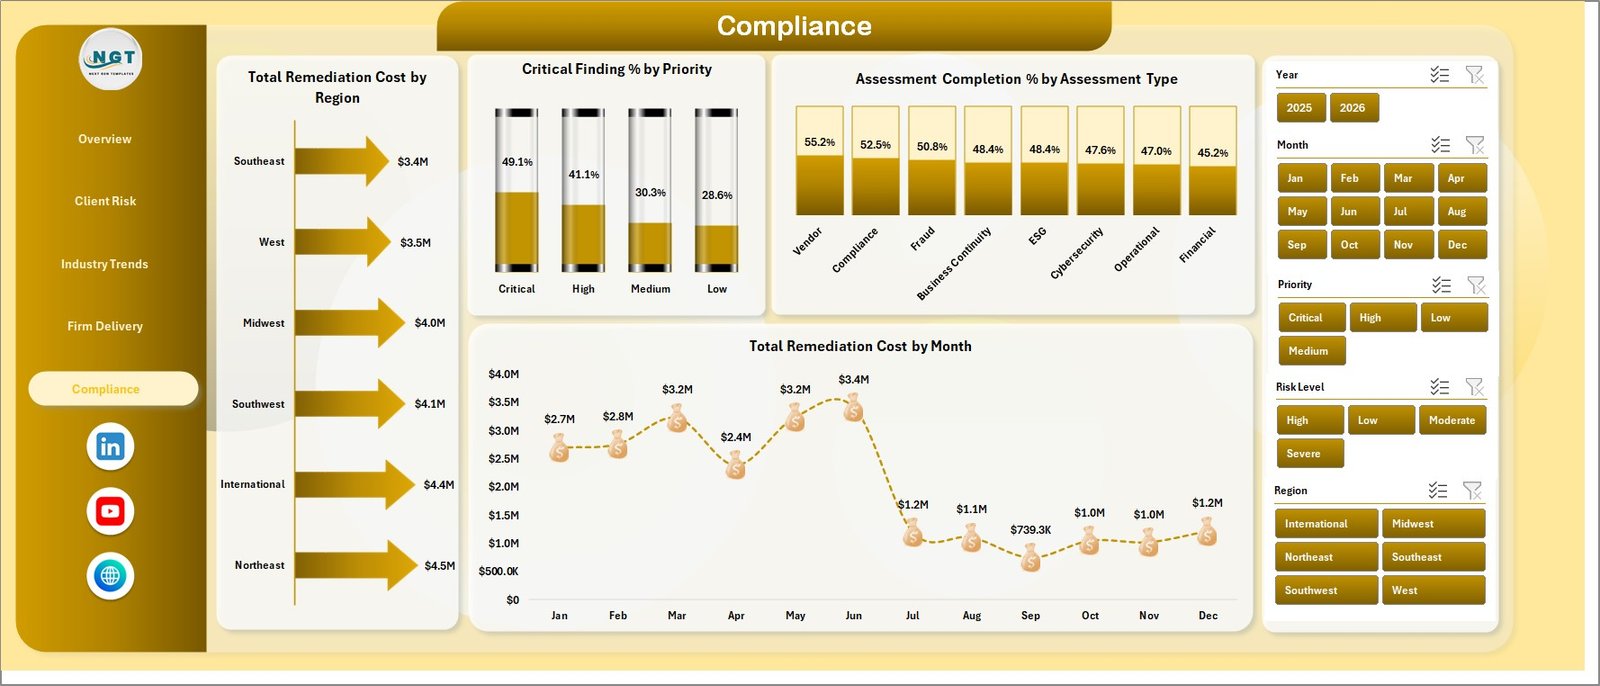
The Compliance tab focuses on remediation cost, critical finding percentage, and completion performance. It is a strong page for compliance follow-ups, steering meetings, and quarterly client reviews.
Total Remediation Cost by Region compares remediation cost across locations. It helps teams identify where financial exposure is highest.
Critical Finding % by Priority shows the percentage of critical findings by priority group. It helps teams validate whether priority rules are aligned with severity.
Assessment Completion % by Assessment Type compares completion performance by assessment type. It helps delivery teams identify services that take longer to finish.
Total Remediation Cost by Month tracks remediation cost over time. It helps finance, risk, and client teams understand whether follow-up exposure is increasing or decreasing.
Compliance
6. Data Sheet Tab
The Data Sheet is where users add assessment records in the same format as the sample data. Keeping the same column structure helps the pivot tables, slicers, KPI cards, and charts refresh correctly.

Data Sheet tab
7. Support Sheet
The Support Sheet contains the pivot tables used to create the dashboard dynamically. After updating the Data Sheet, go to the Excel Data ribbon and click Refresh All. All pivots and charts refresh together. You can keep this sheet hidden before sharing the workbook with regular users.

Support sheet tab
Risk Assessment Firms Dashboard in Excel vs. Google Sheets vs. Paid GRC SaaS – Feature Comparison
| Feature | This Excel Dashboard | Google Sheets Alternative | Paid GRC SaaS |
|---|---|---|---|
| Cost | $17.99 one-time sale price | Low software cost but manual build required | Recurring subscription and implementation fees |
| Platform | Microsoft Excel | Google Sheets | Vendor-hosted cloud platform |
| Setup time | Download, update data, refresh | Build pivots, formulas, charts, and filters manually | Configure workflows, roles, fields, and integrations |
| Real-time team collaboration | Available through OneDrive or SharePoint workflows | Native collaboration | Usually included |
| Mobile access | Limited through Excel mobile | Strong mobile access | Usually included |
| Customizable fields | Fully editable workbook | Editable when built manually | Limited by plan and admin permissions |
| Share with link | Possible through Microsoft 365 sharing | Native sharing | Role-based access |
| Year-1 cost at 5 users | Template cost plus Excel access | Workspace cost plus build time | Often hundreds or thousands per year |
| Assessment reporting fit | Best for Excel-based fee, findings, remediation, and delivery reporting | Best for lightweight shared trackers | Best for approvals, audit trails, and evidence workflows |
Who Should Use This Template
This template is useful for risk assessment firms, GRC consultants, internal audit teams, compliance analysts, cyber risk teams, advisory firms, client success managers, and operations leaders who need a practical Excel dashboard for recurring assessment reviews.
It is also useful when your organization already has assessment data in a spreadsheet or can export data from another system. The dashboard can become the reporting layer used in client updates, risk committee meetings, remediation reviews, and monthly performance reports.
Real-World Use Cases
Aditi is a risk consulting manager. She exports assessment data each month, pastes it into the Data Sheet, refreshes the workbook, and opens the Overview page before client meetings. The fee, remediation cost, findings, and critical finding cards help her brief stakeholders quickly.
Marcus manages GRC reporting for a financial services firm. He uses Avg. Risk Score by Industry, Avg. Risk Score by Region, and Total Findings by Risk Level to decide which business areas need stronger remediation planning.
Priya leads delivery for a boutique risk advisory firm. She uses Firm Delivery to compare satisfaction scores, completion percentage, assessment status, and findings by compliance standard across multiple delivery teams.
Advantages of Risk Assessment Firms Dashboard in Excel
It keeps reporting in a familiar tool. Many consulting and compliance teams already work in Excel, so the workbook fits into existing client reporting workflows.
It separates data entry from reporting. Users update the Data Sheet, while pivot tables and dashboard pages handle reporting. This reduces manual chart rebuilding.
It makes remediation easier to prioritize. Risk level, priority, remediation cost, critical finding percentage, and risk score appear in focused views so teams can act on high-impact areas first.
It is easy to adapt. Excel users can rename fields, change charts, adjust colors, add slicers, and customize formulas if their internal reporting standard requires it.
Opportunities for Improvement
No dashboard is a full GRC operating system. This workbook does not enforce approvals, collect evidence files, send automated reminders, maintain immutable audit trails, or provide role-based workflow controls. If those features are required, use this dashboard as a management reporting layer rather than the official system of record.
The dashboard also depends on clean source data. If client names, industry labels, risk levels, regions, or compliance standards are inconsistent, the charts will reflect that inconsistency. A quick data cleanup step before refresh will make the dashboard more reliable.
Best Practices
- Keep dropdown values standardized for risk level, priority, status, region, industry, and compliance standard.
- Refresh all pivots after every data update from the Excel Data ribbon.
- Keep the Support Sheet hidden for normal users so pivot tables are not edited accidentally.
- Review remediation cost and findings count separately because a small number of findings can still carry high cost.
- Use monthly views to detect rising remediation exposure before it becomes a client escalation.
- For Excel data consistency, review Microsoft guidance on data validation in Excel.
Explore Relevant Templates
- Risk Management Dashboard in Power BI
- Customer Service and Support Risk Management KPI Dashboard
- Audit Findings and CAPA Data Entry System in Excel
- Excel Dashboard Templates
Frequently Asked Questions
What is the Risk Assessment Firms Dashboard in Excel?
It is a multi-tab Excel dashboard for tracking assessment fees, remediation cost, findings, critical findings, risk score, priority, assessment status, firm delivery, and compliance performance.
How many sheets are included?
The workbook includes 7 worksheet tabs: Overview, Client Risk, Industry Trends, Firm Delivery, Compliance, Data, and Support.
Can I use my own data?
Yes. Add your records to the Data Sheet using the same format as the template, then refresh all pivots and charts.
How do I refresh the dashboard?
After updating the Data Sheet, go to the Excel Data ribbon and click Refresh All. This refreshes the pivot tables on the Support Sheet and updates the dashboard charts.
Can I hide the Support Sheet?
Yes. The Support Sheet contains pivot tables used by the dashboard, and it can be hidden after setup.
Does this replace GRC software?
No. It is an Excel reporting dashboard. It does not replace GRC platforms that handle approvals, evidence, role security, audit trails, or regulatory filing.
About the Author
Built by PK – Microsoft Certified Professional with 15+ years of Excel, Google Sheets, and Power BI experience. Founder of NextGenTemplates, reaching 300K+ subscribers across YouTube channels. Every template is hand-built and tested before release.
Conclusion
The Risk Assessment Firms Dashboard in Excel is a practical way to review assessment fees, remediation cost, findings, risk score, firm delivery, completion, and compliance performance without building a dashboard from scratch. It gives risk teams a structured Excel reporting layer for client reviews, internal delivery meetings, and recurring risk analysis.
Click here to purchase the Risk Assessment Firms Dashboard in Excel
Instant download. One-time payment. No subscription.
For step-by-step Excel dashboard and reporting tutorials, visit Youtube.com/@PK-AnExcelExpert.
Last updated: August 5, 2026


