ESG Environmental Dashboard in Power BI — Track Carbon Emissions, Water Usage, Waste, and Compliance in One Place
ESG Environmental Dashboard in Power BI is a professionally designed, ready-to-use interactive Power BI template that empowers sustainability teams, ESG analysts, environmental compliance officers, and corporate reporting professionals to track, analyze, and visualize critical environmental metrics across facilities, regions, and industry sectors. This dashboard consolidates carbon emissions data, water usage volumes, energy consumption patterns, waste generation metrics, and regulatory compliance scores into 5 interactive pages — delivering actionable insights for data-driven ESG decision-making.
As environmental regulations tighten globally and stakeholders demand greater transparency, organizations need robust tools to measure their environmental footprint. Tracking metrics like total carbon emissions by emission source, renewable energy rates by region, and compliance scores by industry sector requires a centralized, visual reporting platform. The ESG Environmental Dashboard in Power BI provides exactly that — combining dynamic charts, KPI cards, and interactive slicers into a single .pbix file that works instantly in Power BI Desktop (free from Microsoft).

👉 Click here to Purchase ESG Environmental Dashboard in Power BI
Key Features of ESG Environmental Dashboard in Power BI
This template includes 5 interactive dashboard pages with a total of 5 KPI cards and 15+ dynamic charts that cover every critical dimension of ESG environmental reporting. Each page is equipped with multiple slicers for instant filtering by region, facility, industry sector, emission source, and time period. The dashboard tracks Avg Compliance Score, Total Water Usage, Renewable Energy Rate, Total Waste Generated, and Total Carbon Emissions — giving you complete visibility into your organization’s environmental performance.
Key capabilities include cross-facility emissions benchmarking, month-over-month carbon trend analysis, regional water consumption comparisons, facility-level waste tracking, and sector-wide compliance scoring. Whether you’re preparing for an annual sustainability report, conducting an internal ESG audit, or presenting environmental KPIs to the board, this Power BI template has you covered. For a similar solution in spreadsheet format, explore the ESG Environmental Dashboard in Excel.
Dashboard Pages Explanation
Page 1 — Overview
The Overview page serves as the central hub of the ESG Environmental Dashboard. At the top, 5 high-level KPI cards display Avg Compliance Score, Total Water Usage, Renewable Energy Rate, Total Waste Generated, and Total Carbon Emissions — providing an instant snapshot of your organization’s environmental health. Below the cards, dynamic charts visualize Total Energy Consumption and Total Renewable Energy by Region, Total Carbon Emissions by Emission Source, Total Carbon Emissions by Facility Name, and Total Carbon Emissions by Month Name. Multiple slicers are positioned for quick filtering, allowing users to slice data by any dimension and see the entire page update in real time.
ESG Environmental Dashboard in Power BI
Page 2 — Emissions Analysis
The Emissions Analysis page provides a deep dive into carbon emission patterns across your organization. This page features Total Energy Consumption and Total Carbon Emissions by Industry Sector for cross-sector benchmarking, Total Energy Consumption and Total Renewable Energy by Facility Name for facility-level comparison, and Total Carbon Emissions by Emission Source to identify which sources contribute the most to your carbon footprint. This page is essential for sustainability managers who need to pinpoint emission hotspots and develop targeted reduction strategies.
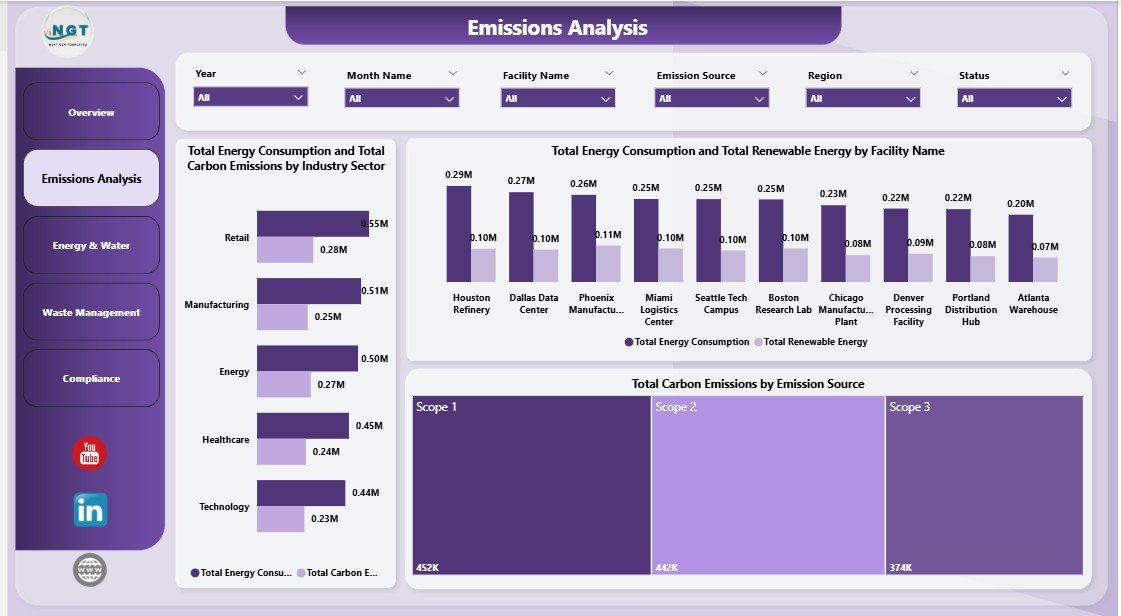
Emissions Analysis
Page 3 — Energy & Water
The Energy & Water page focuses on resource consumption analytics. Charts display Total Water Usage by Region and Total Water Usage by Industry Sector — enabling organizations to compare water consumption patterns across geographies and business segments. Additionally, Total Waste Generated by Facility Name helps identify which facilities produce the most waste, supporting targeted waste reduction initiatives. This page is critical for operations teams working to optimize resource efficiency and reduce environmental impact.
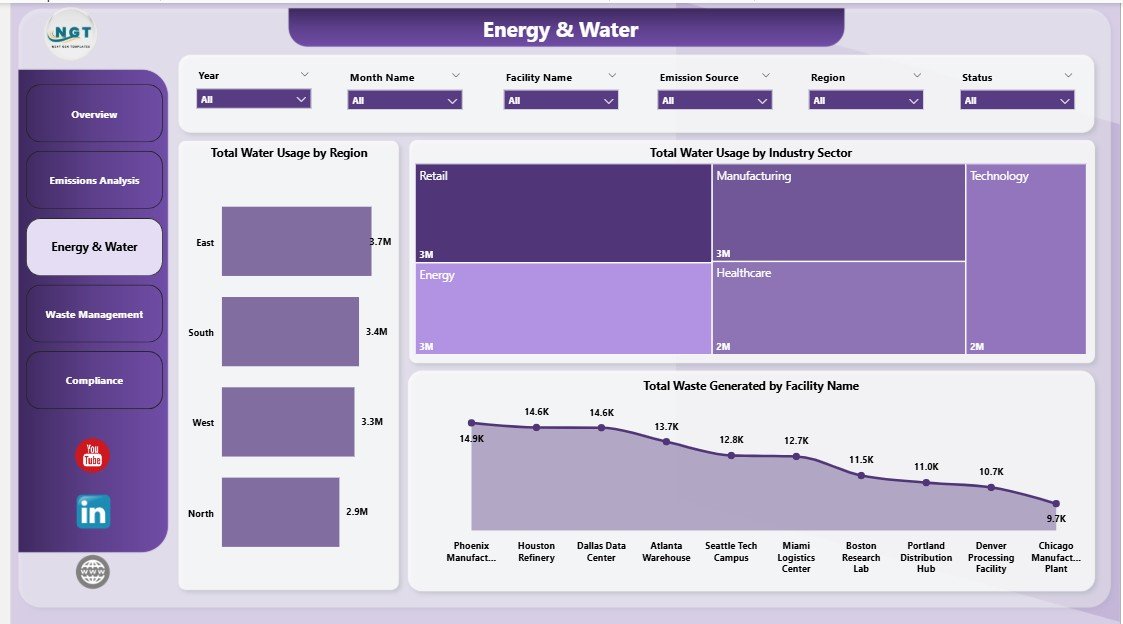
Energy & Water
Page 4 — Waste Management
The Waste Management page delivers focused analysis on sustainability and waste metrics. Renewable Energy Rate by Region shows how different regions compare in renewable energy adoption. Avg Compliance Score by Facility Name highlights which facilities are leading or lagging in environmental compliance. Total Water Usage by Month Name reveals seasonal water consumption trends. Together, these visuals provide the insight needed to drive sustainability improvements and meet corporate ESG targets.
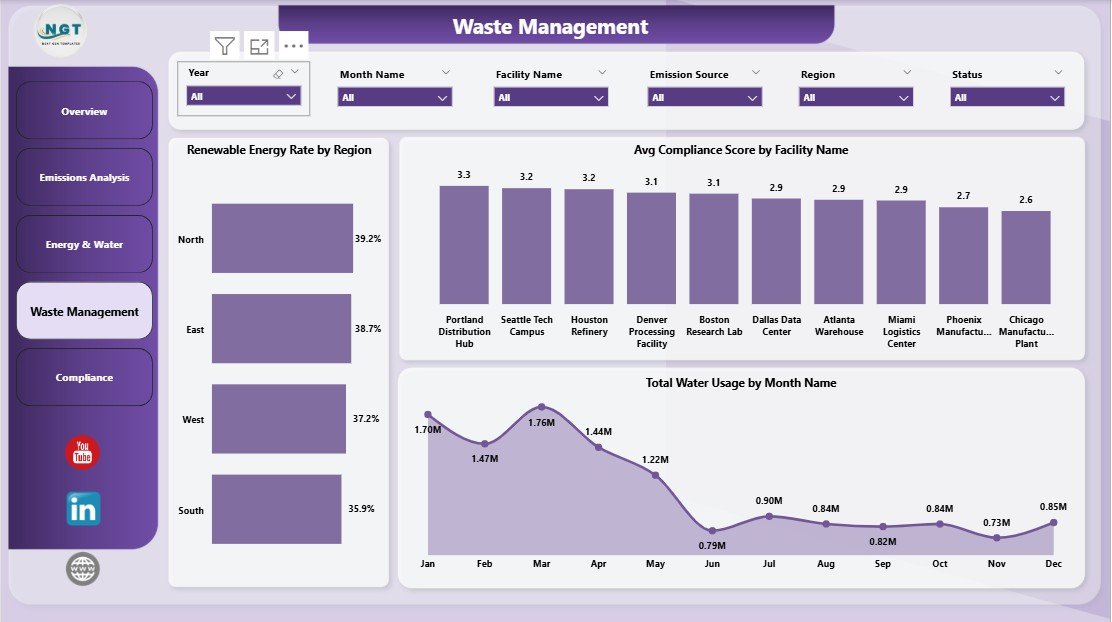
Waste Management
Page 5 — Compliance
The Compliance page provides a comprehensive view of regulatory adherence across your organization. Avg Compliance Score by Region enables geographic compliance benchmarking, while Avg Compliance Score by Industry Sector reveals which business segments need attention. Total Water Usage by Status tracks water consumption against compliance thresholds. This page is essential for compliance officers preparing for environmental audits, regulatory submissions, and stakeholder reporting.
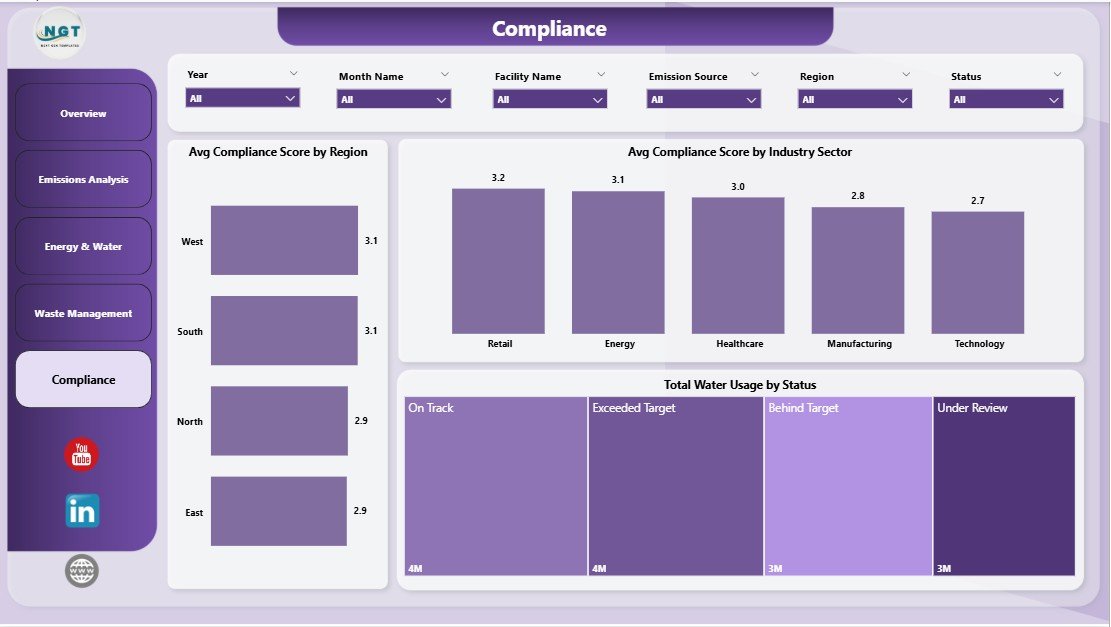
Compliance
Advantages of ESG Environmental Dashboard in Power BI
- Centralized ESG Reporting — All critical environmental metrics in one interactive dashboard, eliminating the need for multiple spreadsheets and manual reports.
- Real-Time Filtering — Interactive slicers on every page allow instant drill-down by region, facility, sector, and time period.
- Executive-Ready Visuals — Clean, professional design suitable for board presentations, investor reporting, and stakeholder communications.
- Zero Coding Required — Open the .pbix file in Power BI Desktop, replace sample data, and all visuals update automatically. No DAX or Power Query knowledge needed.
- Scalable Architecture — Easily extend with additional pages, measures, or data sources as your ESG reporting needs grow.
- Cross-Platform Sharing — Publish to Power BI Service for team collaboration, scheduled data refresh, and mobile access via the Power BI app.
Opportunities for Improvement
- Scope 1/2/3 Breakdown — Adding emission scope classification would enhance GHG Protocol alignment and make the dashboard more useful for formal carbon accounting.
- Target vs. Actual Comparison — Including target benchmarks alongside actual values would allow organizations to track progress against sustainability goals.
- Time Series Forecasting — Incorporating Power BI’s built-in forecasting capabilities could help predict future emissions and resource consumption trends.
- Drill-Through Pages — Adding drill-through functionality from summary charts to detailed data tables would enhance analytical depth.
- Automated Data Refresh — Connecting to live data sources via Power BI Gateway would enable real-time or scheduled automated updates.
Best Practices for Using This ESG Dashboard
- Start with the Overview — Use the KPI cards to identify areas of concern before drilling into specific pages for deeper analysis.
- Use Slicers Strategically — Filter by individual facilities or regions to compare performance and identify improvement opportunities.
- Update Data Monthly — For the most accurate insights, refresh your environmental data on a monthly cycle and re-publish to Power BI Service.
- Combine with Other ESG Dimensions — Pair this environmental dashboard with social and governance templates for a complete ESG reporting framework.
- Export for Reporting — Use Power BI’s export features to generate PDF snapshots of each page for inclusion in annual sustainability reports.
Explore Relevant Templates
If you found this ESG Environmental Dashboard in Power BI useful, check out these related templates from our Power BI Dashboard collection:
- ESG Environmental Dashboard in Excel — Track the same environmental KPIs using Microsoft Excel with interactive pivot charts and dashboard layouts.
- Startup Burn Rate Dashboard in Power BI — Monitor financial health metrics for startups with cash runway, burn rate, and expense tracking.
- Agriculture and Farm Dashboard in Power BI — Analyze agricultural operations including crop yields, costs, and farm performance metrics.
- ESG Environmental Dashboard in Excel — Blog Post — Read the detailed walkthrough of the Excel version of this ESG dashboard.
- Startup Burn Rate Dashboard in Power BI — Blog Post — Explore financial analytics for startups using Power BI.
Frequently Asked Questions
What is the best Power BI template for ESG environmental tracking?
The ESG Environmental Dashboard in Power BI is one of the most comprehensive templates available for ESG environmental tracking. It includes 5 interactive pages covering carbon emissions, water usage, energy consumption, waste management, and compliance — all with dynamic KPI cards, charts, and slicer filters for instant data exploration.
How do I track carbon emissions using Power BI?
You can track carbon emissions in Power BI by using a template like the ESG Environmental Dashboard, which provides pre-built visuals for Total Carbon Emissions by Emission Source, by Facility Name, by Month Name, and by Industry Sector. Simply replace the sample data with your organization’s emission records and all charts update automatically.
What KPIs are tracked in this ESG dashboard?
This dashboard tracks 5 core environmental KPIs: Avg Compliance Score, Total Water Usage, Renewable Energy Rate, Total Waste Generated, and Total Carbon Emissions. These are displayed as KPI cards on the Overview page and analyzed across all 5 dashboard pages with breakdowns by region, facility, industry sector, and time period.
Can I customize this Power BI dashboard for my company?
Yes. The .pbix file is fully editable in Power BI Desktop. You can modify chart types, add new pages, create custom DAX measures, adjust colors and themes, and connect your own data sources including SQL databases, Excel files, SharePoint lists, and cloud APIs.
Is this template suitable for ESG compliance reporting and audits?
Absolutely. The dedicated Compliance page tracks Avg Compliance Score by Region and by Industry Sector, along with Total Water Usage by Status. The professional design and structured layout make it ideal for regulatory submissions, environmental audits, and board-level ESG presentations.
Do I need Power BI Pro to use this template?
No. You can open and use the .pbix file entirely in Power BI Desktop, which is free to download from Microsoft. Power BI Pro or Premium is only needed if you want to publish to Power BI Service for team sharing, scheduled refresh, and mobile access.
Conclusion
The ESG Environmental Dashboard in Power BI is a powerful, ready-to-use template designed for organizations serious about tracking and improving their environmental performance. With 5 interactive pages, 5 KPI cards, 15+ dynamic charts, and comprehensive slicer filters, this dashboard delivers everything you need for carbon emissions analysis, water usage tracking, waste management monitoring, and ESG compliance reporting — all in a single Power BI file.
Whether you’re a sustainability manager tracking facility emissions, a compliance officer preparing for an environmental audit, or a corporate reporting team building board-level ESG presentations, this template accelerates your workflow and delivers professional results from day one.
👉 Click here to Purchase ESG Environmental Dashboard in Power BI
🎥 Visit our YouTube channel for step-by-step Power BI tutorials: Youtube.com/@PK-AnExcelExpert