ESG Environmental Dashboard in Excel is a powerful, pivot-driven analytics template that helps organizations track, measure, and report on their environmental sustainability performance. If your company needs to monitor carbon emissions, energy consumption, water usage, waste management, and compliance scores across multiple facilities and regions — this ready-to-use Excel dashboard template transforms complex environmental data into clear, actionable insights without expensive BI software.
Organizations today face growing pressure from regulators, investors, and stakeholders to demonstrate measurable environmental responsibility. However, many ESG teams still rely on disconnected spreadsheets, making it difficult to get a unified view of environmental performance. This dashboard centralizes all your ESG environmental data into one interactive, multi-page analytics hub — powered entirely by Excel pivot tables with zero macros required.
Key Features of ESG Environmental Dashboard in Excel
The ESG Environmental Dashboard in Excel includes 5 interactive analysis pages covering overview KPIs, emissions analysis, energy and water tracking, waste management, and compliance monitoring. Each page is equipped with dynamic slicer filters that allow users to instantly drill down by Emission Source, Facility Name, Industry Sector, Region, and Year.
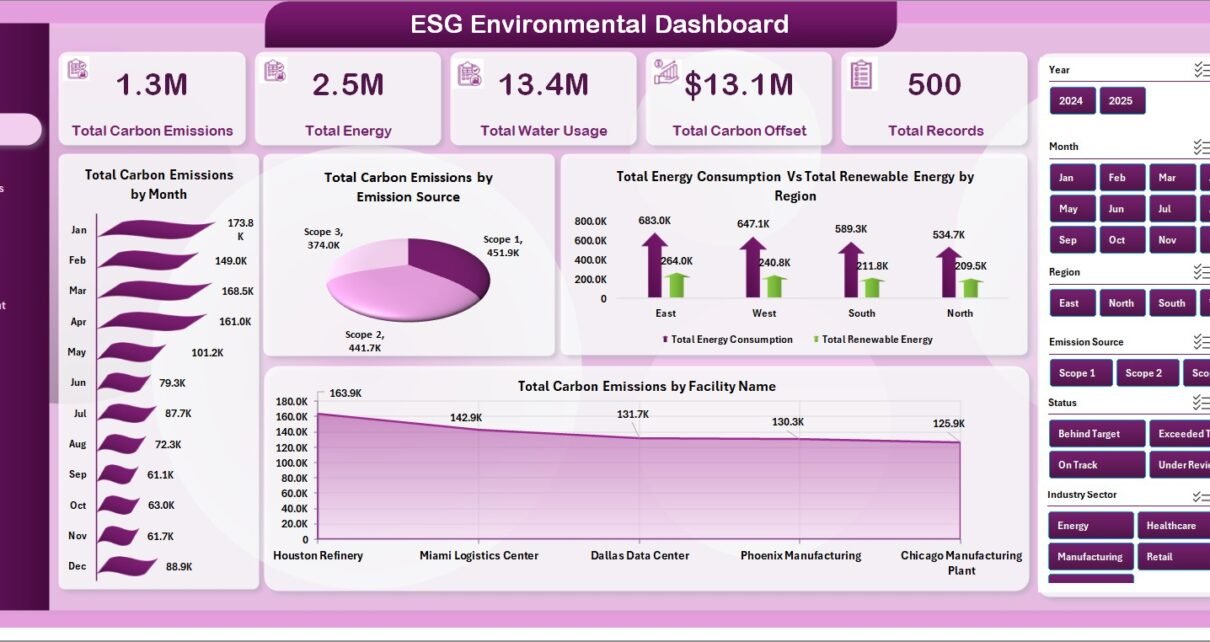
The overview page displays 5 high-level KPI cards — Total Carbon Emissions, Total Energy, Total Water Usage, Total Carbon Offset, and Total Records — alongside 4 interactive charts that visualize carbon emissions by month, by emission source, energy consumption vs renewable energy by region, and carbon emissions by facility name.
All charts and KPI cards are powered by an automated pivot table engine that refreshes with a single click. No macros or VBA are required — the entire dashboard uses native Excel formulas, pivot tables, and conditional formatting, making it compatible with Excel 2016 and later versions.
Dashboard Pages Explained
1 — Overview Page
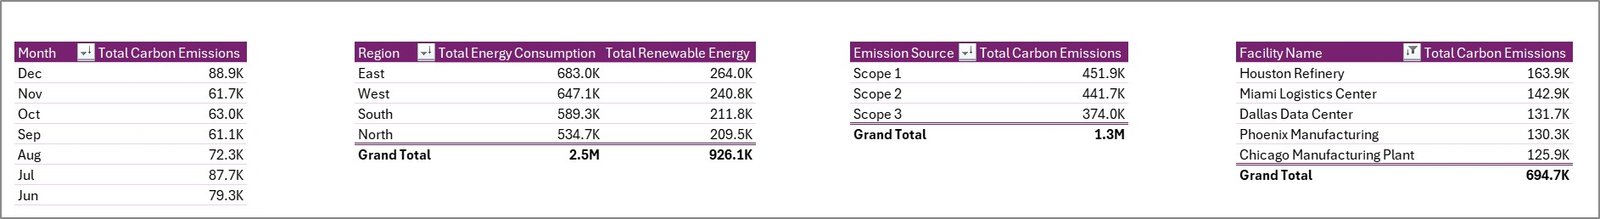
The main dashboard displays high-level KPI cards including Total Carbon Emissions, Total Energy, Total Water Usage, Total Carbon Offset, and Total Records. Multiple interactive charts visualize Total Carbon Emissions by Month, Total Carbon Emissions by Emission Source, Total Energy Consumption Vs Total Renewable Energy by Region, and Total Carbon Emissions by Facility Name — with slicers for instant filtering.
ESG Environmental Dashboard Overview2 — Emissions Analysis
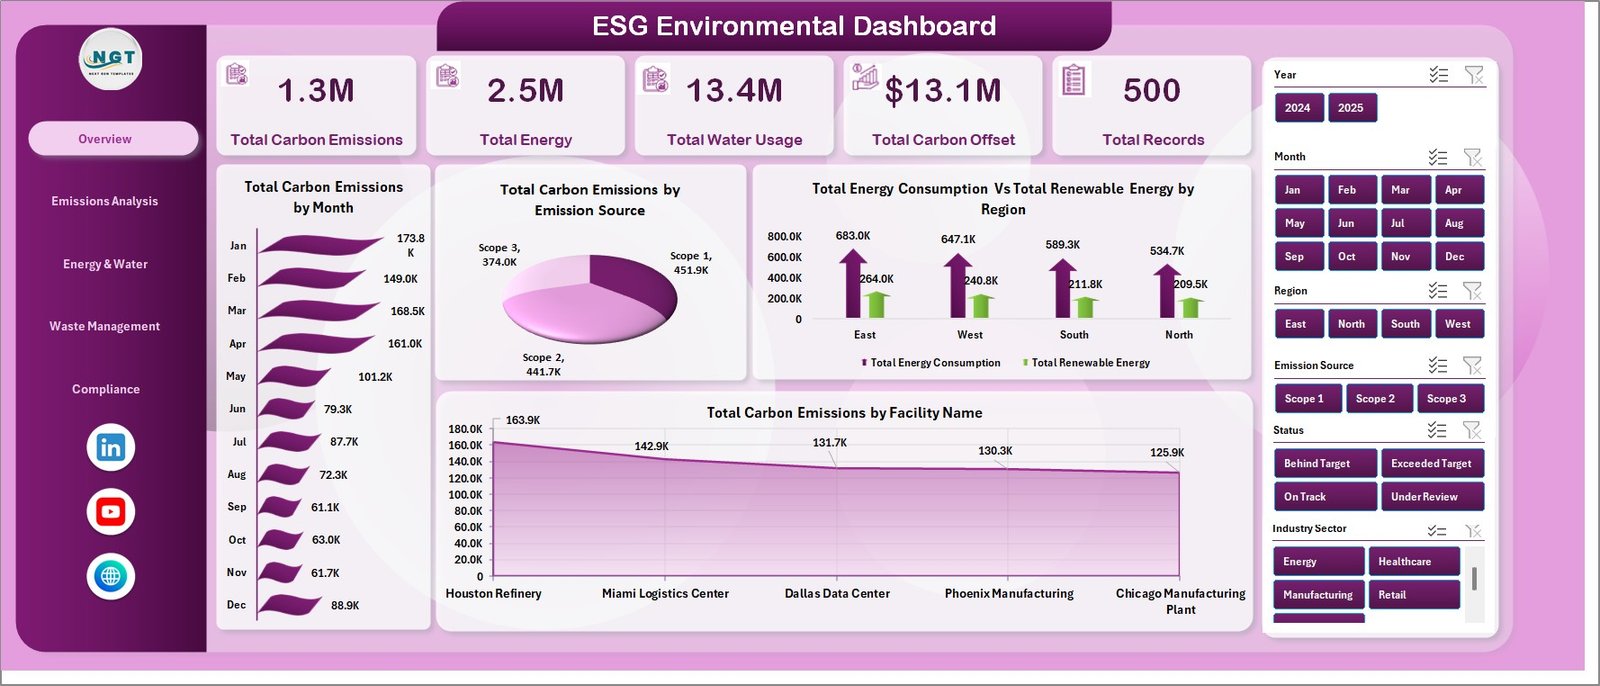
This page provides deep-dive emissions analysis showing Total Carbon Emissions Vs Total Energy Consumption by Industry Sector, Total Carbon Emissions Vs Total Carbon Offset by Year, Total Records by Emission Source, and Total Energy Consumption Vs Total Renewable Energy by Facility Name. These comparative charts help identify which sectors and facilities contribute most to your carbon footprint.
 Emissions Analysis
3 — Energy & Water
Track resource consumption with charts showing Total Water Usage by Region, Total Water Usage by Industry Sector, Total Energy Consumption by Month, and Waste Generated by Facility Name. This page provides complete visibility into energy and water usage patterns across your organization.
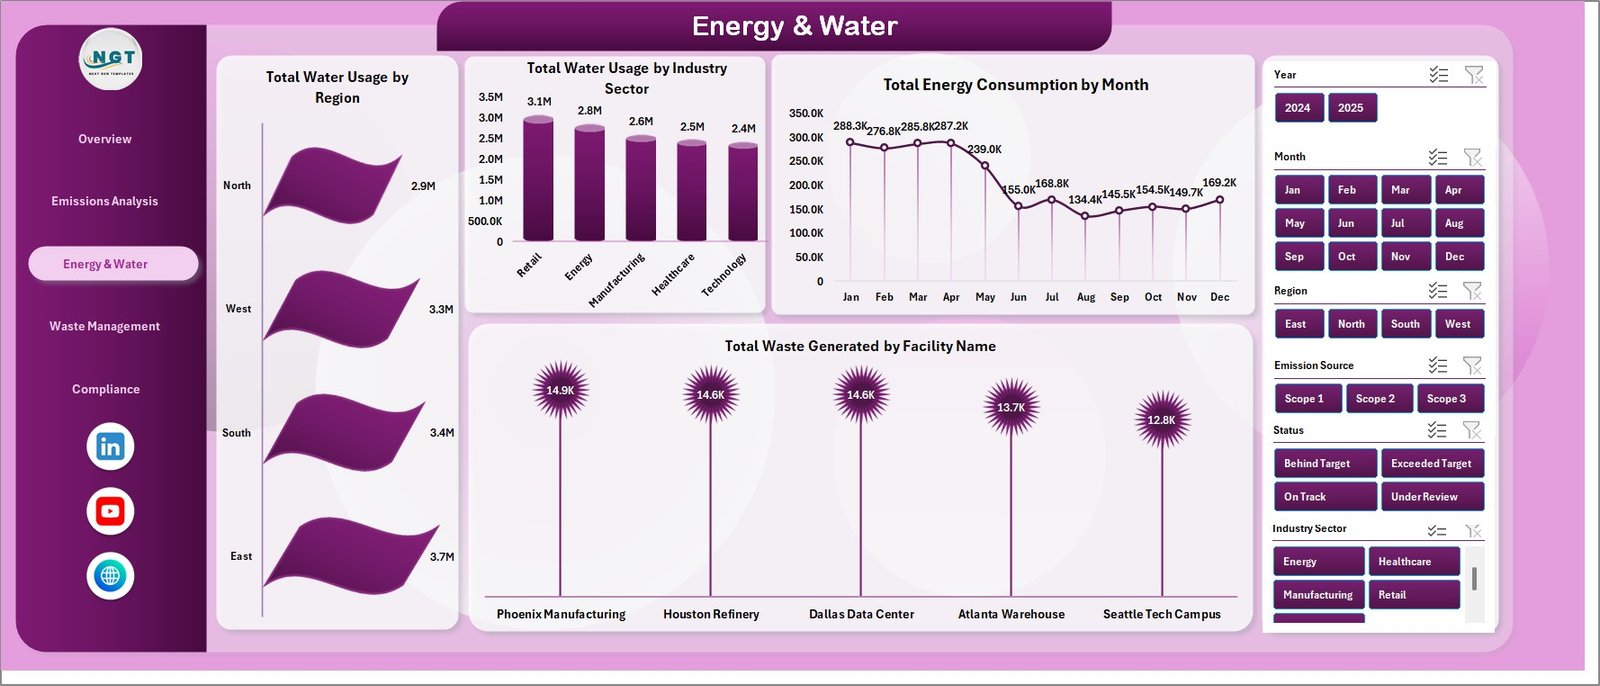 Energy & Water
4 — Waste Management
Monitor waste performance through Waste Diversion % by Region, Total Waste Generated by Industry Sector, Total Waste Generated by Month, and Avg. Compliance Score by Facility Name. This page delivers complete waste lifecycle visibility for sustainability reporting.
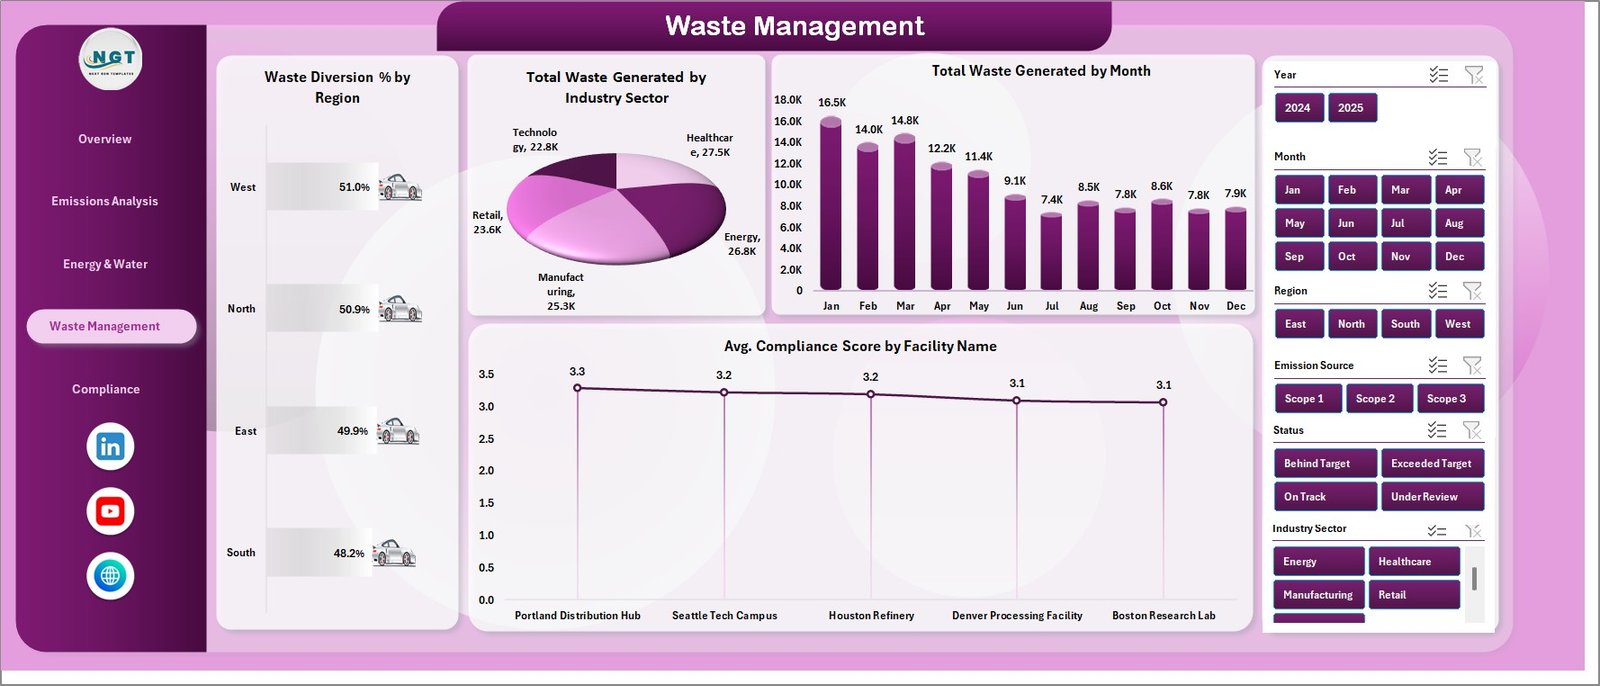 Waste Management
5 — Compliance
The compliance page evaluates Total Incidents by Region, Avg. Compliance Score by Industry Sector, Total Records by Status, and Renewable Energy % by Region — keeping your organization audit-ready and aligned with environmental regulations.
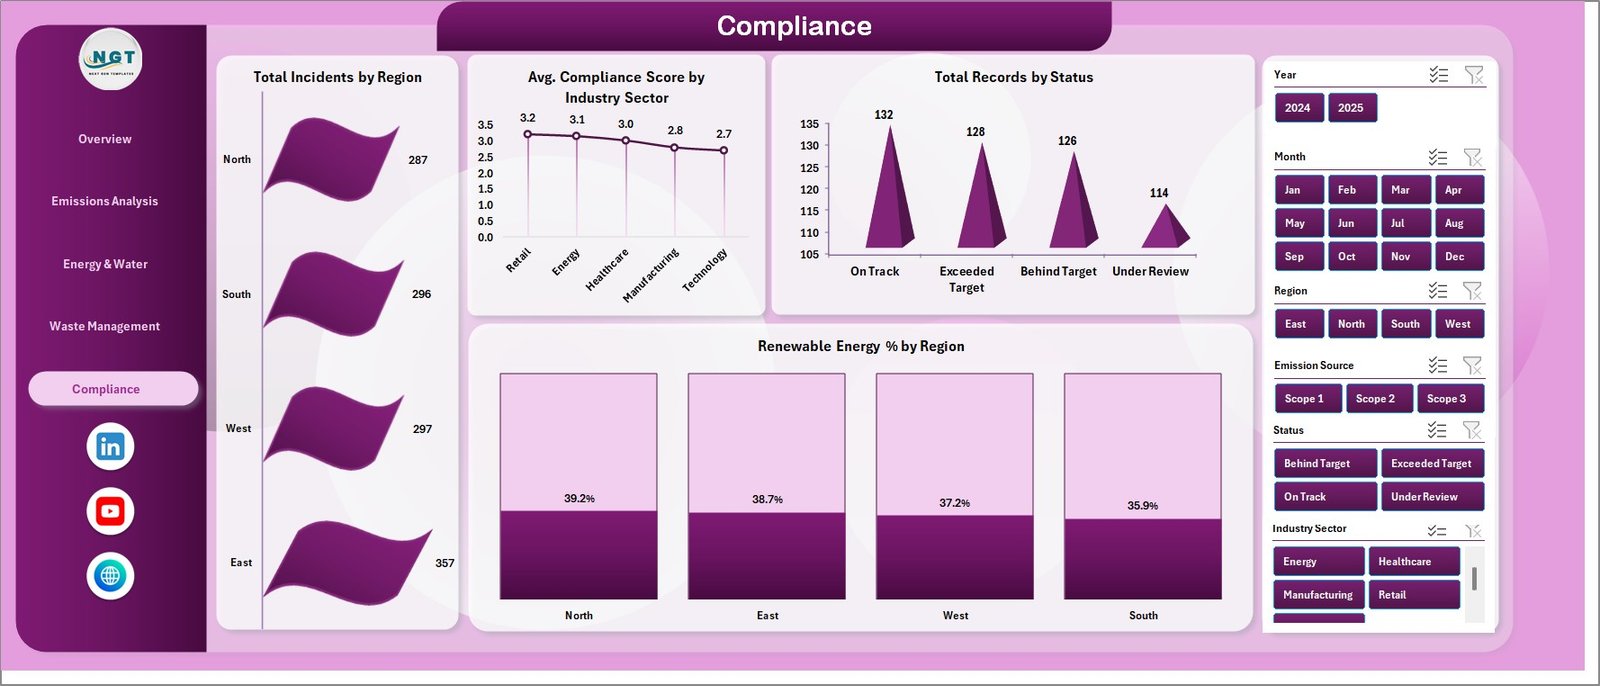 Compliance
6 — Data Sheet
This is the central data repository where you enter your raw environmental data. Simply add your data in the same format provided and refresh all pivots to update the entire dashboard instantly.
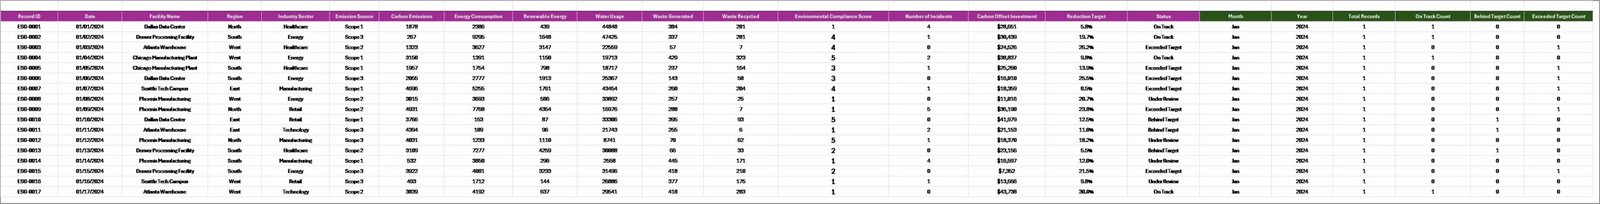 Data Sheet Tab
7 — Support Sheet
This sheet contains all the pivot tables that power the entire dashboard dynamically. Go to the Data tab in the Excel Ribbon and click Refresh All after updating the data sheet. All the pivots will be refreshed and all the charts will be refreshed. You can keep this sheet hidden during presentations for a cleaner view.
 Support Sheet Tab
Advantages of ESG Environmental Dashboard in Excel
This dashboard provides a centralized platform for all environmental data, eliminating the need for multiple disconnected spreadsheets. The automated pivot table engine removes manual calculations and reduces the risk of reporting errors. Interactive slicer filters enable instant analysis by any dimension — region, facility, industry sector, or time period.
Because the dashboard uses native Excel features with no macros, it is compatible across different Excel versions and can be easily shared with stakeholders who may not have advanced technical skills. The professional design makes it ready for boardroom presentations, investor reports, and regulatory submissions.
Opportunities for Improvement
While the dashboard covers the core environmental metrics comprehensively, organizations with advanced needs might consider adding Scope 1/2/3 emissions breakdowns for GHG Protocol alignment. Adding benchmark comparisons against industry averages could further enhance the compliance page. For real-time data integration, connecting the Excel file to external databases via Power Query would automate the data refresh process.
Best Practices
Update the Data Sheet regularly — ideally monthly — to maintain accurate trend analysis. Use consistent naming conventions for facilities and regions to ensure slicers work correctly. Back up the original template before making structural changes. When presenting to executives, hide the Support Sheet and Data Sheet tabs for a cleaner dashboard experience. For organizations tracking ESG metrics across multiple divisions, consider creating separate copies of the dashboard for each division and consolidating in a master file.
Explore Relevant Templates
- Circular Economy Startups Dashboard in Excel — Track sustainability KPIs, waste diversion, recycling, and resource efficiency for startups.
- Environmental Compliance KPI Scorecard in Excel — Monitor 10 environmental KPIs with MTD and YTD performance tracking.
- Environmental Services Dashboard in Power BI — Track sustainability, operations, and financial KPIs with Power BI analytics.
- Circular Economy Startups Dashboard in Power BI — Sustainability startup analytics with Power BI interactive visuals.
Frequently Asked Questions
What KPIs does the ESG Environmental Dashboard in Excel track?
The ESG Environmental Dashboard in Excel tracks 5 key performance indicators including Total Carbon Emissions, Total Energy Consumption, Total Water Usage, Total Carbon Offset, and Total Records. It also monitors compliance scores, waste diversion rates, renewable energy percentages, and incident counts across 5 interactive analysis pages.
Do I need advanced Excel skills to use this ESG dashboard?
No. Simply replace the sample data in the Data Sheet tab with your own environmental data and click Refresh All in the Data tab. All pivot tables, charts, and KPI cards update automatically — no formulas to write or macros to enable.
Can I customize this ESG Environmental Dashboard for my organization?
Yes. The dashboard is fully customizable. You can add new KPIs, modify chart types, change color themes, add new data columns, and expand the pivot table structure to match your specific ESG tracking requirements.
What is the best Excel template for tracking ESG environmental metrics?
The ESG Environmental Dashboard in Excel is one of the most comprehensive ESG environmental tracking templates available. It covers carbon emissions, energy consumption, water usage, waste management, and compliance monitoring across 5 dedicated analysis pages with interactive slicer filters.
Is this dashboard suitable for ESG compliance reporting?
Yes. The dedicated Compliance page tracks Total Incidents by Region, Avg. Compliance Score by Industry Sector, Records by Status, and Renewable Energy Percentage by Region — providing the structured data visibility needed for ESG audits and regulatory reporting.
How do I refresh the dashboard after adding new data?
After updating the Data Sheet with your new records, go to the Data tab in the Excel Ribbon and click Refresh All. All pivot tables in the Support Sheet will refresh and all charts across the 5 dashboard pages will update automatically.
Conclusion
The ESG Environmental Dashboard in Excel is an essential tool for any organization serious about environmental sustainability monitoring and ESG compliance. With 5 interactive pages, dynamic slicer filters, automated pivot calculations, and professional KPI cards, it transforms raw environmental data into powerful visual insights — all within the familiar Excel environment.
Click here to Purchase ESG Environmental Dashboard in Excel
For more Excel dashboard tutorials and templates, visit our YouTube channel and explore hundreds of ready-to-use Excel Dashboard Templates at NextGenTemplates.com.
👉 Youtube.com/@PK-AnExcelExpert
For learning more about Excel features, visit Microsoft Excel Support.