Effective financial management is essential for the success of any organization. A Finance KPI Scorecard in Excel allows finance teams and executives to track key financial metrics, identify trends, and make data-driven decisions. This ready-to-use template consolidates multiple KPIs in one place, making it easier to monitor both monthly and yearly performance.
In this article, we will explain the features, advantages, and best practices of using the Finance KPI Scorecard in Excel.
What Is a Finance KPI Scorecard?
A Finance KPI Scorecard is a structured tool that tracks key financial performance indicators. It provides insights into areas such as revenue, expenses, profitability, liquidity, and operational efficiency.
Using Excel, this scorecard allows finance professionals to:
-
View monthly (MTD) and yearly (YTD) performance
-
Compare actual results against targets
-
Monitor trends using traffic lights, up/down arrows, and percentage changes
-
Make informed, data-driven financial decisions
Key Features of the Finance KPI Scorecard
This scorecard is designed for simplicity and usability, with multiple interactive elements.
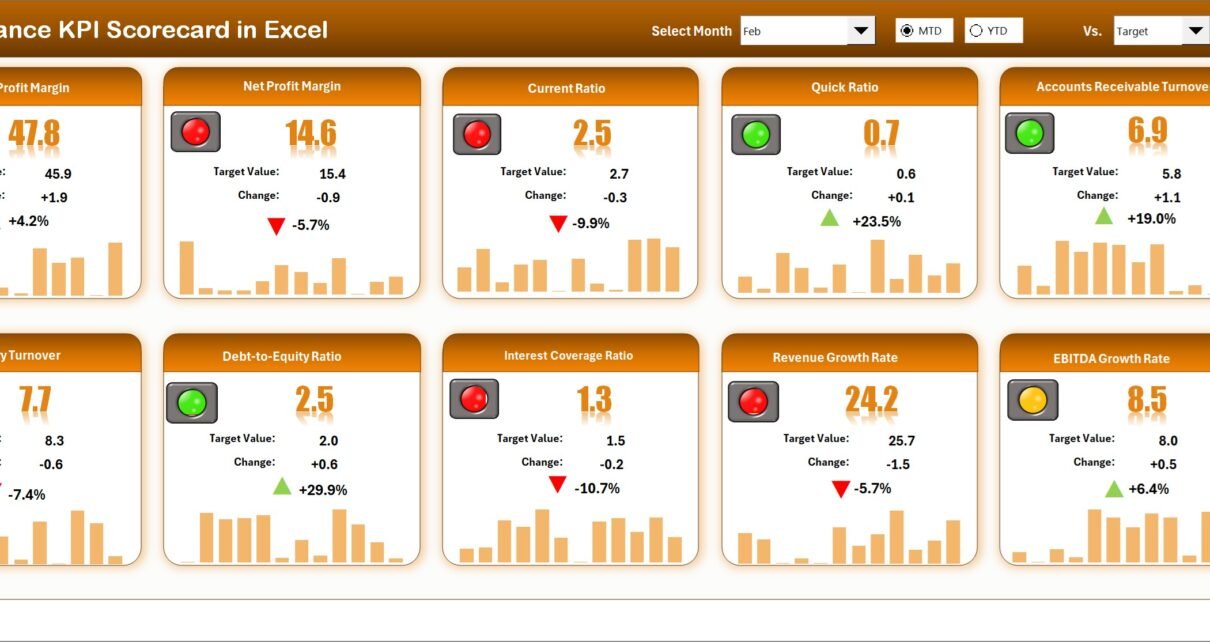
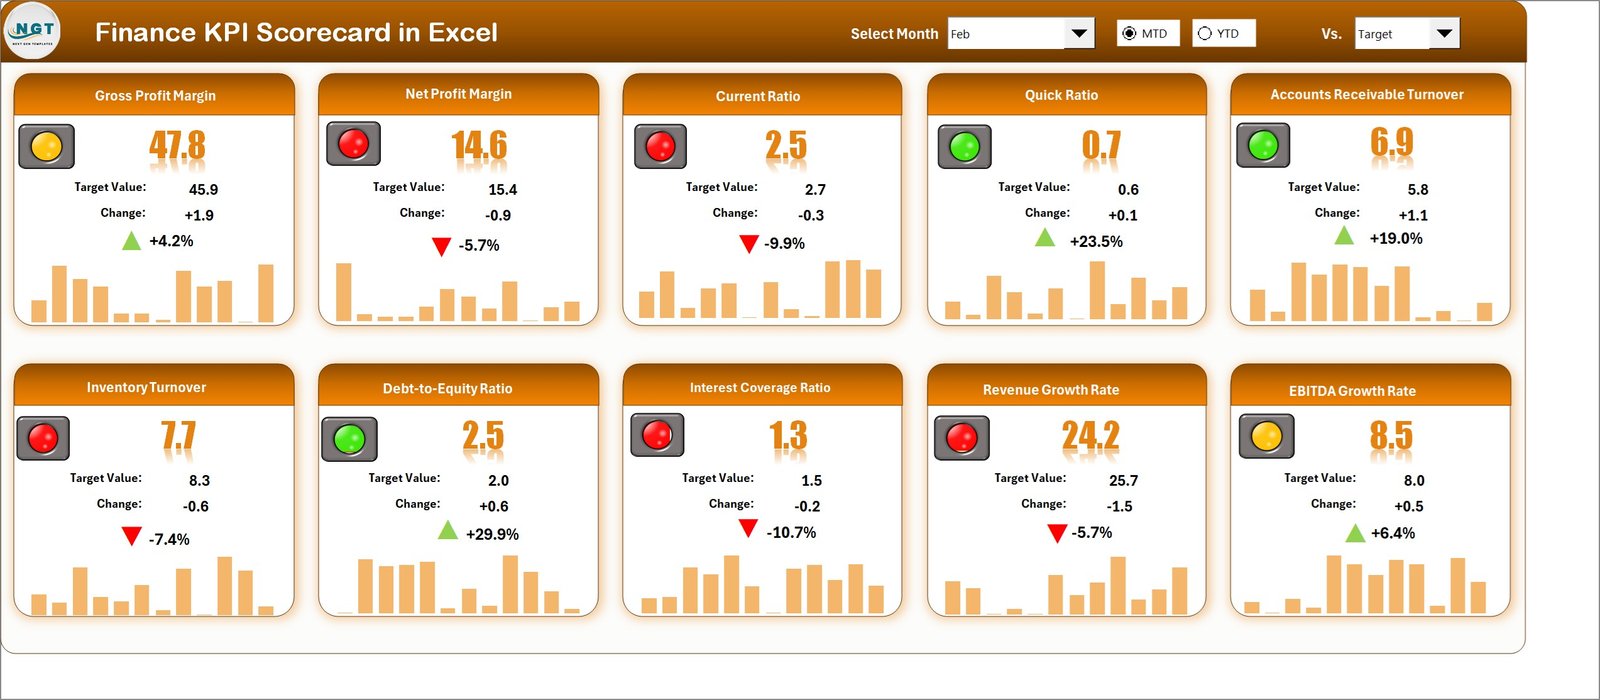
1. Dashboard Overview
The Dashboard displays all KPIs in one view:
-
Month Selection Dropdown: Automatically updates all KPI values, traffic light colors, and up/down arrows for the selected month
-
MTD & YTD Toggle: Click to switch between monthly and yearly performance metrics
-
Traffic Lights & Arrows: Visual indicators of performance vs target, showing trends and percentage changes
Click to Buy Finance KPI Scorecard in Excel
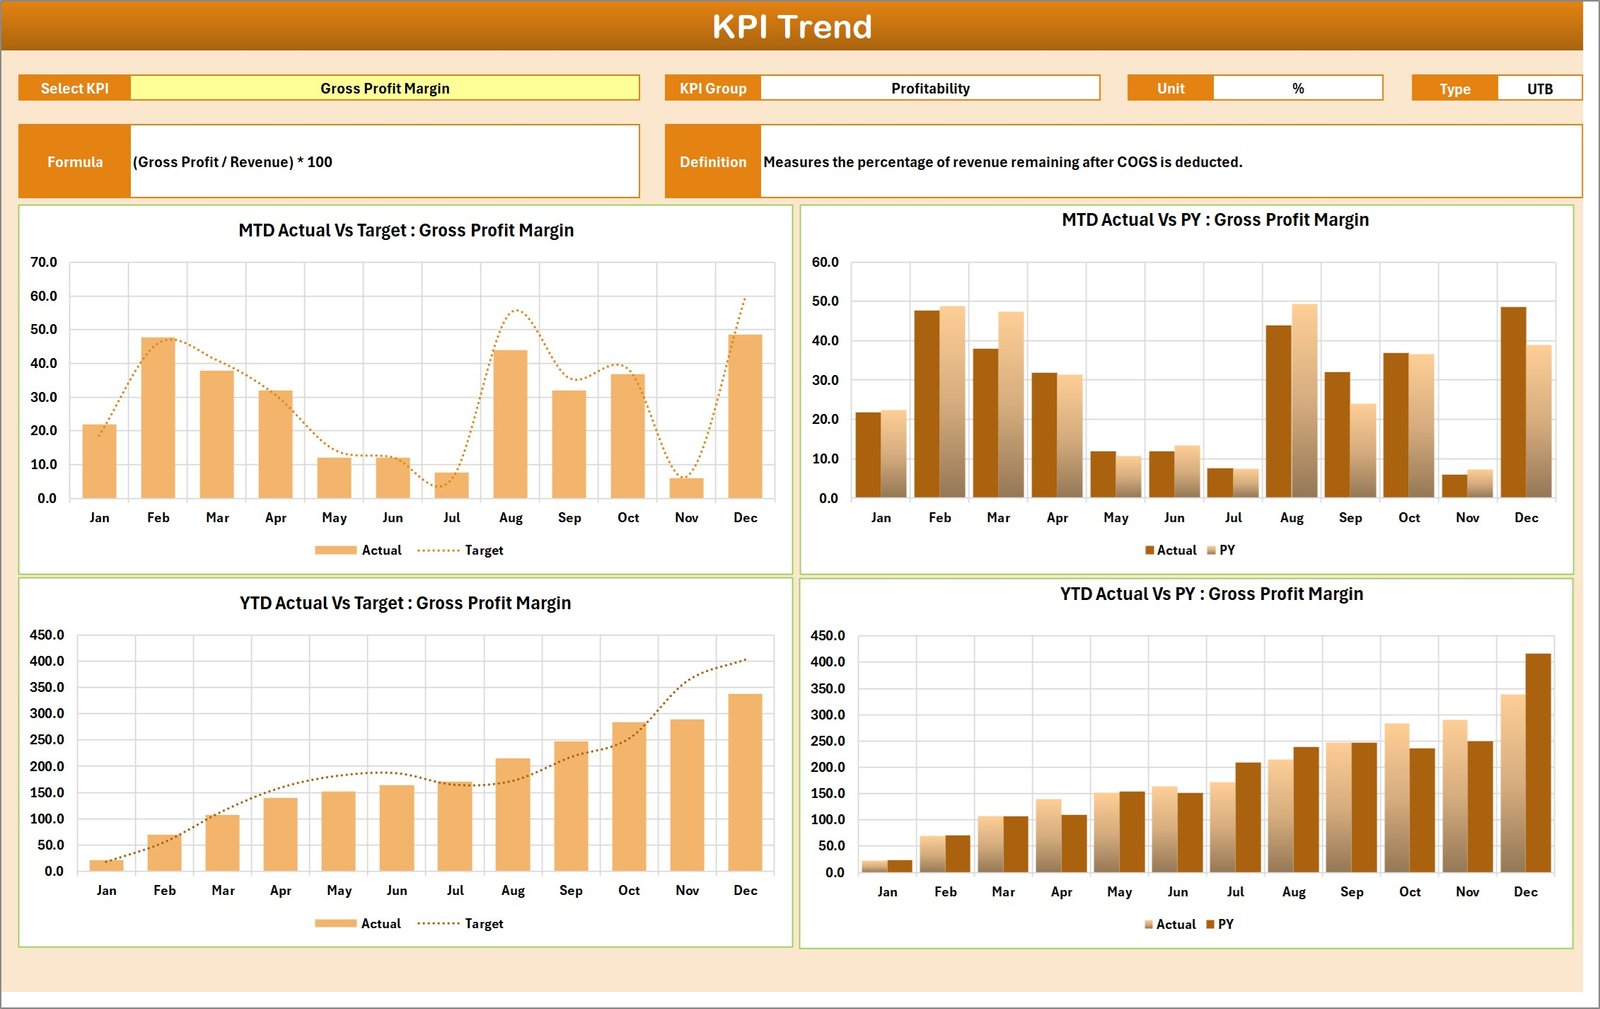
2. Trend Sheet Tab
The Trend Sheet allows detailed analysis of individual KPIs:
KPI Selection Dropdown (Range C3): Choose the KPI you want to analyze
Displayed Information:
- KPI Group
- Unit of KPI (e.g., $, %, count)
- KPI Type: Lower the Better (LTB) or Upper the Better (UTB)
- Formula of the KPI
- Definition of the KPI
This sheet helps track performance over time and identify patterns or areas needing improvement.
Click to Buy Finance KPI Scorecard in Excel
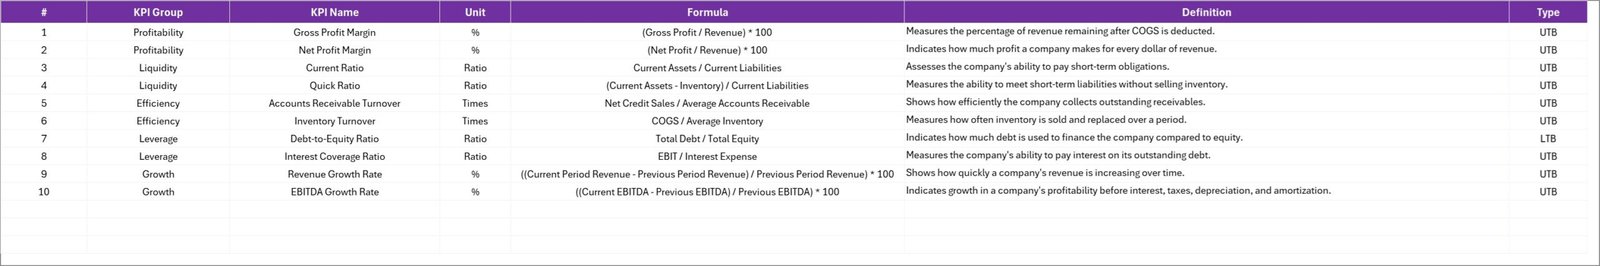
3. KPI Definition Sheet Tab
The KPI Definition Sheet provides a reference for all tracked KPIs:
-
Enter KPI Name, KPI Group, Unit, Formula, and Definition
-
Indicate whether the KPI is Lower-the-Better or Upper-the-Better
-
Ensures clarity and consistency across the scorecard
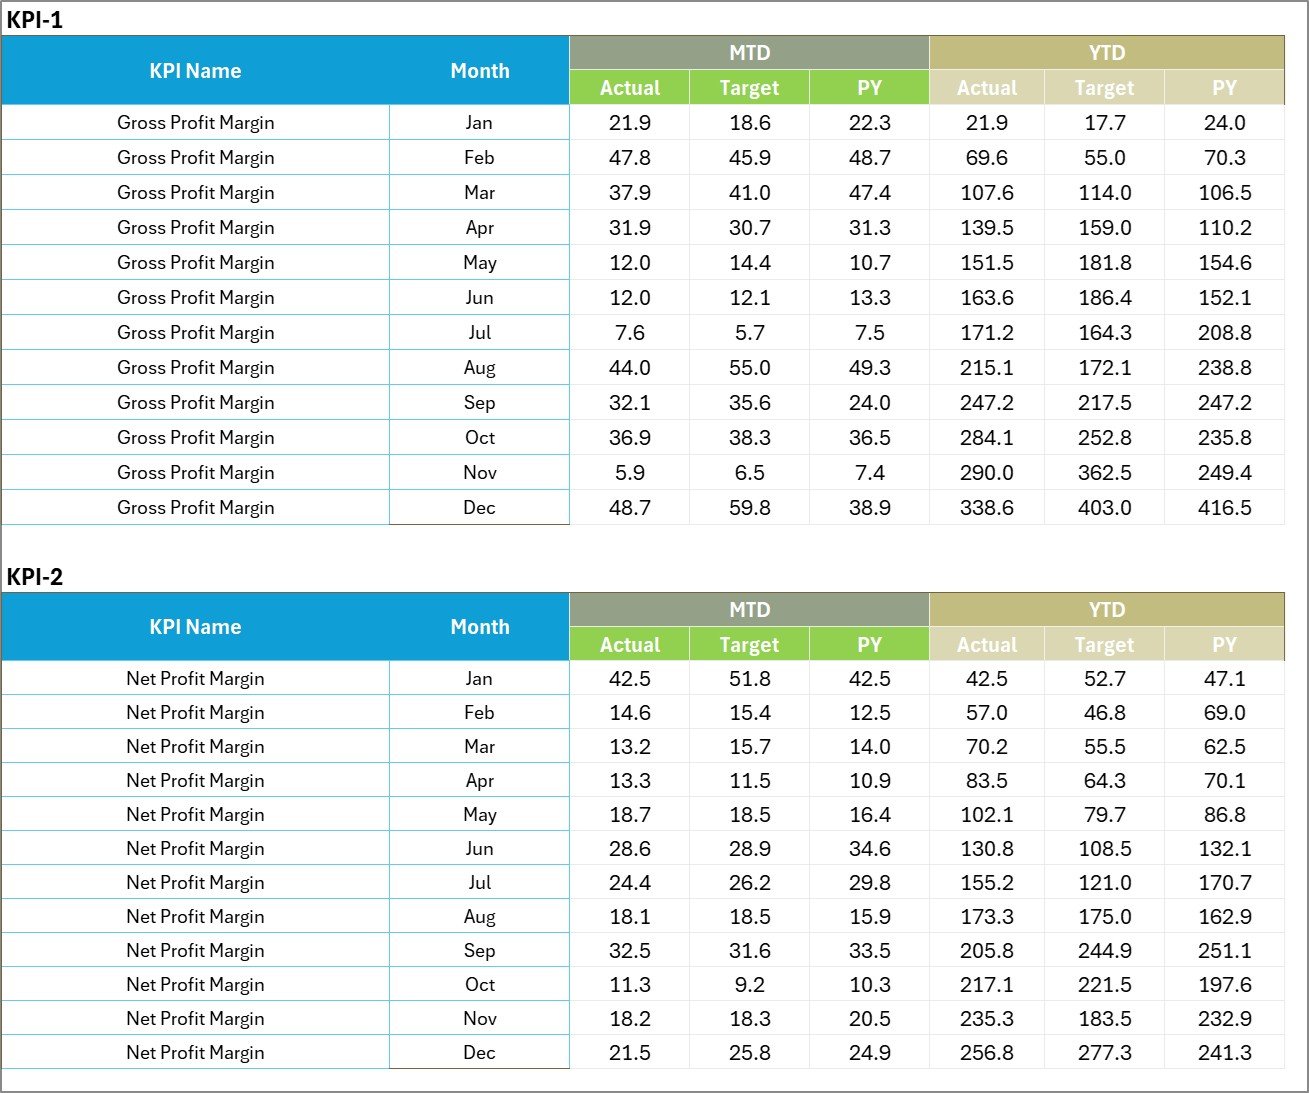
4. Input Data Sheet
This is the data entry backbone of the scorecard.
✍ Data Entry – Enter monthly Actuals, Targets, and other required metrics.
🔄 Flexibility – Update the sheet with new numbers regularly, ensuring the scorecard reflects current results.
The simplicity of this sheet makes it easy for anyone on the marketing team to update without technical knowledge.
Click to Buy Finance KPI Scorecard in Excel
Advantages of Using the Finance KPI Scorecard
-
Centralized Tracking: Monitor all financial KPIs in one place
-
Visual Insights: Traffic lights and arrows help identify trends at a glance
-
Monthly & Yearly Analysis: Compare MTD and YTD performance effortlessly
-
Data Accuracy: Reduces manual errors in calculations
-
Actionable Insights: Identify underperforming areas and take corrective measures
-
Easy to Customize: Add or remove KPIs based on organizational needs
Best Practices for Using the Scorecard
-
Update Data Regularly: Enter monthly financial figures to ensure accuracy
-
Set Clear Targets: Establish realistic KPIs for better performance tracking
-
Monitor Trends: Use the Trend Sheet to identify improving or declining KPIs
-
Review Traffic Lights: Focus on KPIs with red indicators to prioritize action
-
Align with Business Goals: Ensure KPIs are relevant to your company’s strategic objectives
How This Scorecard Helps Finance Teams
Click to Buy Finance KPI Scorecard in Excel
-
Track Financial Performance: Monitor revenue, expenses, and profitability
-
Identify Risk Areas: Quickly spot KPIs that are underperforming
-
Improve Decision-Making: Make informed decisions based on accurate metrics
-
Simplify Reporting: Generate scorecard insights for management and stakeholders
-
Plan Strategic Initiatives: Use trends to guide budgeting and cost management
Frequently Asked Questions (FAQs)
Q1: Can I add more KPIs to this scorecard?
Yes, you can customize the scorecard by adding new KPIs in the KPI Definition Sheet and updating the Dashboard.
Q2: Can this scorecard track multiple months and years?
Yes, use the month dropdown and MTD/YTD toggle to view monthly or yearly performance.
Q3: How do the traffic lights work?
Traffic lights change based on whether the KPI meets, exceeds, or falls below the target, giving instant visual cues.
Q4: Is this template suitable for large organizations?
Yes, it can handle multiple KPIs and large datasets efficiently in Excel.
Q5: Can I use it for financial reporting to stakeholders?
Absolutely. The dashboard provides a clear visual summary suitable for management and board reporting.
Conclusion
Click to Buy Finance KPI Scorecard in Excel
The Finance KPI Scorecard in Excel is a powerful tool to monitor financial performance, track KPIs, and make data-driven decisions. With interactive dashboards, trend analysis, and clear KPI definitions, finance teams can optimize performance, improve reporting, and align financial metrics with organizational goals.
Visit our YouTube channel to learn step-by-step video tutorials
Watch the step-by-step video Demo:
Click to Buy Finance KPI Scorecard in Excel