Managing port projects is never simple. Port authorities, terminal operators, EPC contractors, and logistics teams handle massive budgets, tight schedules, multiple vendors, strict compliance rules, and constant operational risks. However, when project performance data stays scattered across Excel files, emails, and static reports, visibility drops quickly. As a result, decision-making becomes reactive instead of strategic.
That is exactly why a Port Project Management KPI Dashboard in Excel becomes a powerful and business-ready solution.
In this detailed article, you will learn what a Port Project Management KPI Dashboard in Excel is, how it works, why it matters, its complete worksheet structure, key KPIs, advantages, best practices, and frequently asked questions. Moreover, this guide uses clear language, strong transitions, and real port project logic so you can confidently apply it in real-world scenarios.
Click to buy Port Project Management KPI Dashboard in Excel
What Is a Port Project Management KPI Dashboard in Excel?
A Port Project Management KPI Dashboard in Excel is a centralized, interactive reporting tool designed to track, measure, and visualize key performance indicators related to port infrastructure and operational projects.
Instead of manually reviewing raw project data, this dashboard converts numbers into actionable insights. Consequently, project managers, port authorities, finance teams, and leadership gain instant clarity on performance.
Most importantly, this dashboard works entirely in Excel. Therefore, teams avoid expensive BI tools while still achieving enterprise-level reporting.
Why Is a Port Project Management KPI Dashboard Important?
Port projects involve high stakes. Even a small delay or cost overrun can lead to penalties, congestion, and revenue loss. Therefore, tracking KPIs consistently becomes critical.
Here is why this dashboard matters:
- It centralizes all project KPIs in one place
- It highlights performance gaps instantly
- It improves accountability across teams
- It supports faster and better decisions
- It reduces dependency on manual reporting
As a result, port organizations move from reactive firefighting to proactive project control.
How Does a Port Project Management KPI Dashboard in Excel Work?
The dashboard follows a structured data-to-insight flow. First, users enter actual, target, and previous-year data. Next, Excel formulas calculate variances automatically. Finally, visuals update dynamically based on month and KPI selection.
Because everything connects through structured tables and formulas, the dashboard refreshes instantly when users change inputs. Therefore, leaders always see the latest project status.
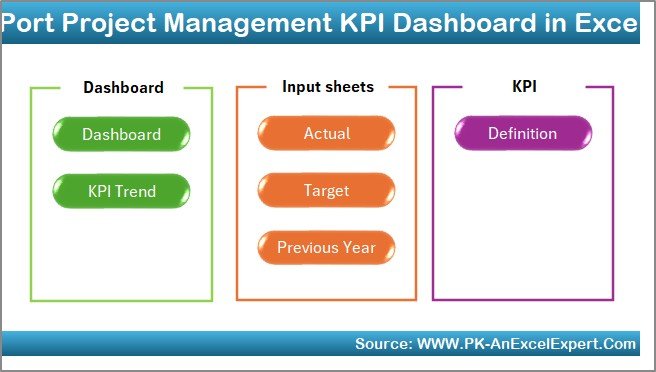
What Are the Core Features of the Port Project Management KPI Dashboard?
This KPI dashboard includes 7 well-designed worksheets, each serving a specific business purpose. Let us explore them one by one.
What Is the Summary Page in the KPI Dashboard?
The Summary Page acts as the dashboard’s index and navigation hub.
Key Highlights of the Summary Page
- It contains 6 navigation buttons
- Each button jumps to a specific worksheet
- It improves usability for non-technical users
- It enables quick access during meetings
Because of this structure, users never waste time searching for information.
Click to buy Port Project Management KPI Dashboard in Excel
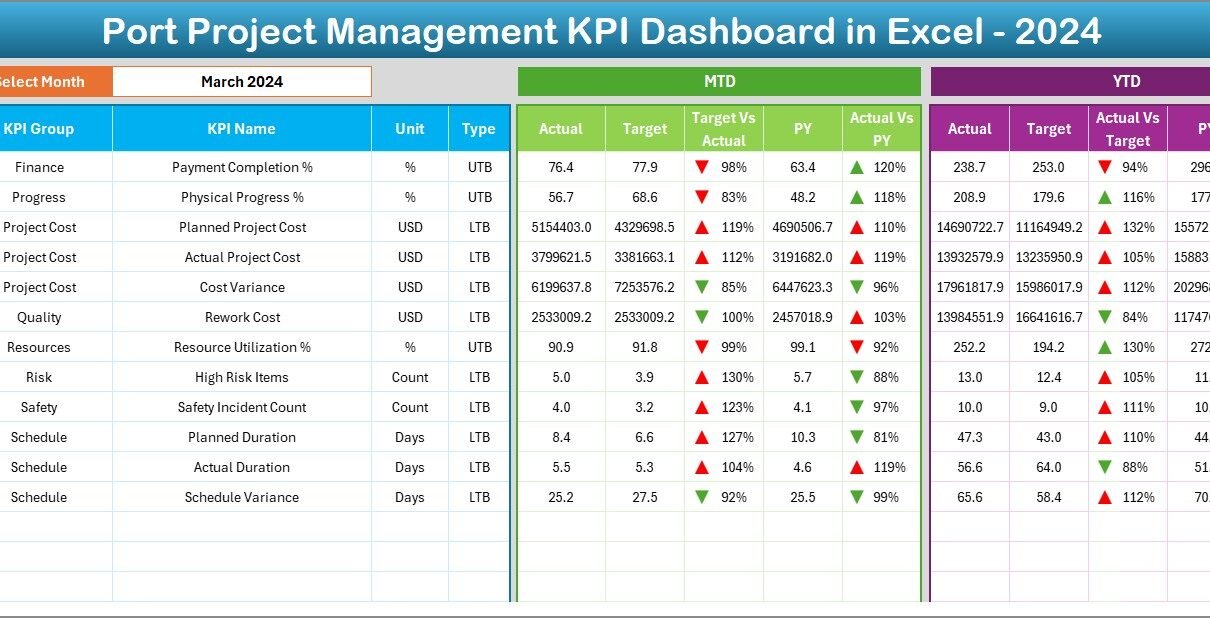
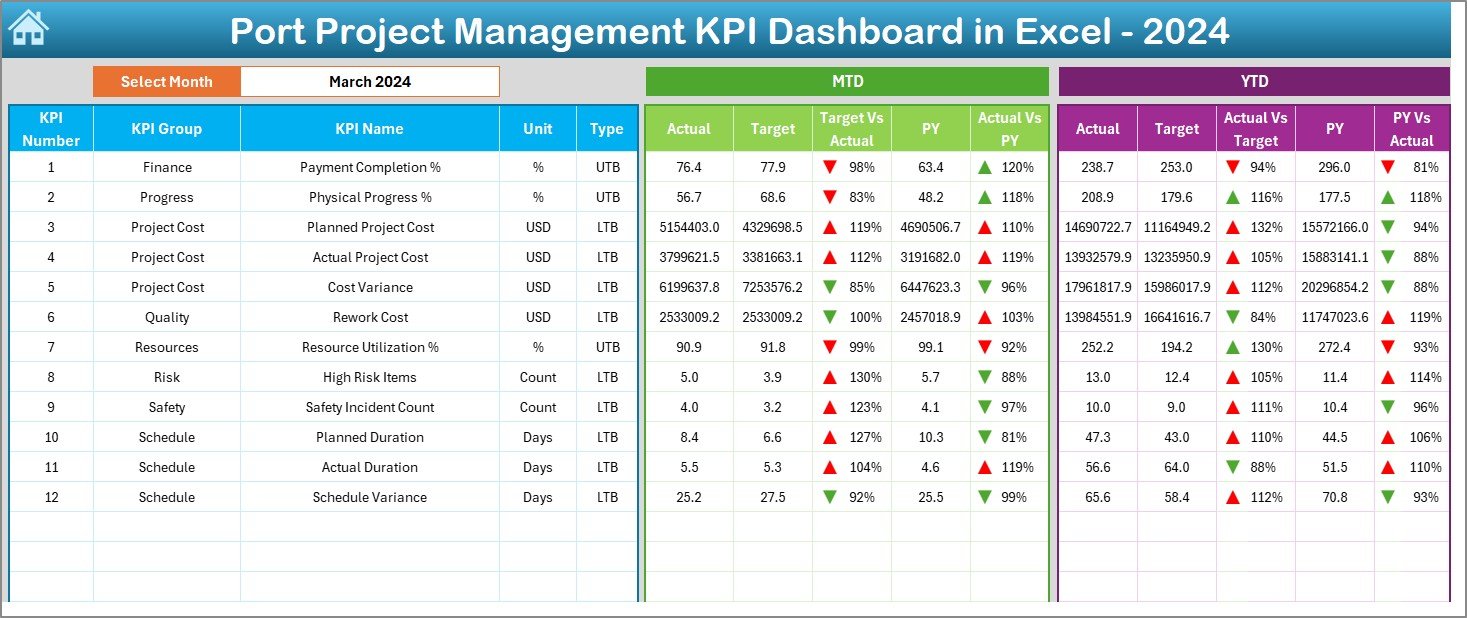
Dashboard Sheet
The Dashboard Sheet is the heart of the entire KPI system.
Key Capabilities of the Dashboard Sheet
- Month selection using a drop-down at cell D3
- Automatic refresh of all KPI numbers
- Clear display of MTD (Month-to-Date) performance
- Clear display of YTD (Year-to-Date) performance
KPIs Displayed on the Dashboard
For each KPI, the dashboard shows:
- Actual values
- Target values
- Previous Year values
- Target vs Actual variance
- Previous Year vs Actual variance
Moreover, the dashboard uses conditional formatting with up and down arrows. As a result, users instantly identify positive and negative trends.
Click to buy Port Project Management KPI Dashboard in Excel
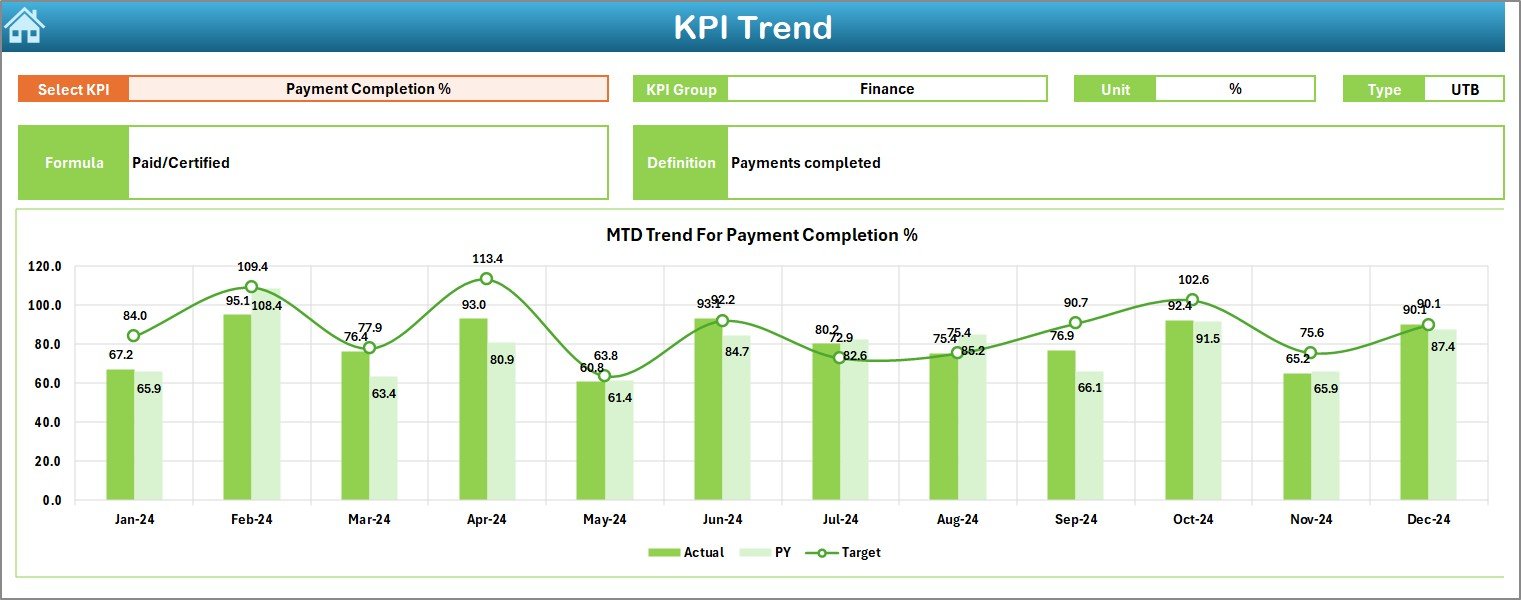
Trend Sheet
The Trend Sheet focuses on deep KPI performance analysis.
Key Functions of the Trend Sheet
- KPI selection using a drop-down at cell C3
- Automatic display of KPI metadata:
KPI Group
KPI Unit
KPI Type (Lower the Better / Upper the Better)
KPI Formula
KPI Definition
Visual Analysis on the Trend Sheet
The sheet displays:
- MTD trend charts
- YTD trend charts
- Actual vs Target vs Previous Year comparisons
Because of this setup, users analyze KPI behavior over time instead of viewing static numbers.
Click to buy Port Project Management KPI Dashboard in Excel
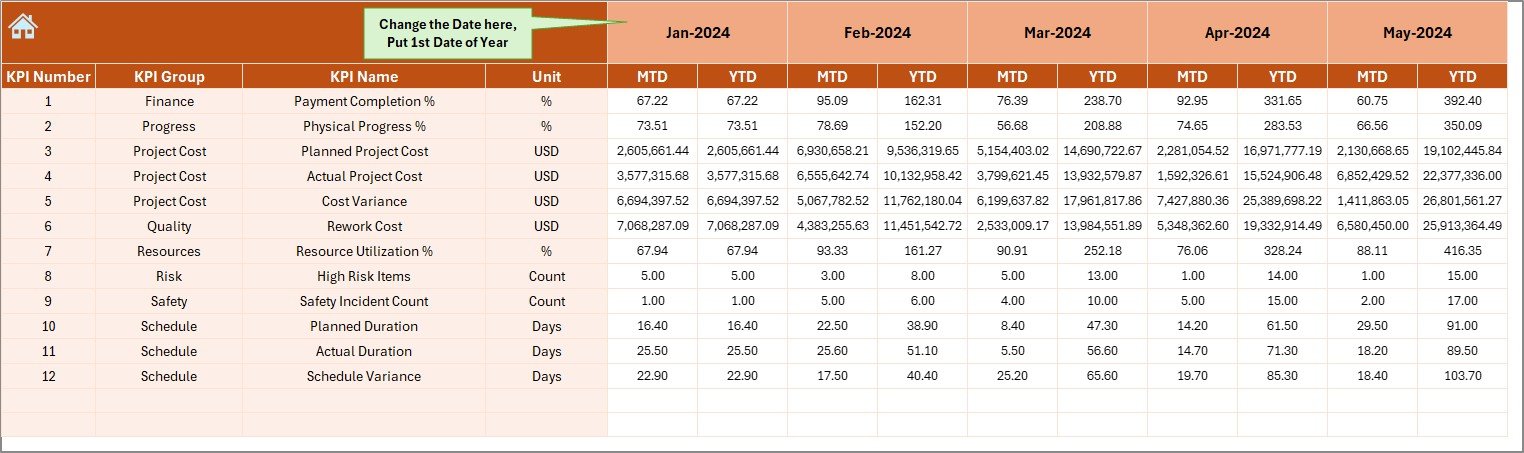
the Actual Numbers
The Actual Numbers Input Sheet captures real project performance.
How This Sheet Works
- Users enter MTD and YTD actual values
- Month selection happens at cell E1
- Users input the first month of the year once
- The system adjusts calculations automatically
This structured approach minimizes errors and ensures consistent data entry.
Click to buy Port Project Management KPI Dashboard in Excel
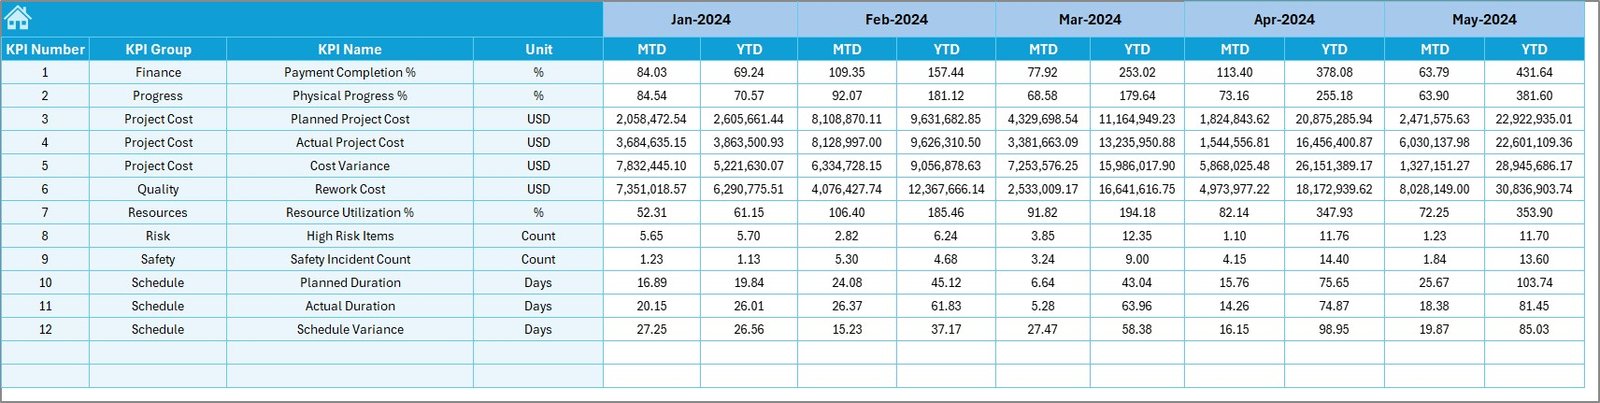
Target Sheet
The Target Sheet stores planned KPI values.
Key Benefits of the Target Sheet
- Separate entry for MTD targets
- Separate entry for YTD targets
- Clear benchmark for performance comparison
As a result, teams always know whether projects remain on track.
Click to buy Port Project Management KPI Dashboard in Excel
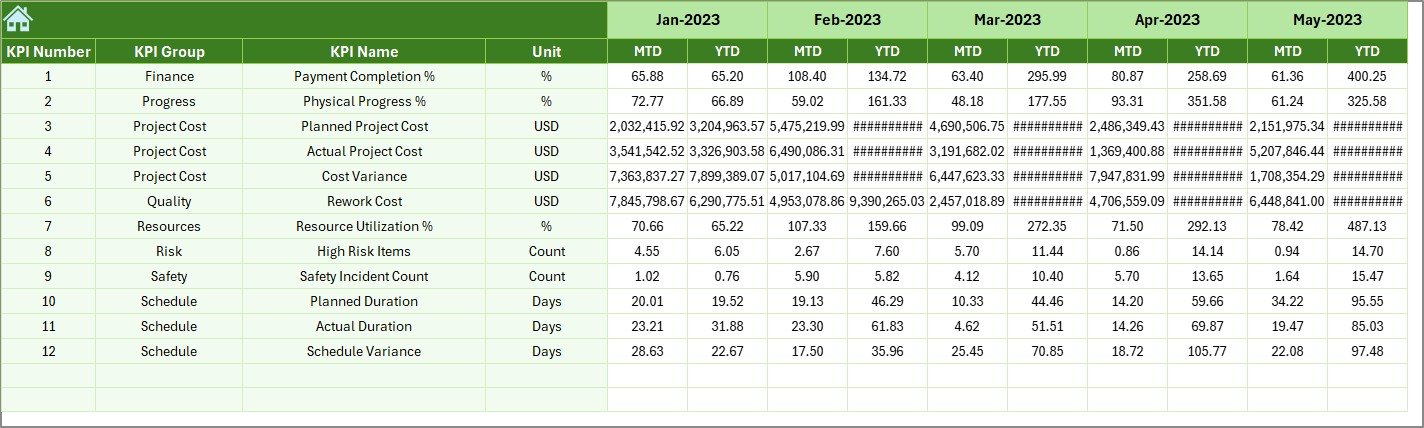
the Previous Year
The Previous Year Numbers Sheet enables historical comparison.
Why This Sheet Matters
- It captures last year’s MTD and YTD values
- It supports trend and growth analysis
- It highlights long-term performance improvement
Because of this sheet, the dashboard does not rely only on current-year data.
Click to buy Port Project Management KPI Dashboard in Excel
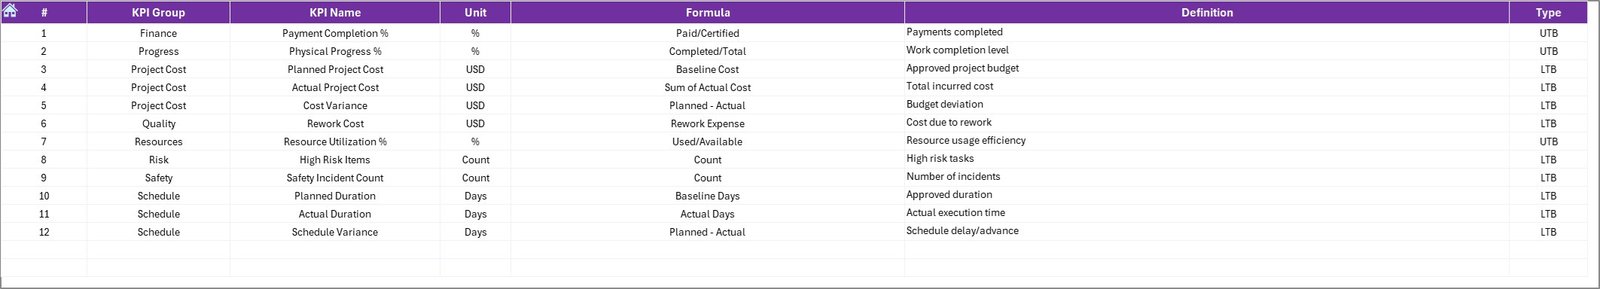
KPI Definition Sheet
The KPI Definition Sheet ensures clarity and consistency.
Information Maintained in This Sheet
- KPI Name
- KPI Group
- Unit of measurement
- KPI Formula
- KPI Definition
This sheet becomes especially useful when multiple teams use the dashboard.
Which KPIs Are Commonly Tracked in Port Project Management?
Although KPIs vary by project type, most port projects track the following categories:
Schedule Performance KPIs
- Schedule Variance
- Milestone Completion Rate
- Delay Percentage
Cost Management KPIs
- Budget Utilization
- Cost Variance
- Forecast vs Actual Cost
Quality and Safety KPIs
- Rework Rate
- Safety Incident Rate
- Compliance Score
Resource and Productivity KPIs
- Equipment Utilization
- Labor Productivity
- Contractor Performance Score
Because the dashboard supports flexible KPI definitions, teams customize KPIs easily.
Advantages of Port Project Management KPI Dashboard in Excel
A well-designed Excel KPI dashboard delivers measurable benefits.
Key Advantages
- Centralized project visibility
- Real-time KPI tracking
- Easy month-wise and KPI-wise analysis
- No dependency on complex BI tools
- Familiar Excel interface
- Lower implementation cost
As a result, both technical and non-technical users adopt the dashboard quickly.
How Does This Dashboard Improve Decision-Making?
The dashboard improves decisions in multiple ways:
- It highlights issues before they escalate
- It supports data-driven discussions
- It reduces reporting delays
- It improves leadership confidence
Because data updates automatically, leaders always act on the latest information.
Best Practices for Port Project Management KPI Dashboard in Excel
To maximize value, follow these best practices.
Define KPIs Clearly
Always define KPIs with clear formulas and ownership. Otherwise, teams may misinterpret results.
Update Data Consistently
Enter actual, target, and previous-year data on a fixed schedule. Consistency ensures accuracy.
Avoid Too Many KPIs
Focus on critical KPIs only. Too many metrics reduce clarity.
Use Monthly Reviews
Review dashboard performance monthly. Regular reviews drive accountability.
Protect Input Sheets
Lock formulas and protect sheets to prevent accidental changes.
Who Should Use a Port Project Management KPI Dashboard?
This dashboard suits multiple stakeholders:
- Port Authorities
- Terminal Operators
- EPC Contractors
- Project Management Offices (PMOs)
- Finance and Planning Teams
- Senior Leadership
Because the dashboard adapts easily, it fits both small and large port projects.
Can This Dashboard Support Multiple Projects?
Yes. Teams can either:
- Create one dashboard per project
- Add a Project selection filter
- Consolidate KPIs across projects
Therefore, the dashboard scales as project portfolios grow.
What Makes Excel Ideal for Port KPI Dashboards?
Excel remains popular because:
- It offers flexibility
- It supports powerful formulas
- It integrates easily with existing systems
- It reduces training effort
When designed correctly, Excel dashboards deliver enterprise-grade results.
Conclusion: Why Every Port Project Needs a KPI Dashboard in Excel
A Port Project Management KPI Dashboard in Excel transforms how port projects get monitored and controlled. Instead of fragmented reports and delayed insights, teams gain a single source of truth.
With structured worksheets, dynamic visuals, and clear KPI logic, this dashboard enables faster decisions, better control, and improved project outcomes. Most importantly, it does so using a tool every organization already trusts—Excel.
Frequently Asked Questions (FAQs)
What is a Port Project Management KPI Dashboard in Excel?
It is an Excel-based reporting tool that tracks, analyzes, and visualizes key performance indicators for port projects.
Can non-technical users operate this dashboard?
Yes. The dashboard uses drop-downs, buttons, and structured input sheets, making it user-friendly.
Does the dashboard support MTD and YTD analysis?
Yes. It displays MTD and YTD actual, target, and previous-year data with variance indicators.
Can I customize KPIs in this dashboard?
Absolutely. You can modify KPI definitions, formulas, and groups easily.
Is Excel powerful enough for large port projects?
Yes. When structured properly, Excel handles complex KPI tracking efficiently.
How often should KPI data be updated?
Ideally, teams should update data monthly or weekly based on project requirements.
Visit our YouTube channel to learn step-by-step video tutorials
Watch the step-by-step video tutorial:
Click to buy Port Project Management KPI Dashboard in Excel