In the fast-paced world of retail and e-commerce, allocating resources wisely makes the difference between steady growth and missed opportunities. Consequently, businesses need a clear, interactive way to track key performance indicators (KPIs) and adjust strategies in real time. That’s where the Retail and E-commerce Resource Allocation KPI Dashboard in Excel comes in. This ready-to-use template empowers managers, analysts, and executives to visualize monthly and year-to-date performance, compare targets against actuals, and drill into trends—all without complex software or lengthy setup.
Moreover, because this dashboard leverages familiar Excel functionality—such as drop-down selectors, conditional formatting, and pivot charts—you can customize it instantly to match your unique products, channels, and operational goals. As a result, teams gain immediate clarity on resource allocation, inventory utilization, marketing spend efficiency, and staffing needs.
In this article, we’ll explore:
-
What this dashboard tracks and why it matters
-
A detailed walkthrough of each worksheet
-
Advantages of using this Excel KPI dashboard
-
Best practices for rolling out and maintaining it
-
Answers to frequently asked questions
Click to Purchases Retail and E-commerce Resource Allocation KPI Dashboard in Excel
What Is a Retail and E-commerce Resource Allocation KPI Dashboard?
A Resource Allocation KPI Dashboard in Excel provides a centralized, visual summary of critical metrics related to how your organization allocates time, budget, and personnel across retail and online channels. Rather than juggling multiple spreadsheets or waiting for weekly reports, stakeholders can:
-
Select any month and instantly view actuals, targets, and prior-year figures.
-
Spot gaps between forecasts and performance with easy up/down arrow indicators.
-
Analyze trends over time for each KPI with clear line charts.
-
Update inputs and targets on dedicated sheets without touching formulas.
In other words, this dashboard minimizes manual work and maximizes insight. Since you work in Excel, you benefit from full control over data structure—plus, you can integrate it with Power Query, macros, or Power BI when you’re ready to scale.
Why Track Resource Allocation in Retail and E-commerce?
Tracking resource allocation helps you answer essential questions, such as:
-
Are we over-investing in marketing channels that underperform?
-
Do our staffing levels match peak sales periods?
-
How efficiently do we manage inventory across regions?
-
Which product categories drive the highest return on investment?
Key Features of the Dashboard Template
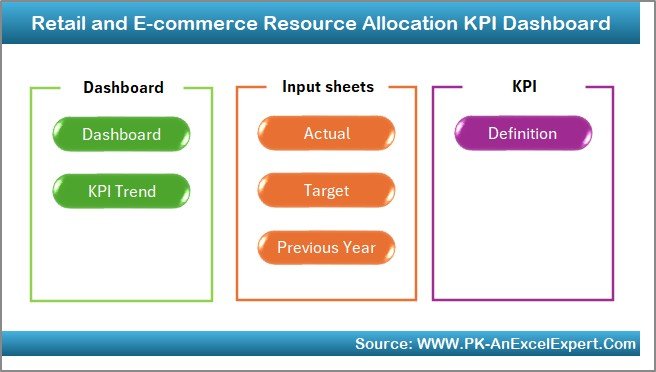
This dashboard includes seven interconnected worksheets. Each one plays a vital role in capturing, displaying, and contextualizing your KPI data.
Home Sheet
-
Purpose: Acts as an index and navigation hub.
Features:
- Six clickable buttons link to each detailed tab.
- A clean layout introduces your dashboard’s structure.
Click to Purchases Retail and E-commerce Resource Allocation KPI Dashboard in Excel
Why It Matters: Instead of scrolling through tabs, users click once to reach any section. Consequently, you save time and reduce confusion.
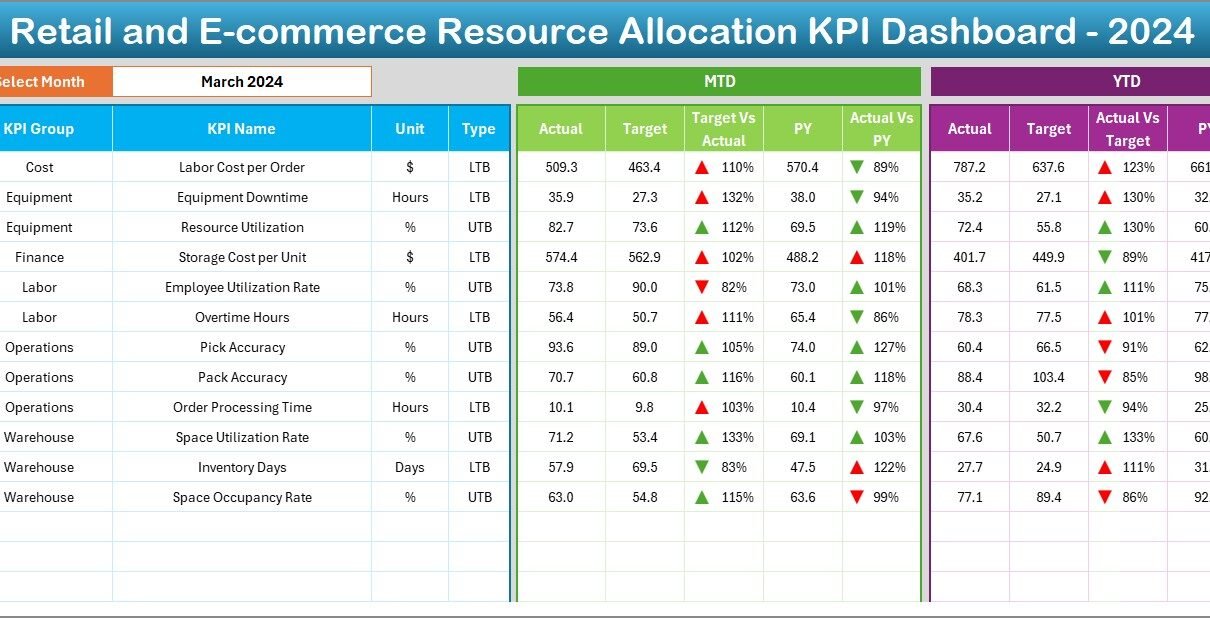
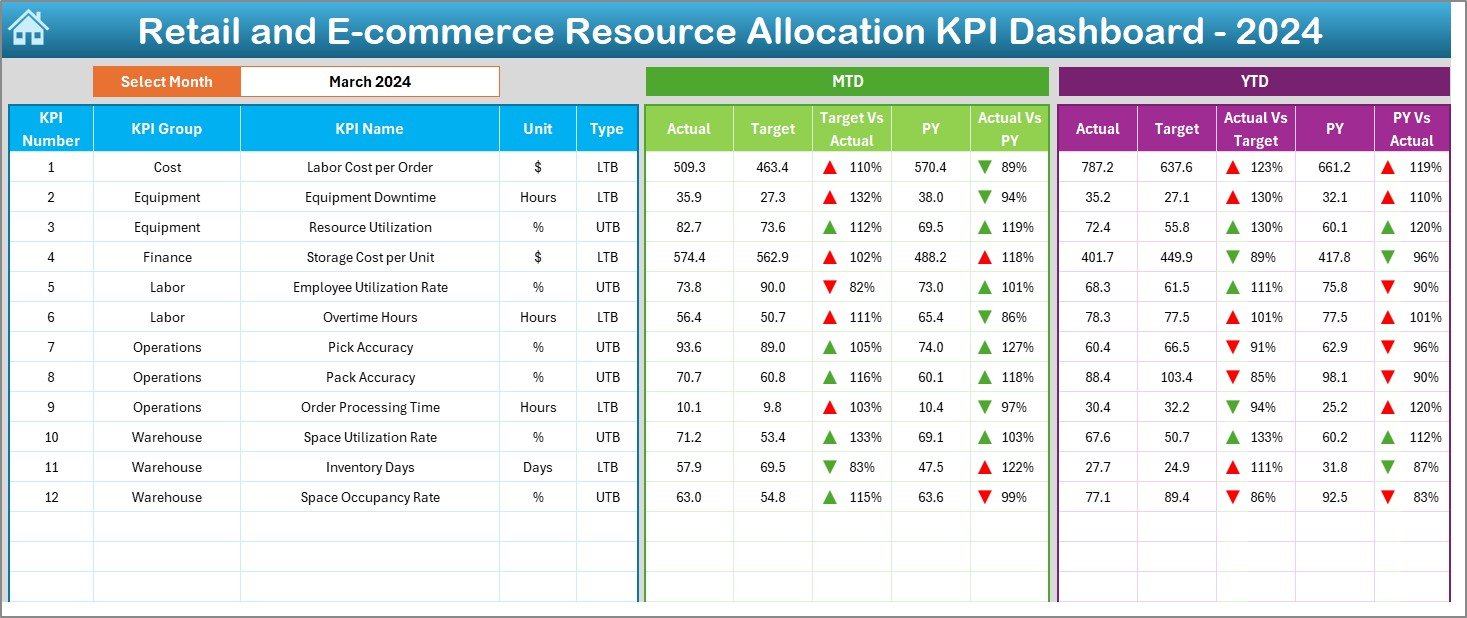
Dashboard Sheet Tab
-
Purpose: Serves as the central reporting interface.
-
Interactive Selector: Cell D3 houses a drop-down menu listing all months. When you choose, for example, June, the entire dashboard recalculates to show that month’s data.
Month-to-Date (MTD) Metrics:
- Actual values for each KPI
- Target values that you set in the Targets sheet
- Previous Year (PY) values that you entered in the PY Numbers sheet
- Variance Indicators: Conditional formatting displays green up-arrows for positive trends and red down-arrows for negative ones.
-
Year-to-Date (YTD) Metrics: Similarly structured to MTD, YTD comparisons give you a broader perspective on performance.
-
Why It Matters: With both MTD and YTD side by side, you spot short-term issues and long-term trends at once.
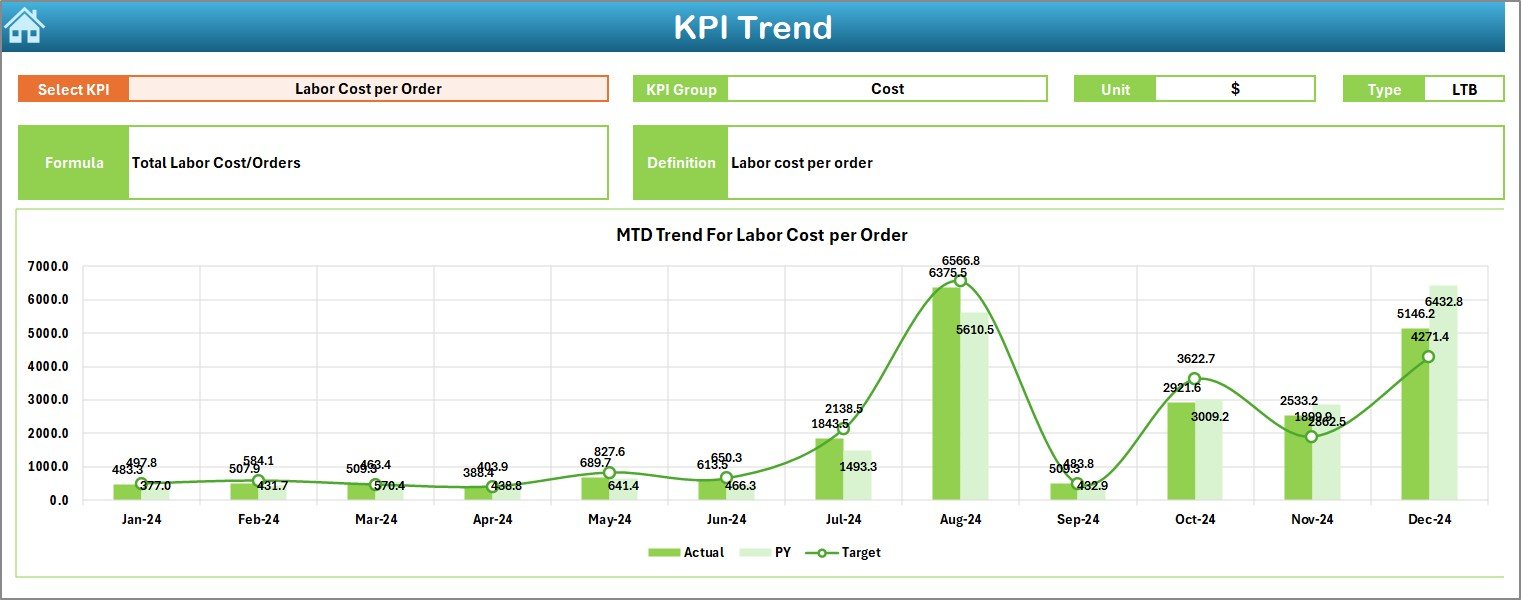
KPI Trend Sheet Tab
-
Purpose: Visualizes performance trends for a single KPI over time.
-
Interactive Selector: Cell C3 features a drop-down of all KPI names.
Displayed Information:
- KPI Group (e.g., Inventory, Marketing, Labor)
- Unit (e.g., %, $, units sold)
- Type (Lower the Better or Upper the Better)
- Formula and Definition to clarify calculation logic
-
Trend Charts: Two side-by-side line charts show MTD and YTD actuals, targets, and PY values for the selected KPI.
-
Why It Matters: You drill into each KPI without cluttering your main dashboard with too many lines or bars.
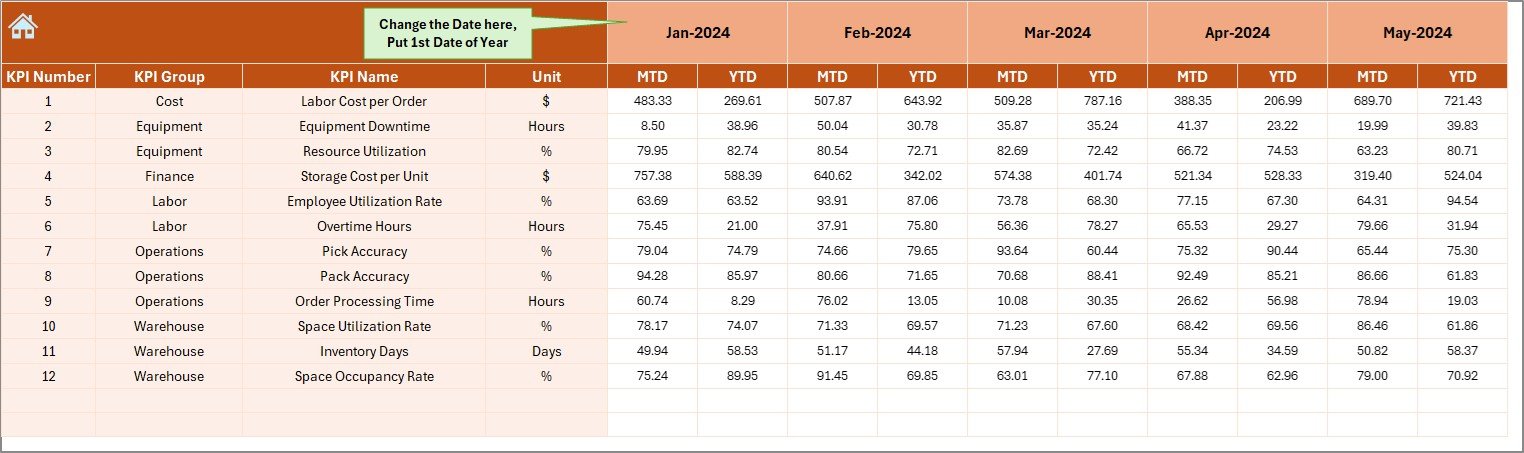
Actual Numbers Input Sheet
-
Purpose: Captures the raw actual performance numbers.
Instructions:
- In cell E1, enter the first month of your fiscal year (e.g., “Jan-2025”).
- Below, list each KPI with its MTD and YTD actual values for each month.
-
Why It Matters: By separating raw data entry from analysis, you preserve your formulas and avoid accidental overwrites.
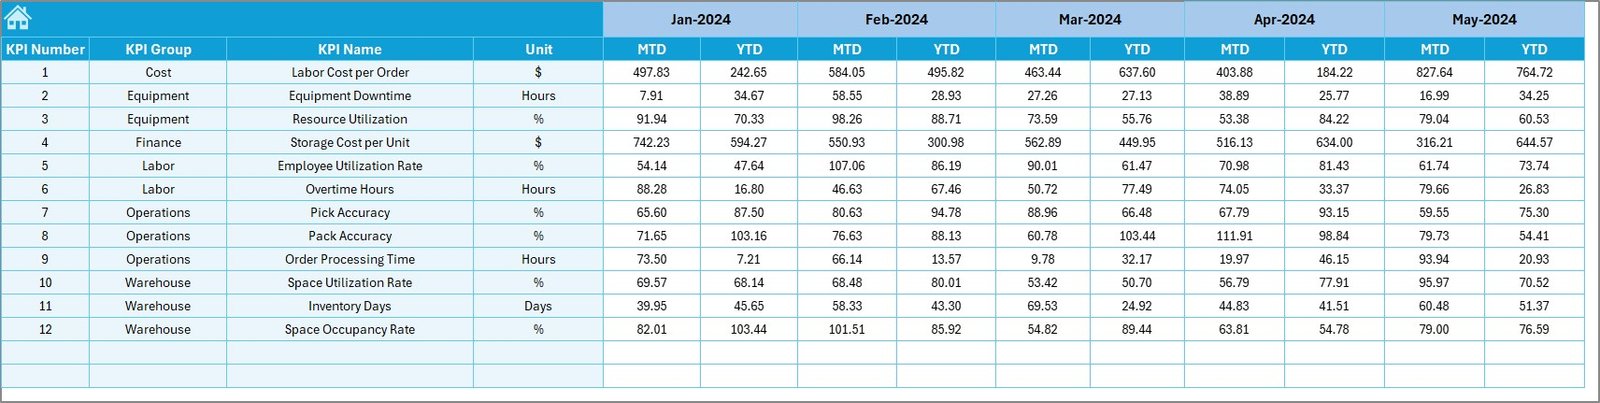
Target Sheet Tab
-
Purpose: Houses your monthly targets for MTD and YTD.
-
Structure: Mirrors the layout of the Actual Numbers sheet.
-
Why It Matters: You compare actuals to goals instantly, helping you identify areas where performance falls short or exceeds expectations.
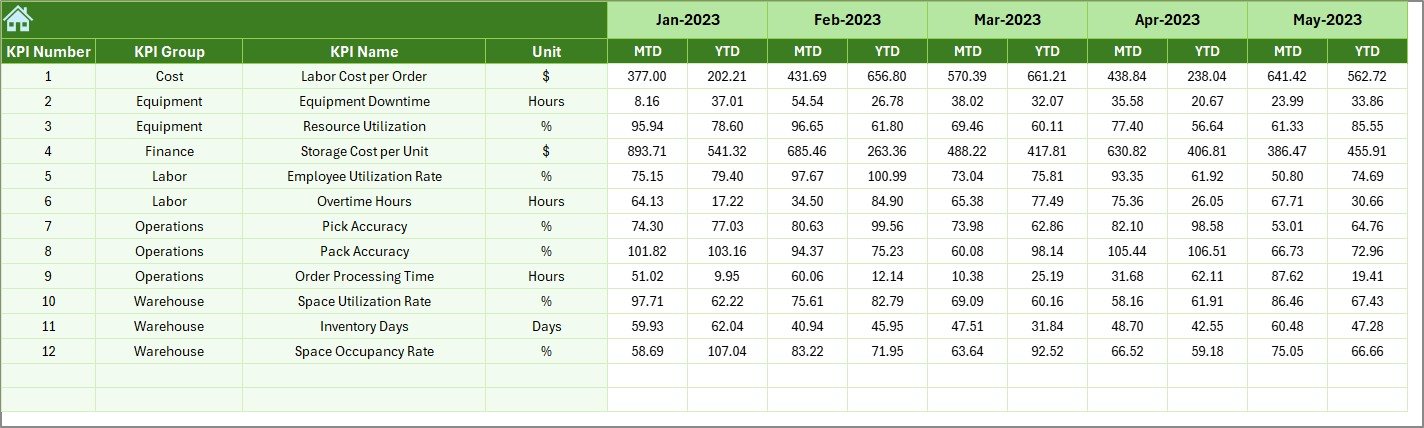
Previous Year Numbers Sheet Tab
-
Purpose: Stores last year’s performance figures for benchmarking.
-
Structure: Same as the Actual Numbers and Targets sheets.
-
Why It Matters: Year-over-year comparisons help you assess growth, seasonality, and market shifts.
KPI Definition Sheet Tab
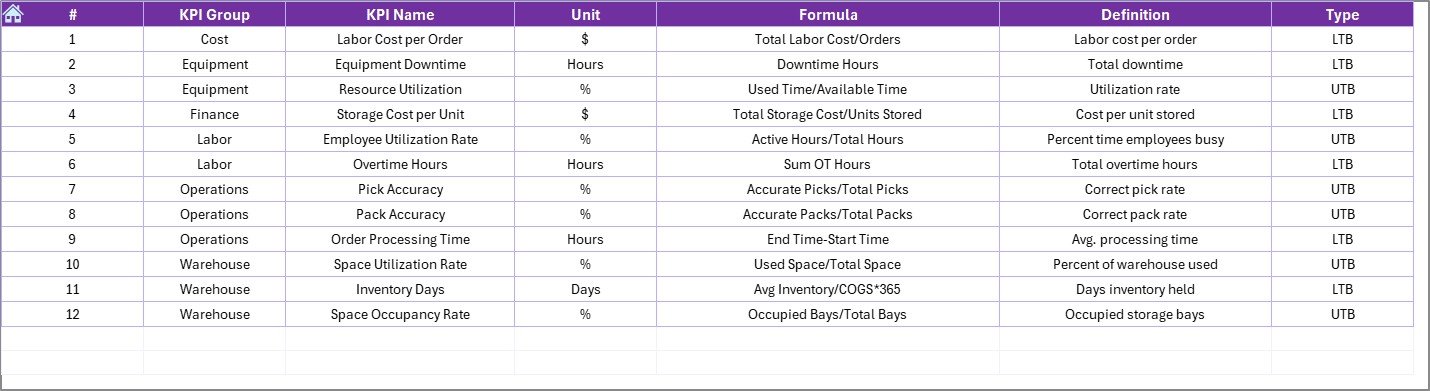
-
Purpose: Defines each KPI for consistency and clarity.
Columns:
- KPI Name
- KPI Group (e.g., Fulfillment, Customer Service)
- Unit (e.g., $, %, seconds)
- Formula (e.g., Sales ÷ Ad Spend)
- Definition (concise description of what it measures)
-
Why It Matters: When team members understand exactly how a KPI calculates and why it matters, they trust the data—and they take action more confidently.
Click to Purchases Retail and E-commerce Resource Allocation KPI Dashboard in Excel
Advantages of the Retail and E-commerce Resource Allocation KPI Dashboard in Excel
-
Cost-Effective Solution
Since most organizations already have Excel, you avoid expensive BI subscriptions. -
Rapid Deployment
With a ready-made template, you start tracking KPIs within minutes, not weeks. -
Fully Customizable
You add, remove, or rename KPIs; change colors; and integrate additional charts without coding. -
Interactive Filters
Drop-down selectors empower both executives and frontline managers to view only the data they need. -
Consistent Reporting
By centralizing data inputs and definitions, the dashboard ensures everyone speaks the same performance language. -
Scalable Design
Later, you can link this dashboard to Power Query or Power BI for automated data refreshes and advanced visualizations. -
Active Collaboration
Share the file via OneDrive or Teams so multiple users can update inputs and review findings simultaneously.
Best Practices for the Retail and E-commerce Resource Allocation KPI Dashboard
-
Standardize Data Entry
-
Use consistent units (dollars, units, percentages).
-
Lock formula cells and protect sheets to prevent accidental changes.
-
-
Set Realistic Targets
-
Base monthly targets on historical performance plus growth expectations.
-
Review and adjust targets quarterly to account for market changes.
-
-
Update Data Promptly
-
Assign clear ownership for daily or weekly data inputs.
-
Automate data imports from your ERP or CRM when possible.
-
-
Train Your Team
-
Host a quick walkthrough demonstrating how to change months, interpret arrows, and drill into trends.
-
Provide a short user guide or embed comments in the file.
-
-
Review KPIs Periodically
-
Ensure each KPI remains relevant—remove outdated metrics and add new ones as strategies evolve.
-
Tie KPI ownership to specific roles (e.g., Marketing Manager for Ad Spend Efficiency).
-
-
Use Conditional Alerts
-
Extend the template by adding color-coded flags for critical thresholds (e.g., red background if conversion rate dips below 2%).
-
-
Archive Historical Snapshots
-
Save monthly “freeze” copies of the dashboard (as PDF or Excel) to create an audit trail and spot long-term trends.
-
-
Leverage Excel’s Advanced Features
-
Incorporate Power Pivot for handling larger datasets.
-
Use Data Validation to enforce correct inputs and drop-down lists for KPI selection.
-
How to Customize the Dashboard for Your Business Needs
-
Add New KPIs
-
Navigate to the KPI Definition sheet.
-
Insert a new row, define the KPI name, group, unit, formula, and description.
-
Update the Actual, Target, and PY sheets with corresponding columns.
-
-
Change the Fiscal Year
-
On the Actual Numbers sheet, set cell E1 to your fiscal start month (e.g., “Apr-2025”).
-
Ensure all date headers on input sheets align with your fiscal calendar.
-
-
Modify Chart Styles
-
Right-click any chart and choose “Chart Design” to adjust axes, series colors, and labels.
-
Save your preferred style as a template for consistency.
-
-
Incorporate Additional Data
-
If you track online vs. in-store sales separately, add separate KPIs or use slicers to filter data by channel.
-
-
Automate Data Imports
-
Use Power Query to connect directly to your sales database or CSV exports.
-
Refresh queries weekly to minimize manual inputs.
-
Conclusion
By implementing the Retail and E-commerce Resource Allocation KPI Dashboard in Excel, you gain a dynamic tool that aligns your team around clear goals, highlights performance gaps, and uncovers actionable insights—all within the familiar Excel environment. Moreover, the template’s modular design ensures you can start small and scale up as your data needs evolve. Consequently, you save time on manual reporting and focus on what matters most: optimizing resource allocation to drive growth and profitability.
Frequently Asked Questions
Q1: How do I add a new KPI to the dashboard?
To add a new metric, first enter its details—name, group, unit, formula, and definition—on the KPI Definition sheet. Then, add matching columns for that KPI on the Actual Numbers, Targets, and Previous Year Numbers sheets. Finally, update any drop-down lists on the Dashboard and KPI Trend sheets to include the new KPI.
Q2: Can I share this dashboard with team members?
Yes. Store the file on a shared OneDrive or SharePoint folder. Then, grant edit permissions to collaborators. For real-time collaboration, open the file in Excel for the web so multiple users can work simultaneously.
Q3: What if my fiscal year starts in April instead of January?
On the Actual Numbers Input sheet, change cell E1 to your fiscal start month (e.g., “Apr-2025”). Ensure all subsequent month headers align in sequence. The dashboard will then reference the correct period.
Q4: How do I automate data entry from our ERP system?
Use Excel’s Data > Get Data > From Database (Power Query) to connect to your ERP. Define queries that pull actuals, targets, and last year’s figures. Then, map the query outputs to the respective input sheets.
Q5: Can I convert this Excel dashboard into Power BI?
Absolutely. Export the KPI Definition, Actual, Target, and PY sheets as tables. Import them into Power BI Desktop, recreate the relationships, and rebuild visuals using similar measures. You’ll benefit from automated refreshes and advanced filtering.
Q6: How often should I review and update targets?
Best practice calls for quarterly reviews. Market conditions, seasonality, and strategic shifts may necessitate adjusting targets every three months. However, if you operate in a highly volatile industry, consider monthly reviews.
Visit our YouTube channel to learn step-by-step video tutorials
Click to Purchases Retail and E-commerce Resource Allocation KPI Dashboard in Excel