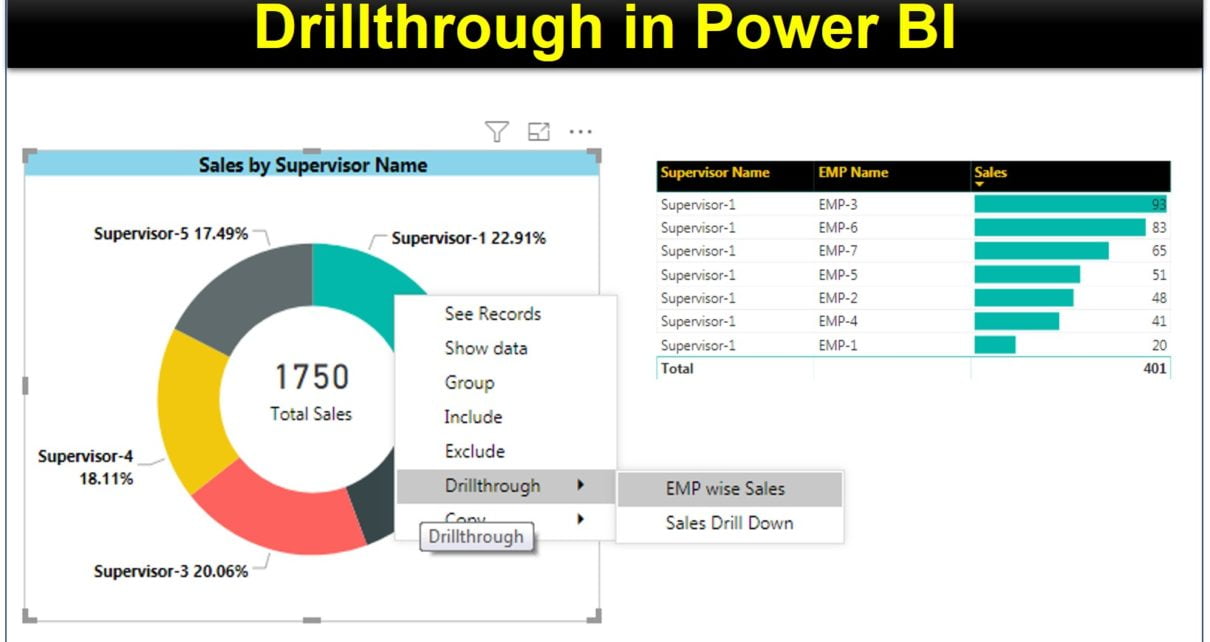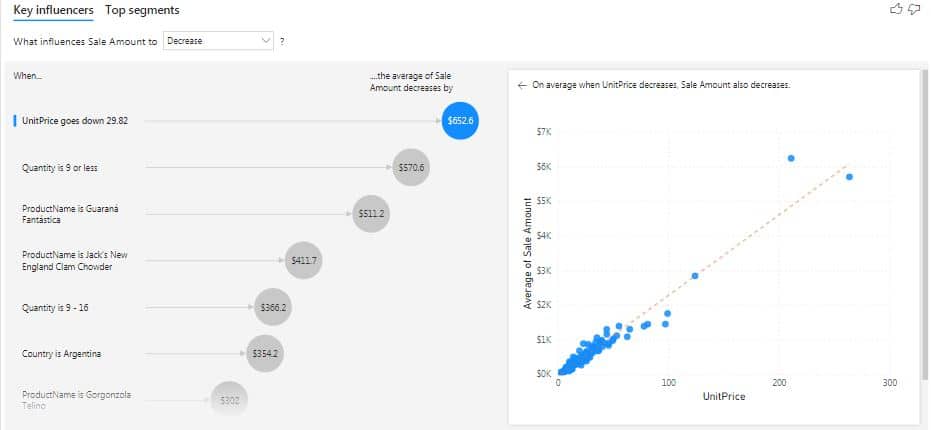
Artificial Intelligence based visuals in Power BI
In this article, we have explained the various Artificial Intelligence based visuals in Power BI. Using these visuals you can make your Power BI dashboard more powerful. What is an
Transforming Data into Decisions