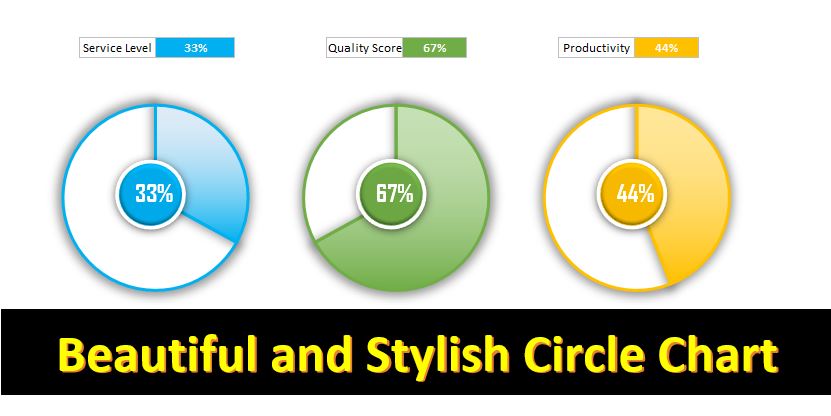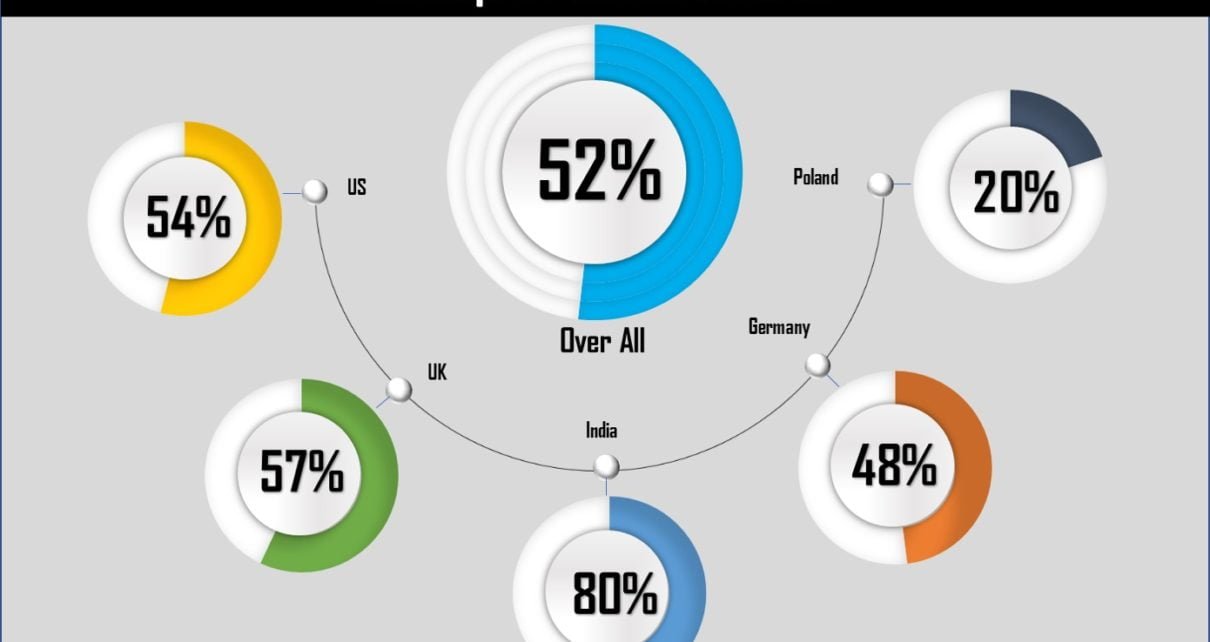
Group of Circle Charts in Excel
Using the multiple Doughnut charts, we have created a beautiful Group of circle charts. In this chart, we have displayed Market level and Over all service level. You can use
Transforming Data into Decisions