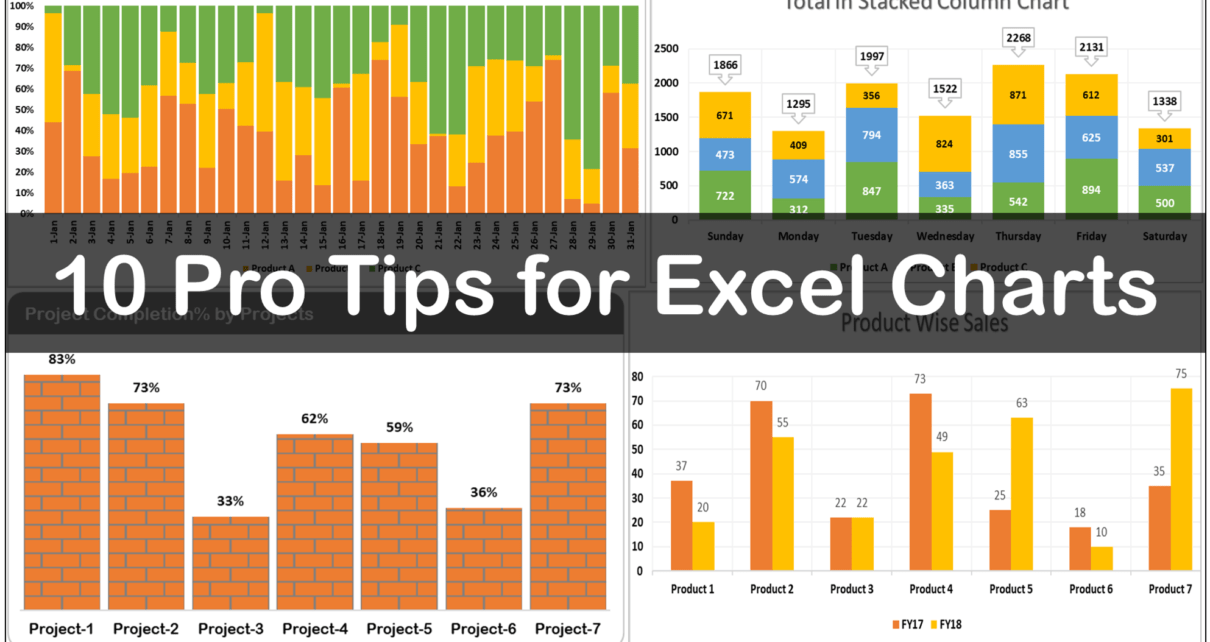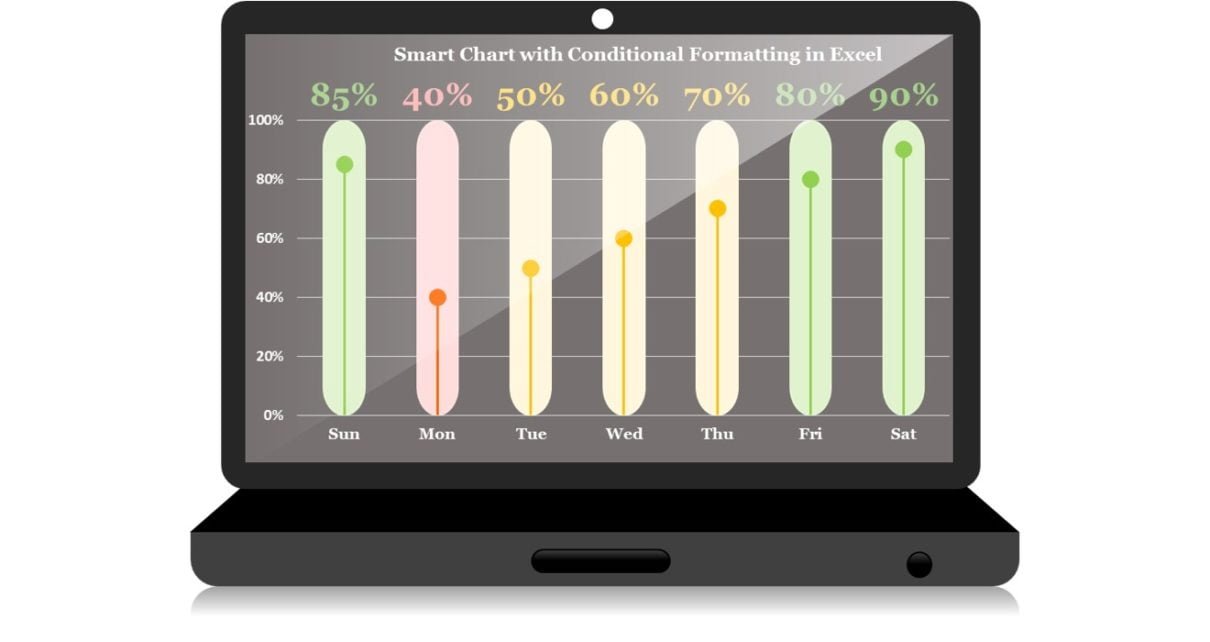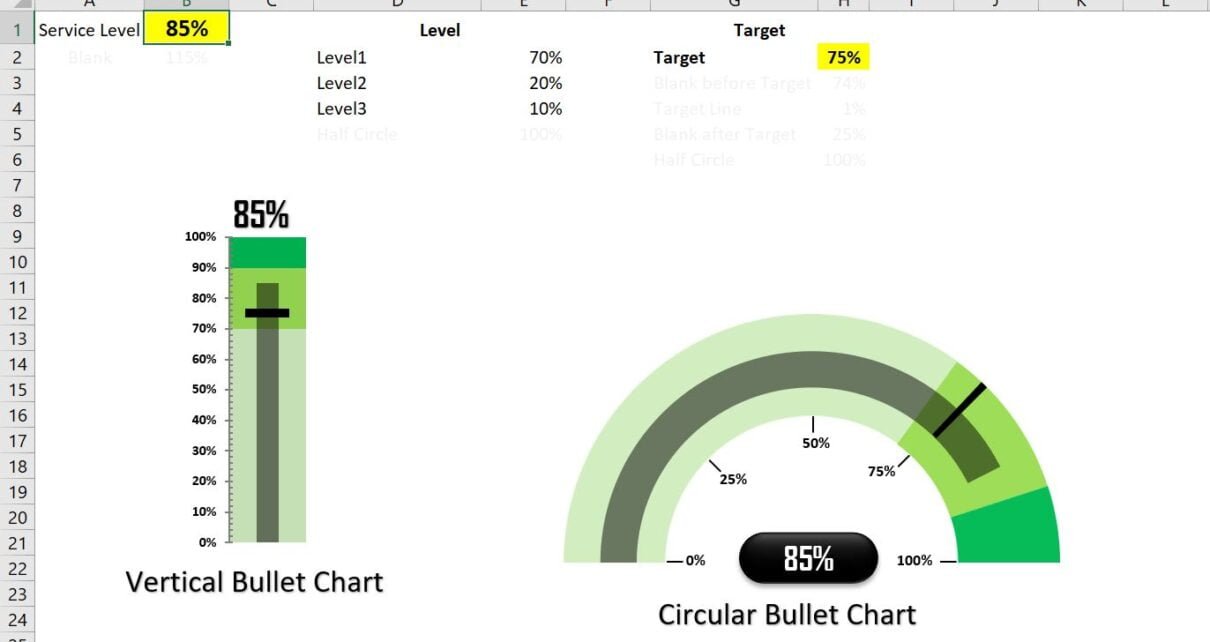
Vertical and Circular Bullet Chart in Excel
In this article, we have created Vertical and Circular Bullet chart in Excel with 3 levels of color. We have displayed the Target point also in this chart. You can
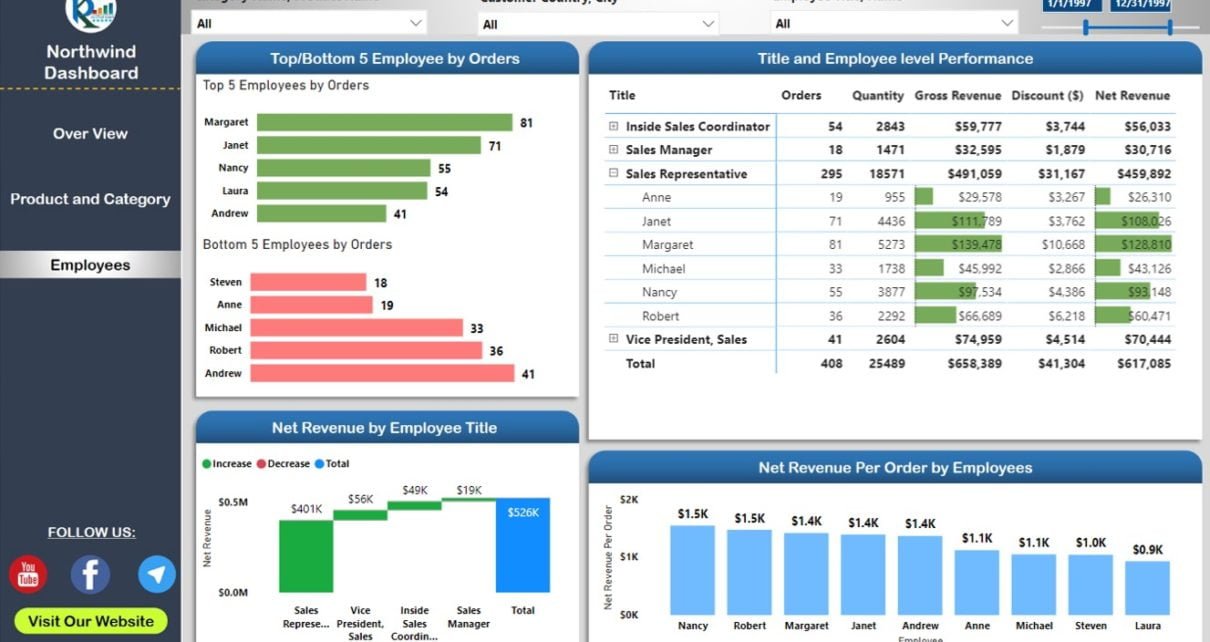
Transforming Data into Decisions