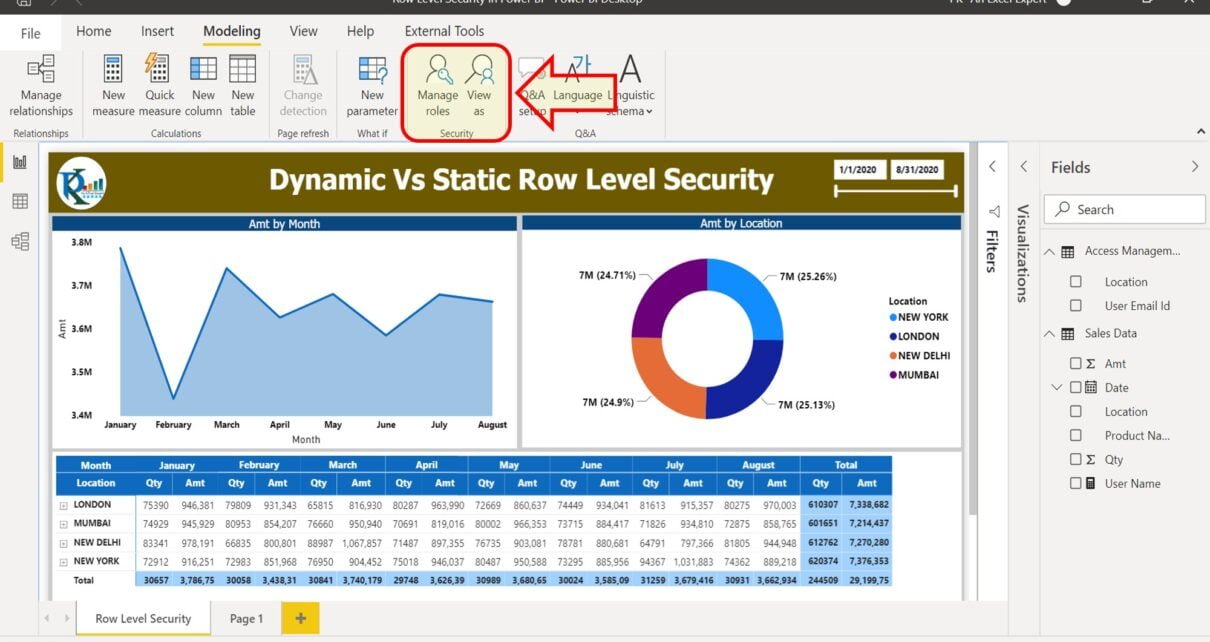
Static and Dynamic Row Level Security in Power BI
Row level security with Power BI is used to restrict data access for particular users. Filters restrict data access at the row level, which are defined within roles in Power
Transforming Data into Decisions
This category provides comprehensive tutorials on creating dynamic and insightful visualizations with Power BI. Whether you need to analyze complex data sets or create interactive dashboards, our tutorials will guide you through the process. Each tutorial comes with a free practice file for download and tutorial videos to help you follow along easily. Start your Power BI tutorial now and learn how to create engaging and informative reports. Impress your colleagues and boss with your data visualization and analysis skills by exploring this category today.