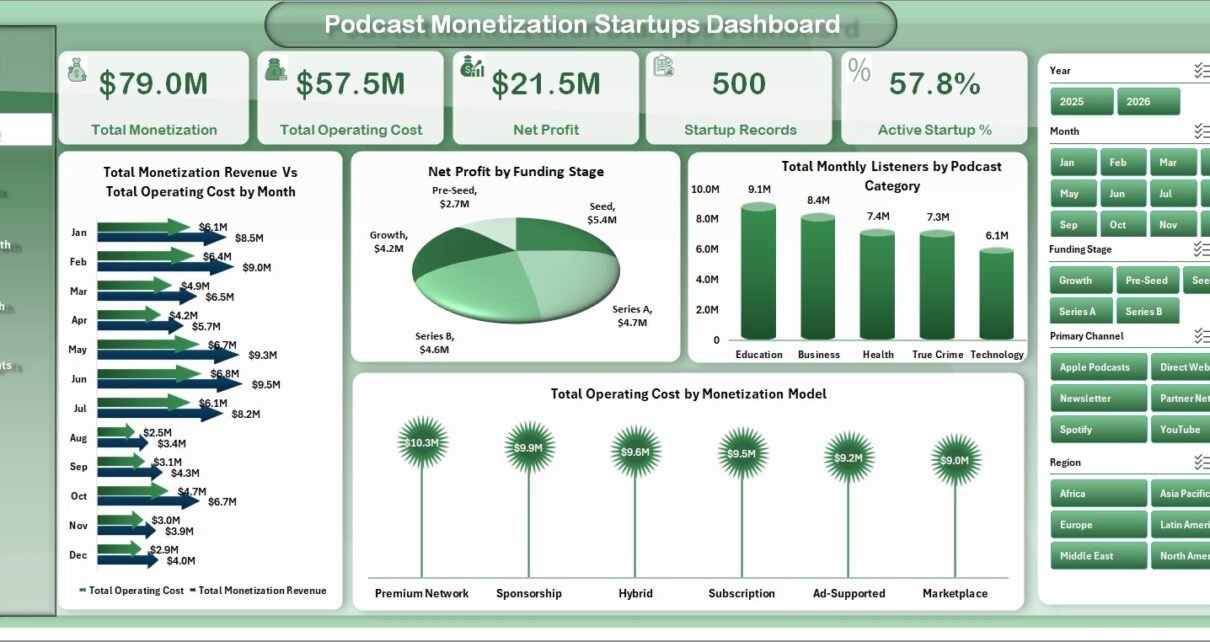
Podcast startups create monetization data from sponsorships, paid subscribers, ad revenue, memberships, affiliate deals, live events, and operating costs. A small podcast business with 10 shows, 5 monetization models, and monthly listener records can create hundreds of data points each year. The Podcast Monetization Startups Dashboard in Excel turns those records into a 7-sheet reporting workbook with KPI cards, slicers, charts, a structured Data Sheet, and a pivot-powered Support Sheet.
This Excel dashboard is built for podcast founders, creator economy teams, media startups, podcast agencies, and investor reporting teams that want a repeatable way to review monetization, cost, net profit, listener growth, paid subscribers, category performance, and startup health. You can replace the sample data, click Data > Refresh All, and review the updated dashboard pages without rebuilding the workbook.
Microsoft explains the Excel pivot refresh workflow here: Refresh PivotTable data.
Click here to purchase Podcast Monetization Startups Dashboard in Excel
Key Features of Podcast Monetization Startups Dashboard in Excel
5 executive KPI cards: The Overview page tracks Total Monetization, Total Operating Cost, Net Profit, Startup Records, and Active Startup %. These cards help leaders see revenue, cost, profit, operating scale, and active startup status quickly.
5 analytical dashboard pages: The workbook includes Overview, Revenue Mix, Audience Growth, Startup Health, and Category Insights. Each page answers a different question about revenue, audience growth, operating cost, startup condition, or podcast category strategy.
18 chart views: The dashboard includes views for monetization revenue, operating cost, net profit, monthly listeners, paid subscribers, subscriber conversion, customer rating, funding stage, podcast category, region, primary channel, monetization model, episodes published, month, and quarter.
Interactive slicers: Slicers help users filter the workbook by the fields available in the data, such as category, region, month, channel, funding stage, monetization model, status, or startup name.
Excel-native refresh: The Support Sheet contains pivot tables behind the charts. After updating the Data Sheet, users can click Data > Refresh All and the pivots, charts, and KPI cards update together.
Dashboard Pages Explanation
1. Overview Page
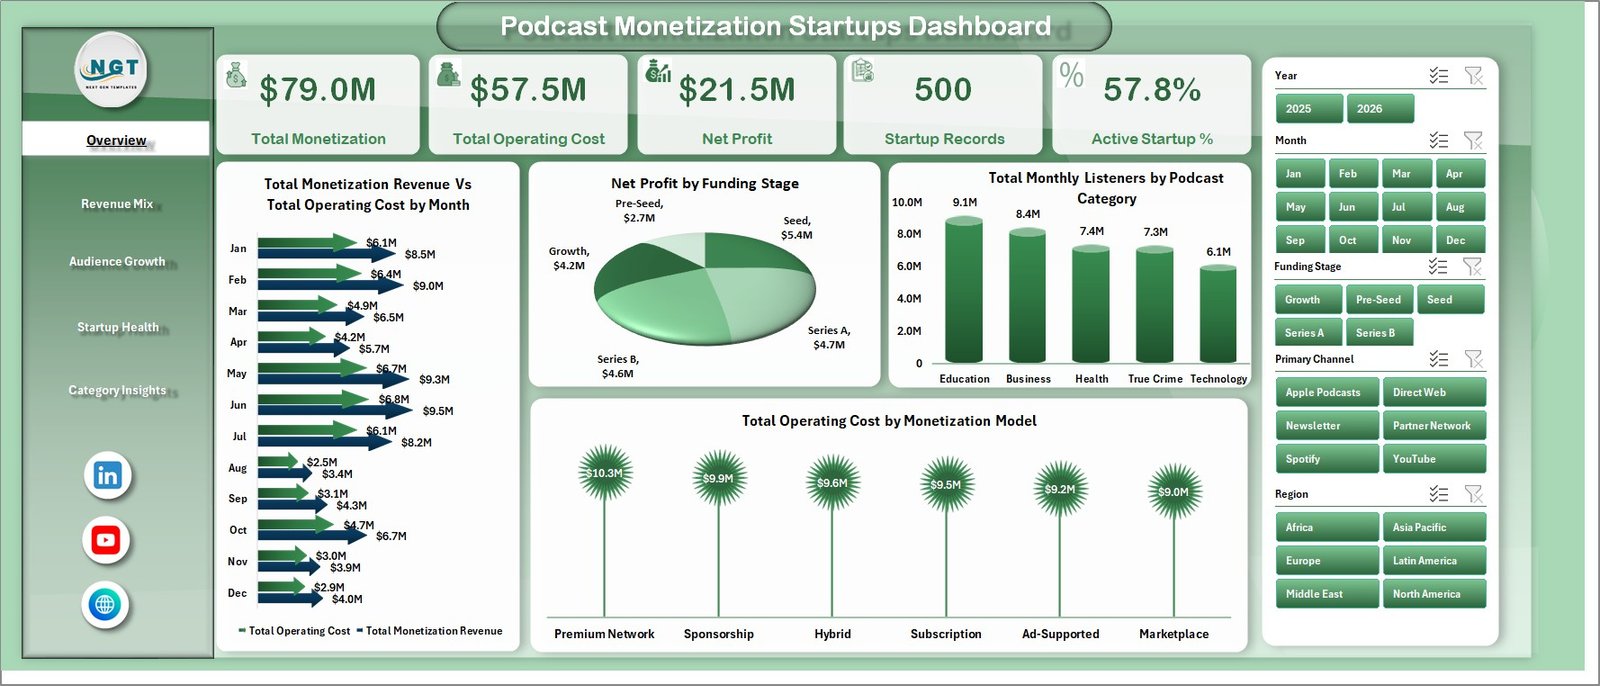
The Overview page is the main executive summary of the Podcast Monetization Startups Dashboard in Excel. The top cards show Total Monetization, Total Operating Cost, Net Profit, Startup Records, and Active Startup %, so users can quickly evaluate whether podcast startups are growing profitably.
Total Monetization Revenue Vs Total Operating Cost by Month: This chart compares monthly revenue and monthly operating cost in one view. It helps identify whether cost is rising faster than monetization or whether profit quality is improving over time.
Net Profit by Funding Stage: This chart compares net profit by funding stage. It is useful for accelerators, investors, and founders who need to compare startup maturity with commercial outcome.
Total Monthly Listeners by Podcast Category: This chart shows which podcast categories attract the largest monthly audience. It helps teams decide where to invest in content production, sponsor packages, and audience growth.
Total Operating Cost by Monetization Model: This chart compares operating cost across monetization models. It helps separate revenue models that scale efficiently from models that need more production, sales, or platform cost.
Podcast Monetization Startups Dashboard in Excel
2. Revenue Mix
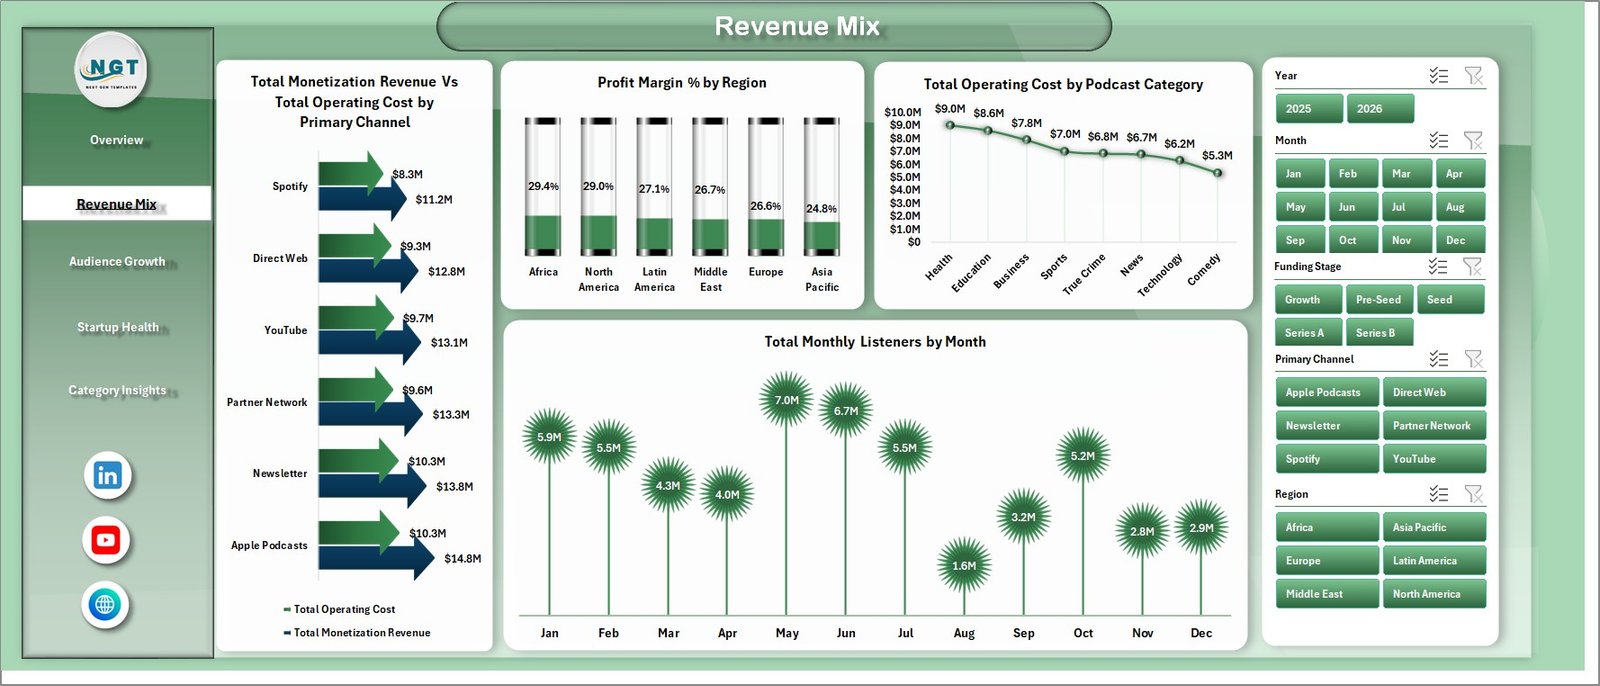
The Revenue Mix sheet focuses on monetization, operating cost, margin, category cost, and listener trend analysis. It includes Total Monetization Revenue Vs Total Operating Cost by Primary Channel, Profit Margin % by Region, Total Operating Cost by Podcast Category, and Total Monthly Listeners by Month.
This page is useful for budget reviews because it shows whether a channel creates profitable revenue or simply adds top-line activity. It also helps compare regions and categories when deciding where to grow next.
Revenue Mix
3. Audience Growth
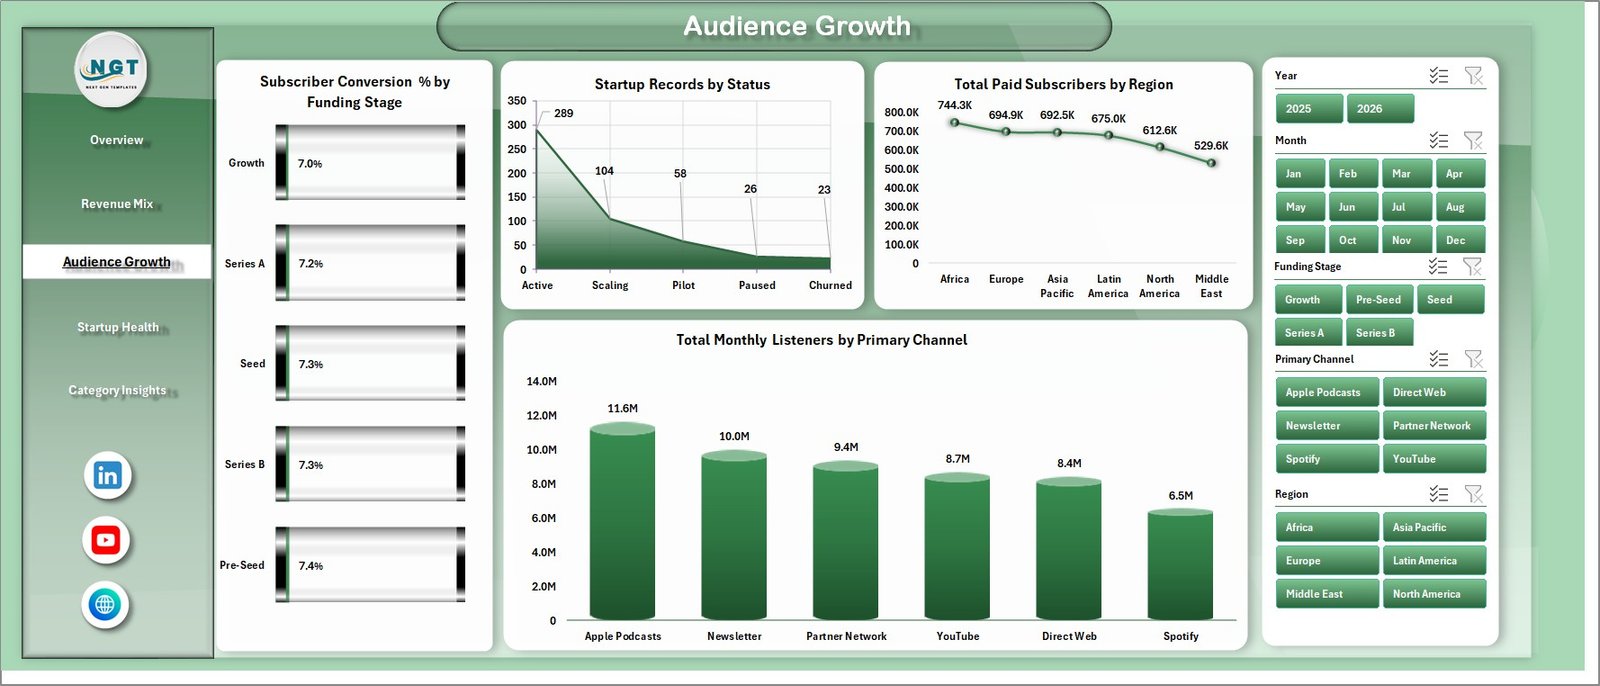
The Audience Growth sheet connects listener demand with paid subscriber outcomes. It includes Subscriber Conversion % by Funding Stage, Startup Records by Status, Total Paid Subscribers by Region, and Total Monthly Listeners by Primary Channel.
Use this page when you want to understand whether audience reach is becoming paid subscriber growth. It can also help compare active, paused, scaling, or inactive startups by status.
Audience Growth
4. Startup Health
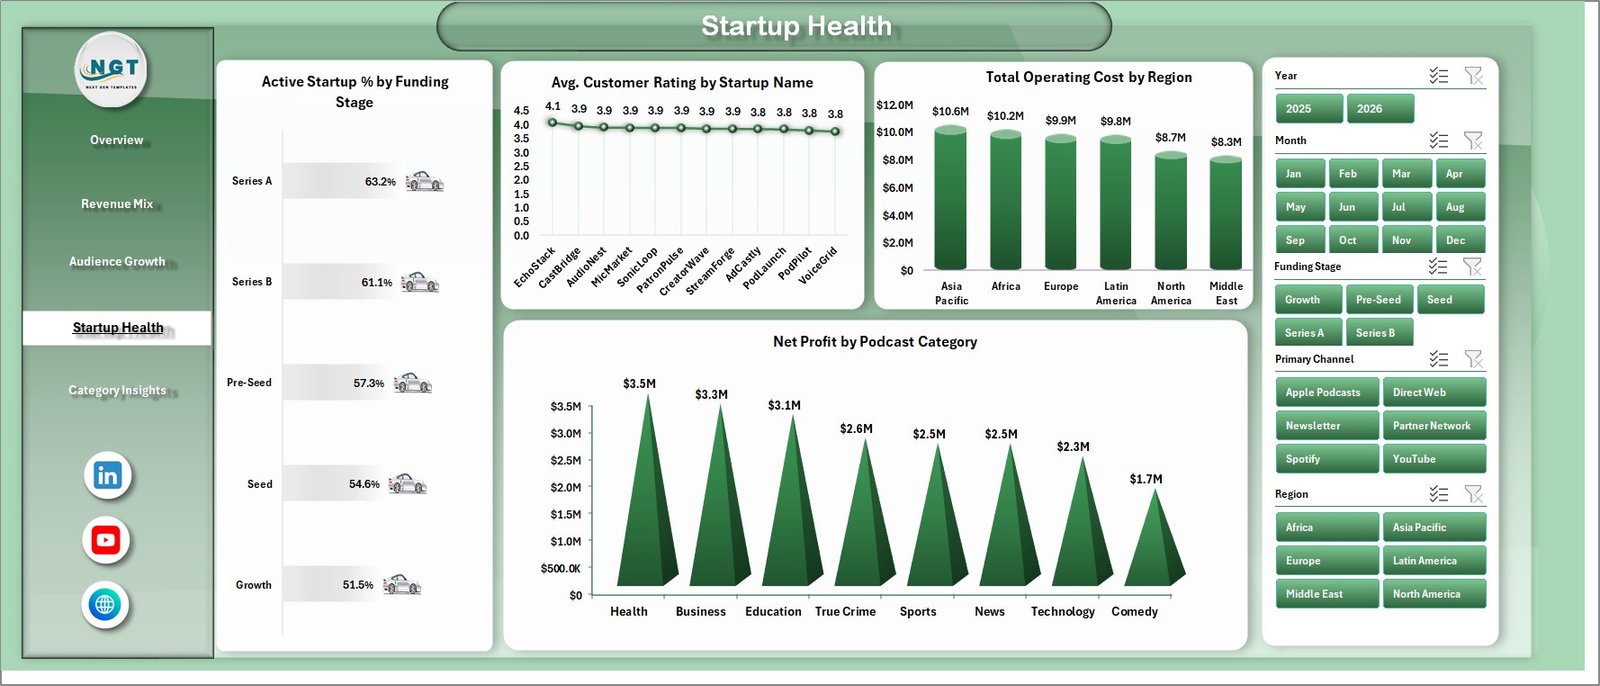
The Startup Health sheet reviews operational health across funding stage, startup name, region, and podcast category. It includes Active Startup % by Funding Stage, Avg. Customer Rating by Startup Name, Total Operating Cost by Region, and Net Profit by Podcast Category.
This page is useful for portfolio reviews and founder scorecards. It helps identify where operating cost is concentrated, which startup names receive stronger ratings, and which podcast categories produce better net profit.
Startup Health
5. Category Insights
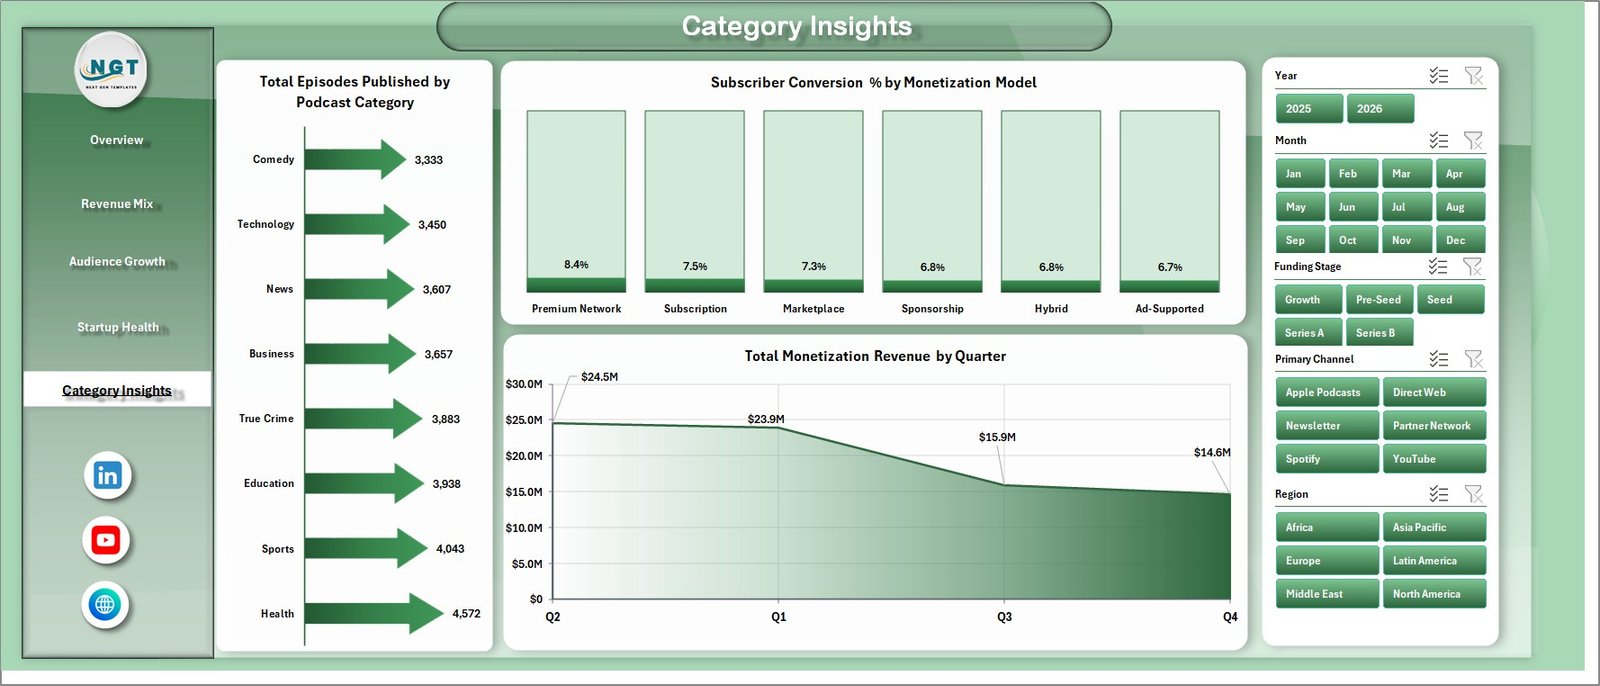
The Category Insights sheet focuses on content output, monetization model conversion, and quarterly revenue movement. It includes Total Episodes Published by Podcast Category, Subscriber Conversion % by Monetization Model, and Total Monetization Revenue by Quarter.
This page helps teams decide whether publishing volume is aligned with commercial performance. It also supports quarterly reviews of model-level conversion and category strategy.
Category Insights
6. Data Sheet Tab
The Data Sheet is where users add podcast monetization startup records in the same format as the sample data. Keeping the same column structure is important because the pivot tables, charts, KPI cards, and slicers depend on that structured source.

Data Sheet tab
7. Support Sheet Tab
The Support Sheet contains multiple pivot tables used to create the entire dashboard dynamically. After updating the Data Sheet, go to the Data tab in the Excel Ribbon and click Refresh All. The pivots and dashboard charts will refresh, and this sheet can stay hidden during normal use.

Support sheet tab
Podcast Monetization Startups Dashboard in Excel vs. Google Sheets vs. Paid CRM/SaaS – Feature Comparison
| Feature | Podcast Monetization Startups Dashboard in Excel | Google Sheets Dashboard | Paid Podcast SaaS |
|---|---|---|---|
| Cost | $17.99 one-time | Low template cost, more manual setup | $20-$300+ per month |
| Platform | Microsoft Excel | Browser-based Google Sheets | Vendor cloud platform |
| Setup time | Replace records and refresh pivots | Copy sheet and adjust data ranges | Requires onboarding or integrations |
| Real-time team collaboration | Best through OneDrive or SharePoint | Native Google Drive sharing | Usually seat-based |
| Mobile access | Excel mobile with limitations | Google Sheets mobile app | Usually included |
| Customizable fields | Fully editable workbook | Editable sheet structure | Limited by vendor settings |
| Share with link | Available through Microsoft sharing | Native link sharing | Depends on paid access |
| Year-1 cost at 5 users | $17.99 plus Excel licensing if needed | Template cost plus Google account | Often hundreds or thousands per year |
| Podcast monetization views | Included across revenue, cost, profit, subscribers, listeners, funding, model, and category pages | Depends on the sheet design | Often split across hosting, ad, and subscription tools |
Who Should Use This Template
This template is a good fit for podcast startup founders, creator economy operators, media startup teams, podcast network managers, podcast agencies, accelerators, and investor reporting teams. It works best when you already maintain structured podcast monetization data and want an Excel-based reporting layer.
It is not the right fit if you need live ad serving, podcast hosting, automated platform imports, CRM follow-up, accounting, payment processing, or IAB-certified feed analytics. This is a dashboard template, not a transaction or attribution platform.
Real-World Use Cases
Maya, podcast startup founder: Maya uses the Overview and Revenue Mix pages before monthly planning. She checks whether revenue growth is stronger than operating cost growth and whether net profit is improving by funding stage.
Rahul, creator economy analyst: Rahul reviews Subscriber Conversion % by Monetization Model and Total Monetization Revenue by Quarter to prepare a quarterly investor update for a portfolio of podcast startups.
Elena, podcast agency manager: Elena updates the Data Sheet for each client, clicks Refresh All, and uses Audience Growth and Startup Health pages in monthly reporting calls.
Advantages of Podcast Monetization Startups Dashboard in Excel
The main advantage is speed. You do not need to design pivot tables, KPI cards, slicers, or chart pages from scratch. The workbook gives you a prepared structure for monetization, operating cost, net profit, listeners, paid subscribers, funding stage, category, and region analysis.
Another advantage is ownership. Your data stays in Excel, and the workbook can be edited as your podcast startup reporting needs change. You can add new categories, duplicate views, adjust chart labels, and save monthly copies without relying on a software vendor.
Opportunities for Improvement
The dashboard becomes more useful when the source data is clean and consistent. Standardize podcast category names, monetization model names, regions, status values, and startup names before updating the Data Sheet. Advanced users can also add Power Query imports if they regularly receive CSV exports from multiple platforms.
Best Practices
Update the Data Sheet on a consistent schedule, preferably weekly or monthly. Keep the same column structure, avoid blank key fields, and use consistent names for channels, categories, regions, funding stages, monetization models, and startup statuses.
After every update, click Refresh All from the Excel Data ribbon. Review the Overview first, then move into Revenue Mix, Audience Growth, Startup Health, and Category Insights for deeper analysis.
Explore Relevant Templates
- Podcast Audience Insights Dashboard in Google Sheets
- Content Personalization Startups Dashboard in Excel
- Audio Streaming Services Dashboard in Excel
- Excel Dashboard Templates
Frequently Asked Questions
What does the Podcast Monetization Startups Dashboard in Excel track?
It tracks total monetization, total operating cost, net profit, startup records, active startup percentage, monthly listeners, paid subscribers, conversion percentage, funding stage, startup status, region, primary channel, podcast category, monetization model, customer rating, episodes published, month, and quarter.
How many sheets are included?
The workbook includes Overview, Revenue Mix, Audience Growth, Startup Health, Category Insights, Data Sheet, and Support Sheet tabs.
How do I update the dashboard?
Replace the sample records in the Data Sheet, keep the same format, and click Refresh All from the Excel Data ribbon.
Does the dashboard use macros?
No. It uses native Excel tables, pivot tables, slicers, and charts.
Can I use this for multiple podcast startups?
Yes. The dashboard includes startup records, startup name, status, funding stage, region, category, and monetization model analysis, so it can support multi-startup reporting.
Is the Support Sheet required?
Yes. The Support Sheet powers the dashboard through pivot tables. You can keep it hidden, but it should remain in the workbook.
Does this replace podcast analytics software?
No. It is for management reporting and analysis. It does not host podcasts, serve ads, automate attribution, or ingest live platform data.
About the Author
Built by PK – Microsoft Certified Professional with 15+ years of Excel, Google Sheets, and Power BI experience. Founder of NextGenTemplates, reaching 300K+ subscribers across YouTube channels. Every template is hand-built and tested before release.
Conclusion
The Podcast Monetization Startups Dashboard in Excel gives podcast startup teams a practical way to review monetization, cost, profit, listeners, paid subscribers, startup health, and category performance from one workbook. With 5 KPI cards, 5 dashboard pages, a Data Sheet, and a pivot-driven Support Sheet, it turns structured records into decision-ready analysis.
Visit our YouTube channel for step-by-step Excel tutorials: Youtube.com/@PKAnExcelExpert
Click here to purchase Podcast Monetization Startups Dashboard in Excel