In today’s fast-paced educational environment, schools, training centers, and academic institutions constantly strive to improve their learning processes. But how can they accurately measure and enhance their performance? The answer lies in using Key Performance Indicators (KPIs) through a dynamic and easy-to-use Education and Learning Process Improvement KPI Dashboard in Excel.
This article will guide you step-by-step through this powerful Excel-based dashboard, explain its benefits, best practices, and answer your common questions. Whether you are an educator, administrator, or policy-maker, this tool can transform how you track and improve educational outcomes.
Click to Purchases Education and Learning Process Improvement KPI Dashboard in Excel
What is an Education and Learning Process Improvement KPI Dashboard?
An Education and Learning Process Improvement KPI Dashboard is an Excel tool designed to help schools and learning organizations track essential metrics that influence academic success. It monitors monthly trends, targets vs. actuals, and year-over-year performance for various KPIs.
This dashboard uses Excel’s flexibility and functionality to provide interactive features, visual charts, slicers, and well-structured sheets to make performance evaluation both easier and more insightful.
Key Features of the Dashboard
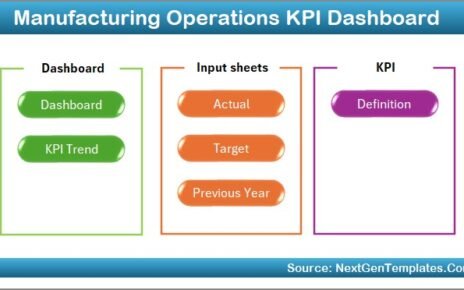
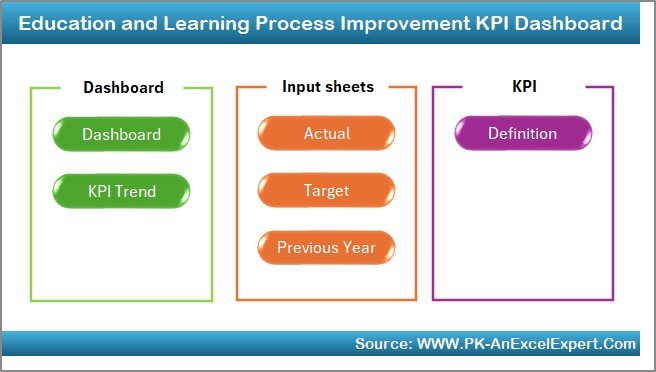
This ready-to-use dashboard consists of 7 structured worksheets, each serving a unique function:
Home Sheet
- Acts as an index with 6 navigation buttons.
- Allows quick access to other sheets like Dashboard, KPI Trend, and Input Sheets.
Click to Purchases Education and Learning Process Improvement KPI Dashboard in Excel
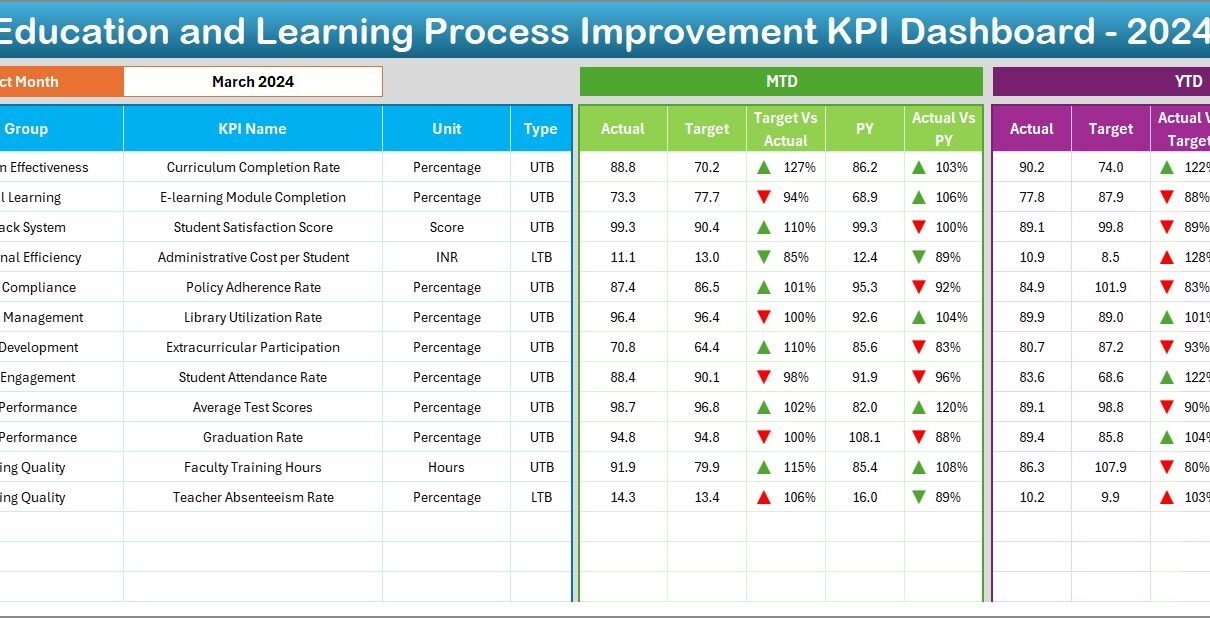
Dashboard Sheet
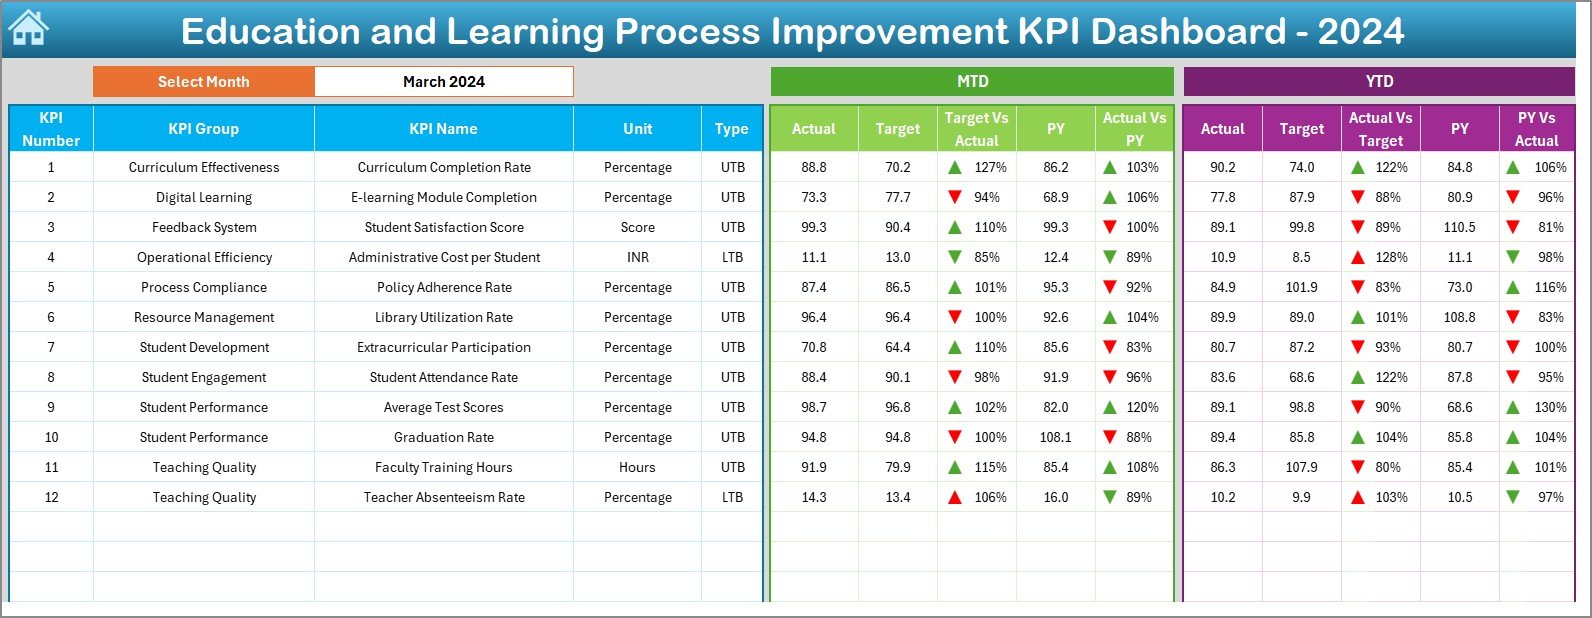
- Central hub to view all KPIs in one place.
- Select the month in cell D3 to auto-update the entire dashboard.
Displays:
- MTD (Month-to-Date) Actual, Target, Previous Year
- YTD (Year-to-Date) Actual, Target, Previous Year
- Conditional formatting with up/down arrows for quick visual interpretation
KPI Trend Sheet
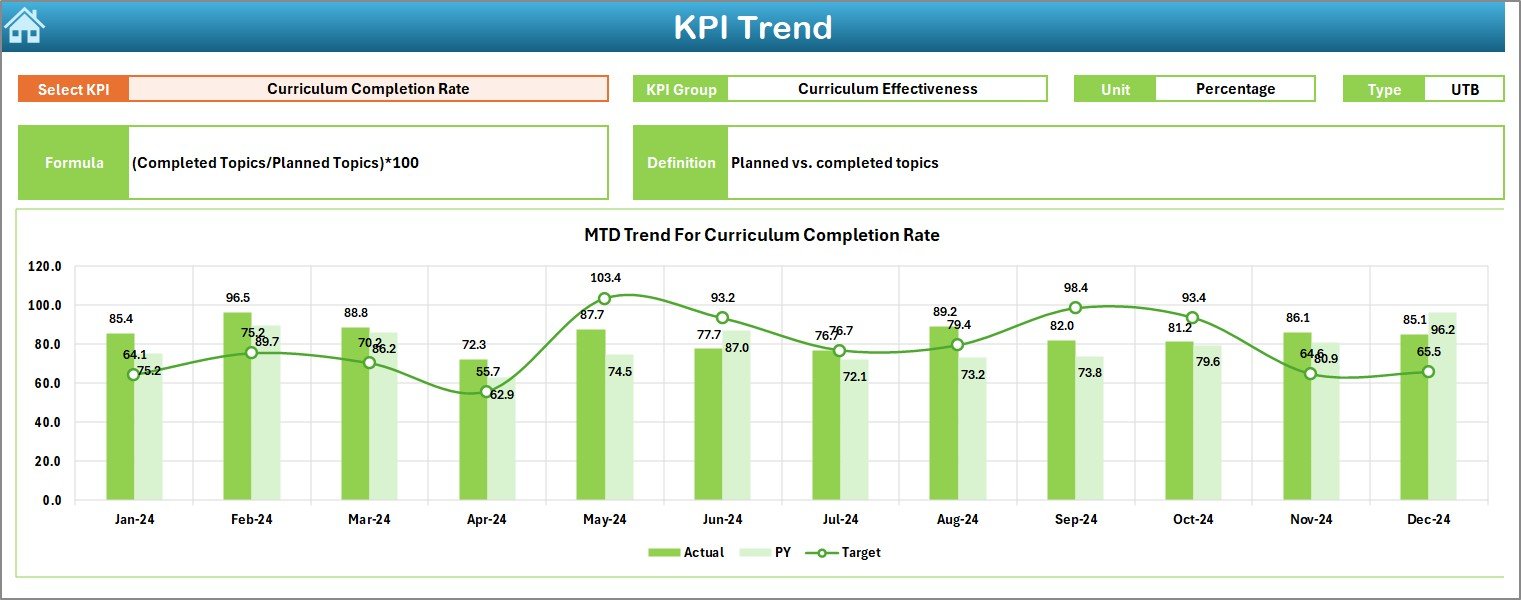
- Drop-down in cell C3 lets you select any KPI.
- View KPI Group, Unit, Type (LTB/UTB), Formula, and Definition.
- Displays MTD and YTD trend charts.
Click to Purchases Education and Learning Process Improvement KPI Dashboard in Excel
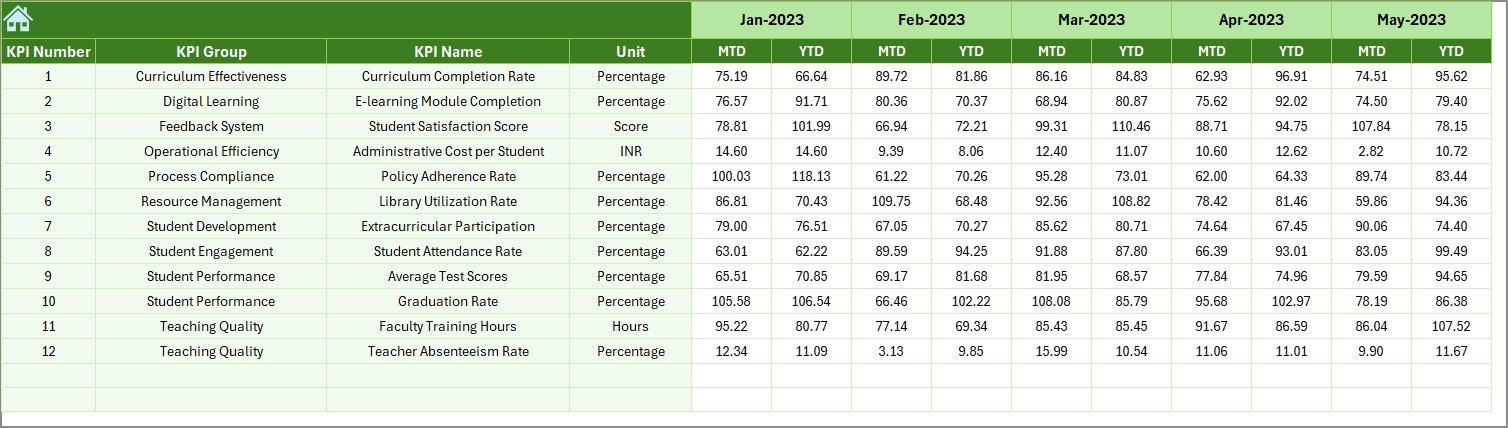
Actual Numbers Input Sheet
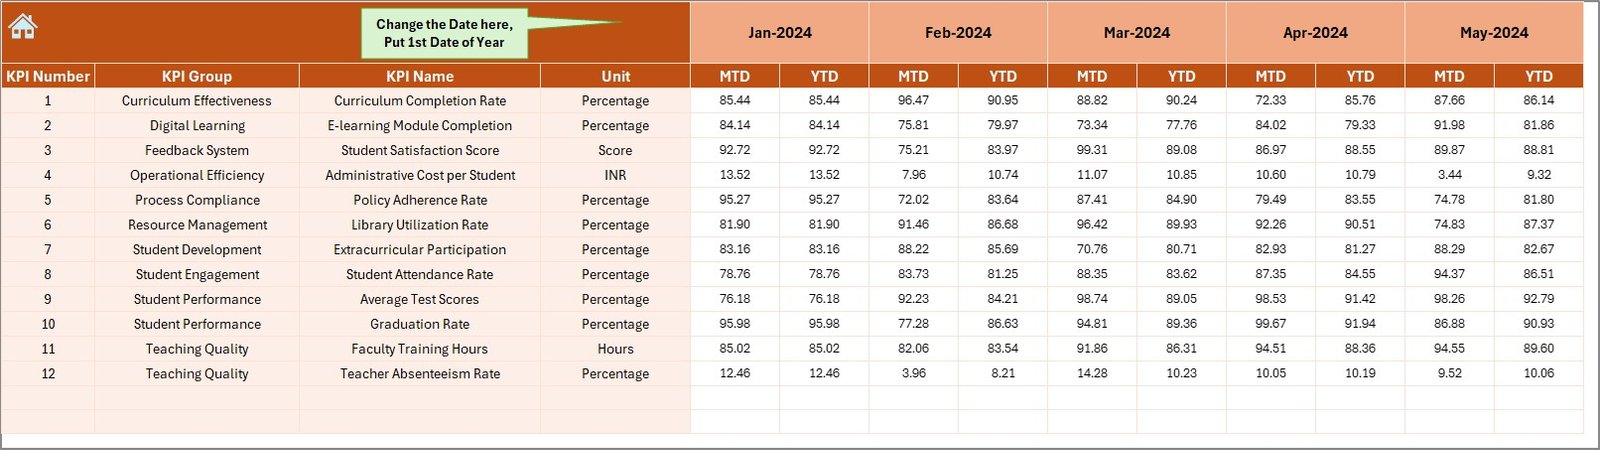
- Enter actual MTD and YTD values by selecting the starting month in cell E1.
- Organized input area for seamless data updates.
Target Sheet
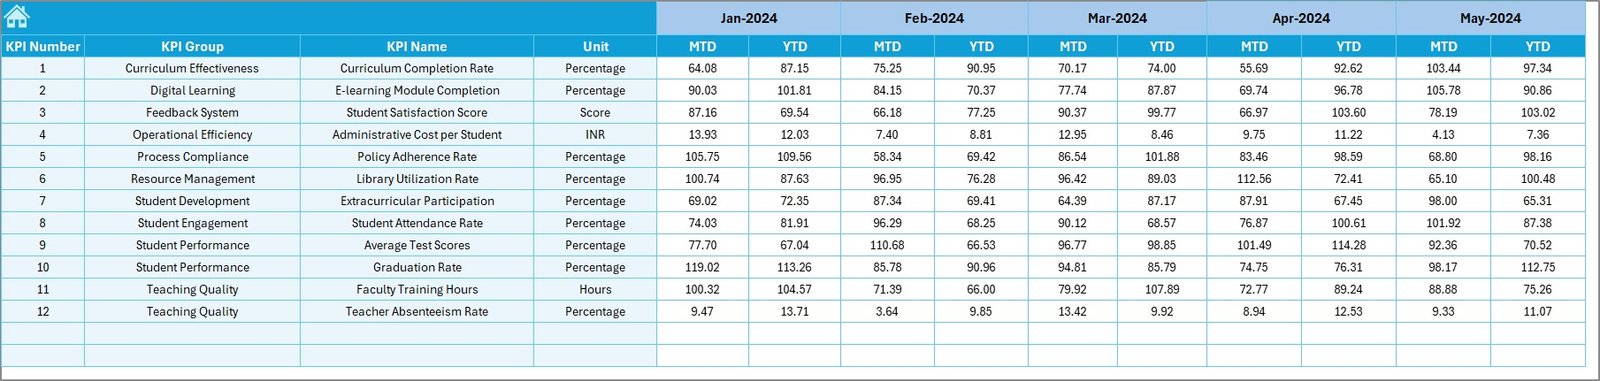
- Input monthly target values for each KPI.
- Tracks both MTD and YTD performance expectations.
Previous Year Numbers Sheet
- Capture the previous year’s values for each KPI.
- Enables year-over-year analysis.
KPI Definition Sheet
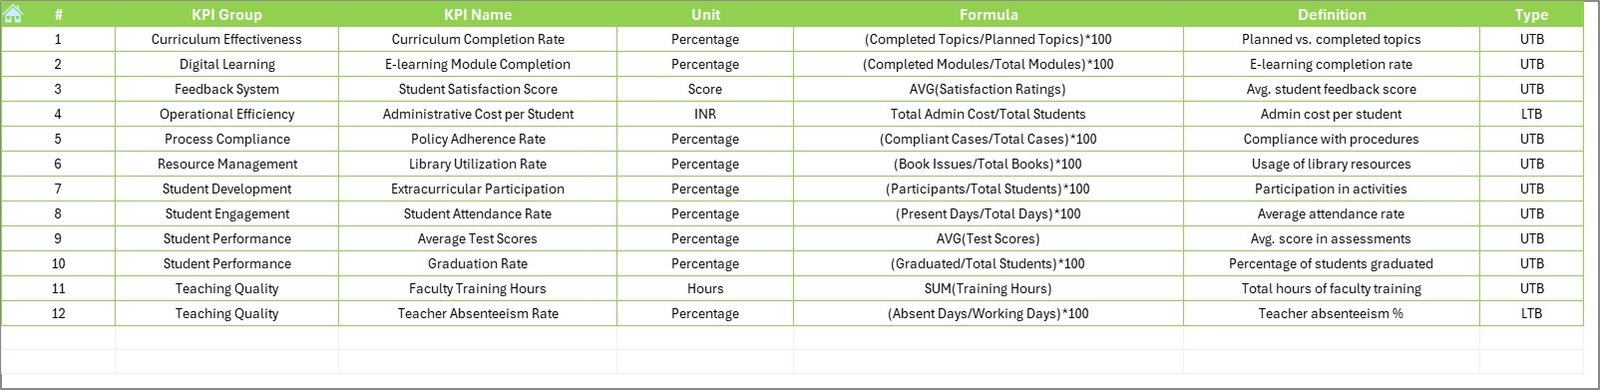
- Add or update KPI Name, Group, Unit, Formula, and Definition.
- Maintains clarity and consistency across the dashboard.
Why Use a KPI Dashboard in Education?
Education systems involve complex processes that require constant monitoring. Here’s how a KPI dashboard makes a difference:
- Tracks academic and administrative performance in real-time.
- Identifies areas for improvement based on data.
- Supports data-driven decision-making.
- Helps educators align strategies with institutional goals.
- Encourages transparency and accountability.
Advantages of Education KPI Dashboard
✅ Real-Time Visibility
You can instantly see what’s working and what’s not with updated MTD and YTD metrics.
✅ Customization
You can tailor the KPIs based on specific institutional goals like student attendance, assessment quality, or faculty workload.
✅ Easy Data Input
The structured input sheets make it easy for staff to add or edit numbers without technical expertise.
✅ Year-over-Year Analysis
Comparing current data with previous year metrics helps you understand trends and long-term progress.
✅ Improved Accountability
KPI-based evaluation encourages all departments to take ownership of performance.
Best Practices for Using the KPI Dashboard
1. Define KPIs Clearly
Always choose relevant KPIs aligned with institutional goals. Use simple definitions and formulas for clarity.
2. Update Data Monthly
Consistent monthly updates help maintain accuracy and ensure timely decision-making.
3. Use Conditional Formatting Wisely
Visual indicators like arrows make the dashboard more intuitive and quick to read.
4. Train Stakeholders
Ensure that staff and management know how to use and interpret the dashboard. Provide short training if needed.
5. Review Trends, Not Just Snapshots
Use the KPI Trend sheet to evaluate how metrics evolve over time.
What KPIs Can You Track?
Here are some examples of KPIs you might include in your dashboard:
- Student Attendance Rate
- Faculty to Student Ratio
- Student Satisfaction Score
- Course Completion Rate
- Average Assessment Score
- Curriculum Coverage Rate
- Faculty Performance Index
- Budget Utilization Rate
- Dropout Rate
- Technology Access Ratio
- Teacher Absenteeism Rate
- Learning Outcome Achievement
Each KPI can be set as UTB (Upper the Better) or LTB (Lower the Better), depending on the goal.
How to Set Up Your Own Dashboard in Excel
- Download the Template: Start with a pre-made Excel template to save time.
- Input Actual Data: Enter your institution’s actual performance data month by month.
- Set Targets: Define expected outcomes (targets) for MTD and YTD.
- Add Previous Year Data: For comparison and trend analysis.
- Define KPIs: Ensure each KPI includes a clear unit, formula, and type.
- Customize: Adjust slicers, chart colors, and KPI groupings based on your needs.
Who Can Use This Dashboard?
- School Administrators
- Training Institutions
- Coaching Centers
- Universities
- Policy Makers in Education
- Non-Profit Education Programs
If your organization focuses on improving learning outcomes, this dashboard can be a game-changer.
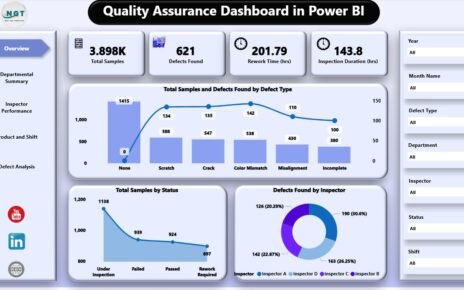
Data Visualization Techniques Used
- Doughnut Charts for categorical KPIs
- Line Charts for trend analysis
- Column Charts for departmental comparison
- Conditional Formatting Arrows for Target vs. Actual insights
Conclusion
Improving education requires constant tracking, measurement, and action. The Education and Learning Process Improvement KPI Dashboard in Excel brings all these together in one powerful tool. With user-friendly design, automation, and interactive elements, it makes performance management simple and insightful.
From tracking attendance to analyzing learning outcomes, you can take better decisions, faster, and more confidently. If you’re serious about data-driven education improvement, this Excel dashboard is a must-have.
Frequently Asked Questions (FAQs)
Click to Purchases Education and Learning Process Improvement KPI Dashboard in Excel
Q1. Can I customize the KPIs in this dashboard?
Yes, you can add, remove, or rename KPIs in the KPI Definition sheet to match your needs.
Q2. Is this dashboard suitable for non-technical users?
Absolutely! With simple drop-downs and structured input areas, anyone familiar with Excel basics can use it.
Q3. Can I compare data across years?
Yes, the dashboard includes previous year inputs and charts for year-over-year analysis.
Q4. How often should I update the dashboard?
You should update it monthly to keep the data current and actionable.
Q5. Does this dashboard require any external software?
No, everything runs inside Microsoft Excel without any add-ons or plugins.
Click to Purchases Education and Learning Process Improvement KPI Dashboard in Excel
Visit our YouTube channel to learn step-by-step video tutorials