In today’s world, sustainability is not just a buzzword—it’s a necessity. As the tourism industry expands, there’s growing pressure to minimize environmental impacts and ensure long-term community benefits. That’s where a Sustainable Tourism KPI Dashboard in Power BI becomes a game-changer. This ready-to-use tool enables tourism boards, policymakers, and analysts to monitor key sustainability metrics effectively.
Let’s dive into the ins and outs of this dashboard, its structure, benefits, and best practices to make the most of this dynamic solution.
Click to Purchases Sustainable Tourism KPI Dashboard in Power BI
What is a Sustainable Tourism KPI Dashboard in Power BI?
A Sustainable Tourism KPI Dashboard is a visual reporting solution created in Power BI that tracks important key performance indicators (KPIs) related to sustainable tourism. It brings real-time insights into areas like environmental preservation, local economic impact, and visitor satisfaction.
Since this dashboard connects to Excel-based data, it offers both flexibility and ease of use for tourism professionals who need actionable insights.
Dashboard Overview and Structure
This dashboard consists of three main pages, each focusing on a specific analytical view:
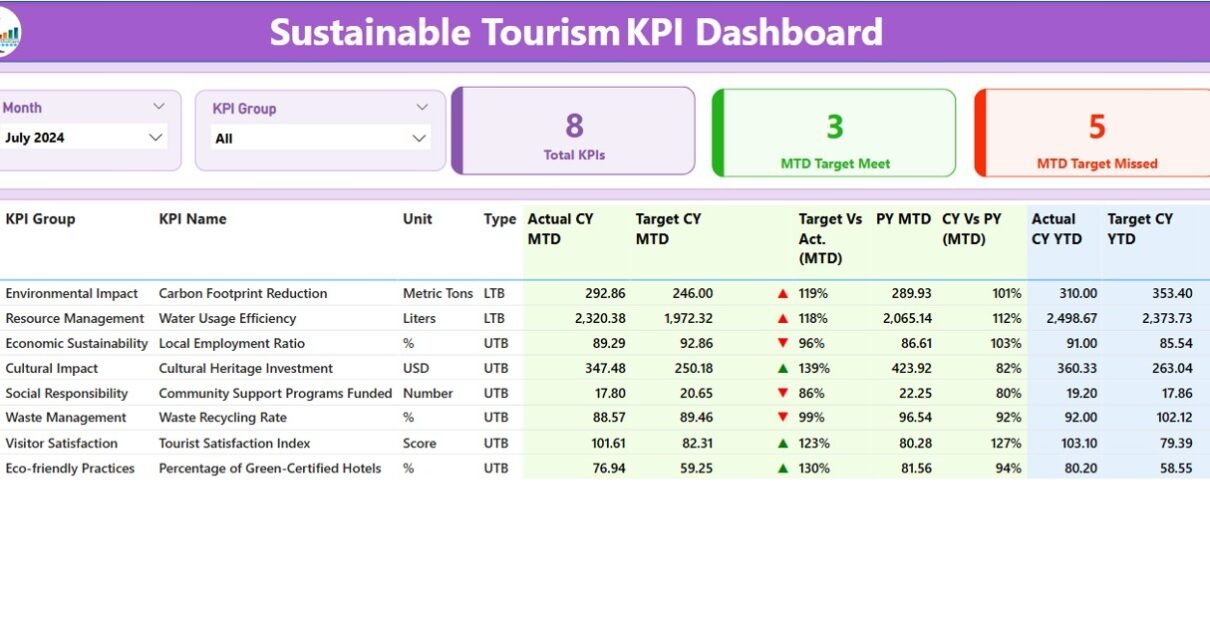
Summary Page
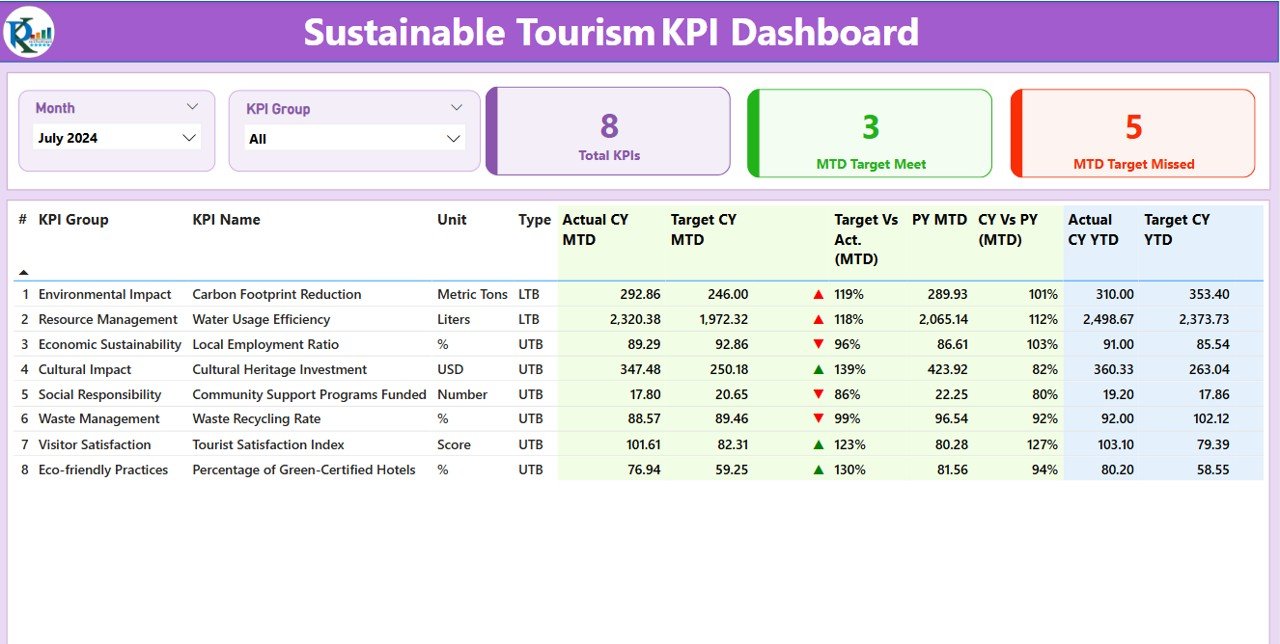
This is your high-level snapshot, providing a clear monthly and year-to-date (YTD) performance view.
- KPI Slicers: Filter by month and KPI group to focus your analysis.
- Visual Cards: Display total KPI count, MTD (Month-to-Date) target met, and MTD missed.
Detailed KPI Table:
- KPI Number & Name
- Group & Unit of Measure
- KPI Type: LTB (Lower the Better) or UTB (Upper the Better)
- Actual vs. Target Values (MTD & YTD)
- Status Icons: ▼ and ▲ in red and green showing performance against target
- Current vs. Previous Year comparisons
Click to Purchases Sustainable Tourism KPI Dashboard in Power BI
KPI Trend Page
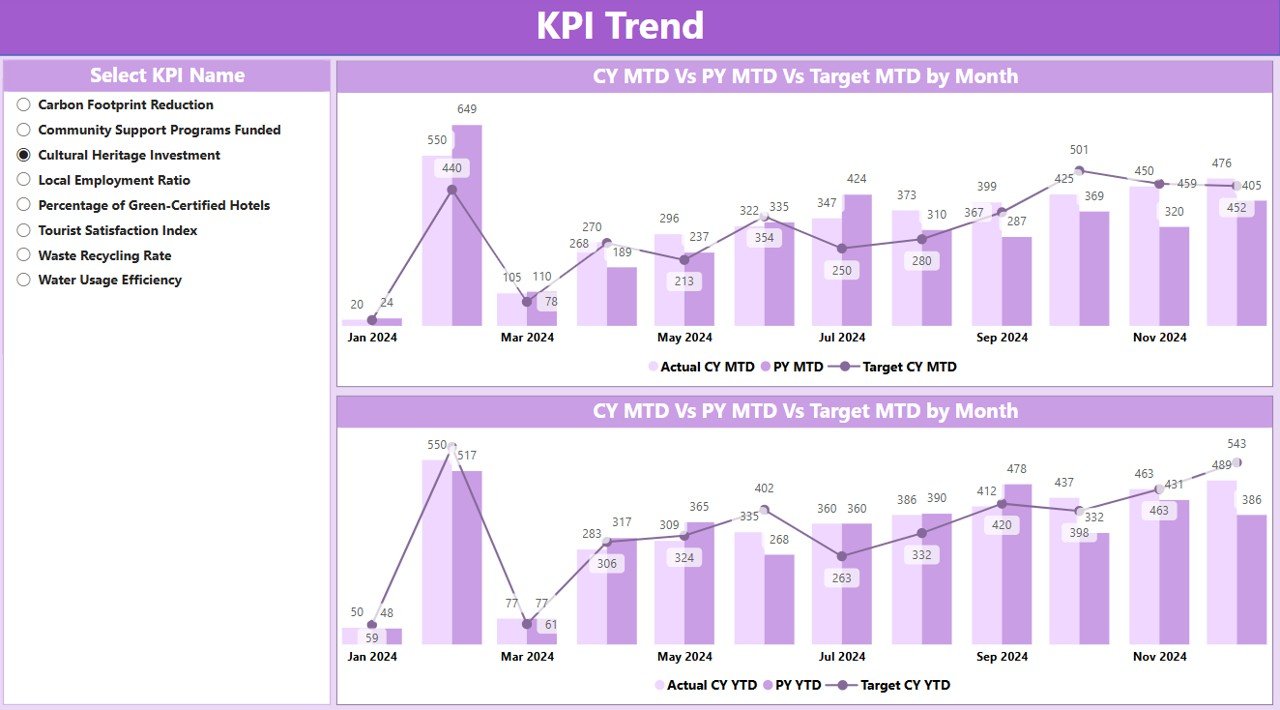
Track performance trends over time for specific KPIs:
- Select a KPI name using a slicer
View combo charts showing:
- Current Year vs. Previous Year
- Targets for both MTD and YTD
KPI Definition Page (Drill-through)
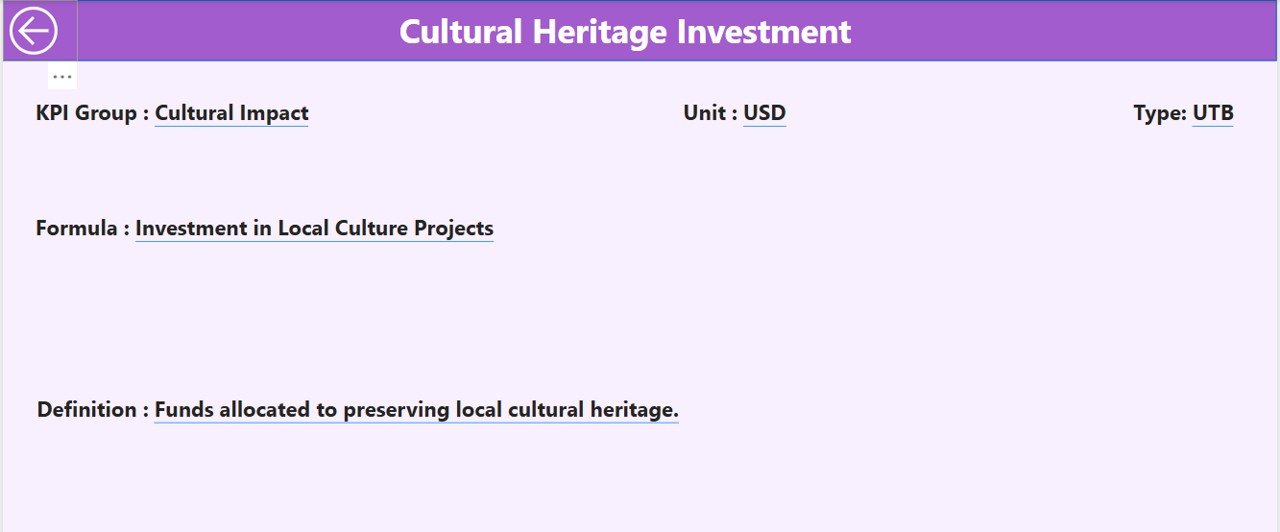
This page is accessible via drill-through from the Summary Page. It provides:
- KPI formula
- KPI definitions
- Type of KPI (UTB or LTB)
Use the back button on the top-left to return to the summary.
Data Source: Excel Sheets
The dashboard pulls live data from an Excel file with three key sheets:
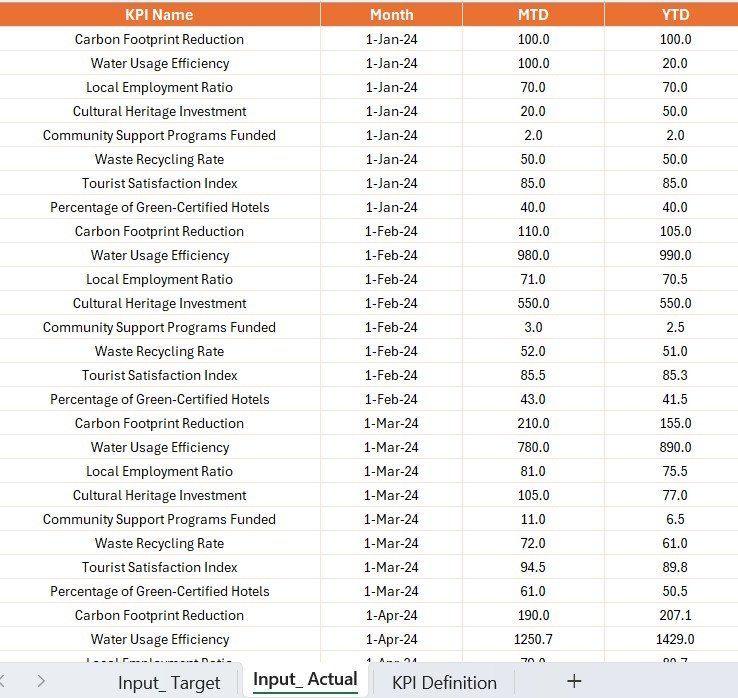
1. Input_Actual
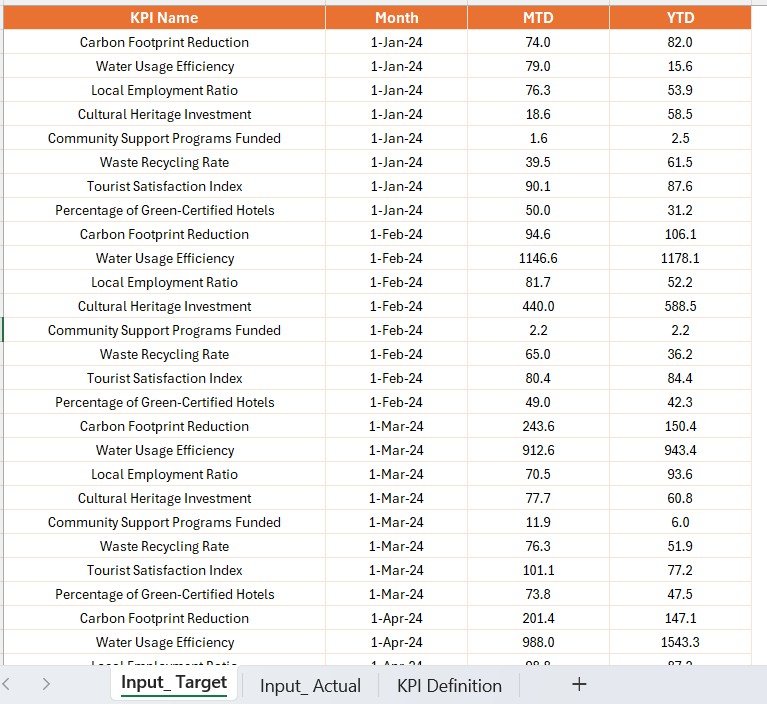
- Columns: KPI Name, Month (first day of the month), MTD, YTD Actuals
2. Input_Target
- Same structure as Input_Actual, but for Target values
Click to Purchases Sustainable Tourism KPI Dashboard in Power BI
3. KPI Definition
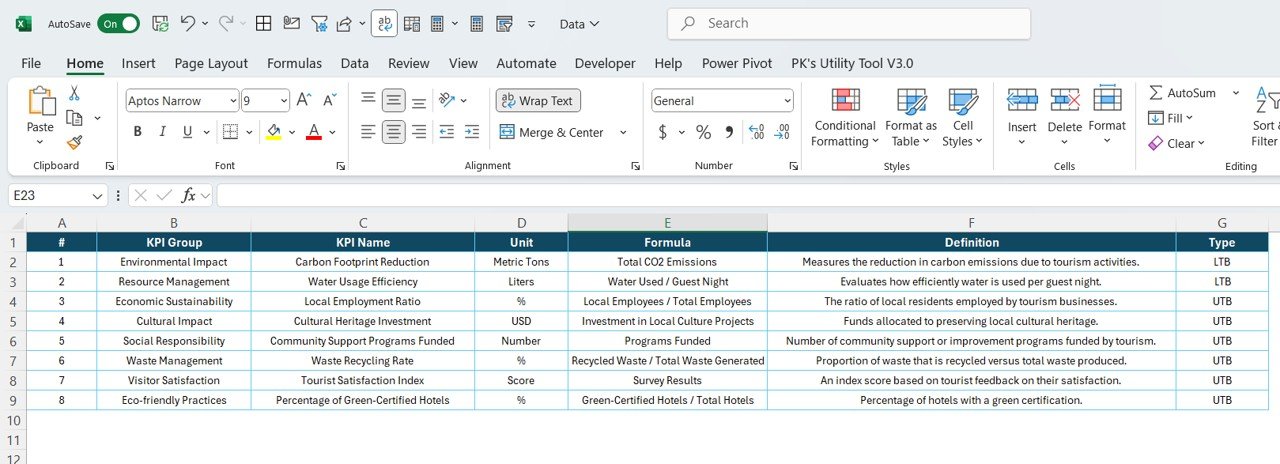
- Includes: KPI Number, KPI Group, KPI Name, Unit, Formula, Definition, Type
This structure ensures the dashboard stays organized and easy to maintain.
Advantages of Using a Sustainable Tourism KPI Dashboard
Using this Power BI solution delivers several benefits:
🔢 Real-Time Monitoring: Instantly spot areas that need improvement.
📊 Data-Driven Decisions: Use hard data to back strategic planning.
♻️ Promote Sustainable Practices: Track KPIs that align with environmental and community goals.
👨🏫 Stakeholder Engagement: Easily share reports with local authorities and partners.
🌎 Global Benchmarking: Compare performance with previous years for global and regional insights.
Best Practices for the Sustainable Tourism KPI Dashboard
To get the most from your dashboard, follow these tips:
1. Define Clear KPIs
Choose KPIs that reflect the core pillars of sustainable tourism—economic, environmental, and social.
2. Keep Data Updated
Schedule regular updates for Excel inputs to ensure accuracy.
3. Use Visual Cues Effectively
Red and green arrows work well. Don’t overload with too many visuals.
4. Empower Users with Drill-through
Enable drill-through options so users can dig into details when needed.
5. Segment Data by Region or Season
Filter data by tourist zones or time of year to reveal deeper patterns.
Why Should You Use Power BI for Tourism KPI Tracking?
Power BI offers powerful visual analytics with ease of customization. Here’s why it’s the ideal tool:
✅ Drag-and-drop visual design
✅ Integration with Excel, SharePoint, and databases
✅ Drill-through and dynamic filtering
✅ Mobile access for stakeholders on the move
With these features, Power BI enables tourism departments to stay informed and agile.
Use Cases for Sustainable Tourism KPI Dashboard
🌺 National Parks: Monitor visitor flow, conservation efforts, and community benefits.
🌊 Beach Destinations: Track water quality, waste levels, and tourist satisfaction.
🏠 Urban Tourism: Assess transport impact, local job creation, and seasonal peaks.
⛺ Cultural Heritage Sites: Measure preservation success, visitor education, and revenue.
Conclusion
The Sustainable Tourism KPI Dashboard in Power BI is more than just a reporting tool. It’s your partner in achieving balanced, responsible, and future-focused tourism growth. Whether you’re a government agency, non-profit, or private tour operator, using this dashboard helps you monitor what matters most and make meaningful changes.
Frequently Asked Questions (FAQs)
🔎 What is a Sustainable Tourism KPI?
A Sustainable Tourism KPI is a measurable value that helps evaluate the effectiveness of practices aimed at achieving tourism that benefits both the environment and the local community.
📊 How often should I update the Excel data source?
You should update it monthly to ensure your dashboard reflects current performance.
🚀 Can I customize the dashboard visuals?
Absolutely! You can add logos, change themes, or add more visuals in Power BI Desktop.
📅 What is the difference between MTD and YTD?
MTD (Month-To-Date) refers to the data for the current month up to today, while YTD (Year-To-Date) includes all data from the start of the year up to today.
Click to Purchases Sustainable Tourism KPI Dashboard in Power BI
Visit our YouTube channel to learn step-by-step video tutorials