In today’s competitive business landscape, maintaining strong relationships with vendors is not just a good practice – it’s essential. The performance of your vendors directly impacts your supply chain efficiency, procurement planning, and ultimately your customer satisfaction. That’s where a Vendor Performance Dashboard in Excel becomes a game-changing solution.
This article offers a comprehensive, step-by-step look into creating and using an Excel-based dashboard to evaluate vendor performance. We’ll cover its structure, benefits, best practices, and answer key questions businesses often ask.
Click to Purchases Vendor Performance Dashboard in Excel
What is a Vendor Performance Dashboard in Excel?
A Vendor Performance Dashboard is a visual analytics tool created in Excel that helps you track, measure, and evaluate the performance of your vendors. With this dashboard, you can:
- Monitor key procurement metrics in real-time
- Identify top-performing and underperforming vendors
- Analyze delivery timelines, cost trends, and quality ratings
The Excel-based dashboard offers flexibility, real-time updates, and easy customization without needing advanced technical skills.
Key Features of the Vendor Performance Dashboard
Our Vendor Performance Dashboard comes with a user-friendly design and advanced capabilities built into Excel. Here’s what you can expect:
Page Navigator
- Located at the top of the dashboard
- Helps users switch between different dashboard pages quickly
Five Analytical Pages
The Excel dashboard contains five dedicated pages to break down vendor performance from different angles:
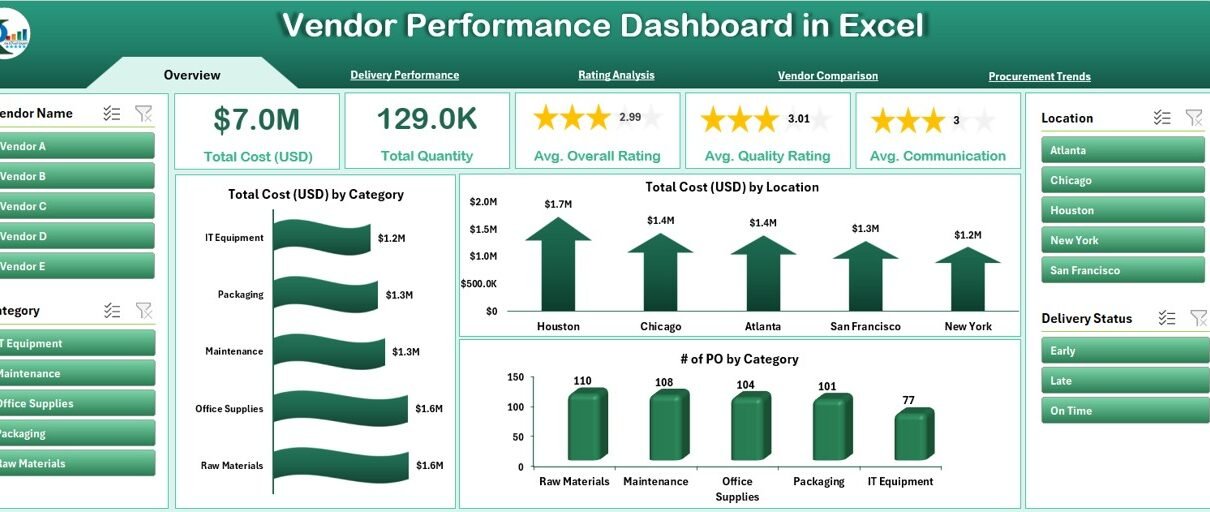
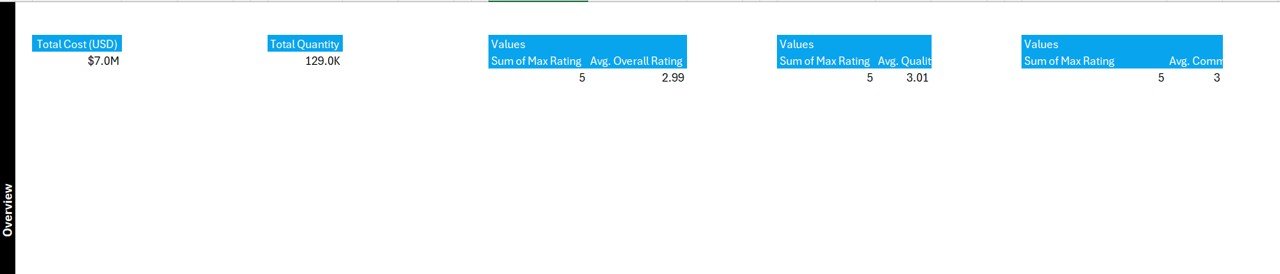
Overview Page
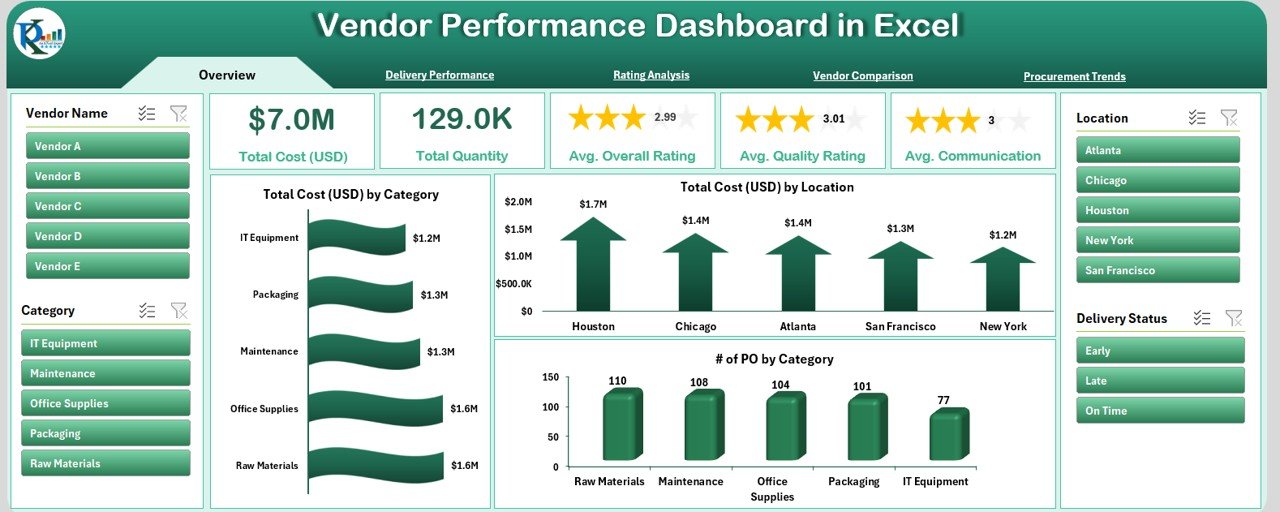
- 5 Summary Cards (e.g., Total Vendors, Total Orders)
Charts:
- Total Cost (USD) by Category
- Total Cost (USD) by Location
- Number of POs by Category
Delivery Performance Page
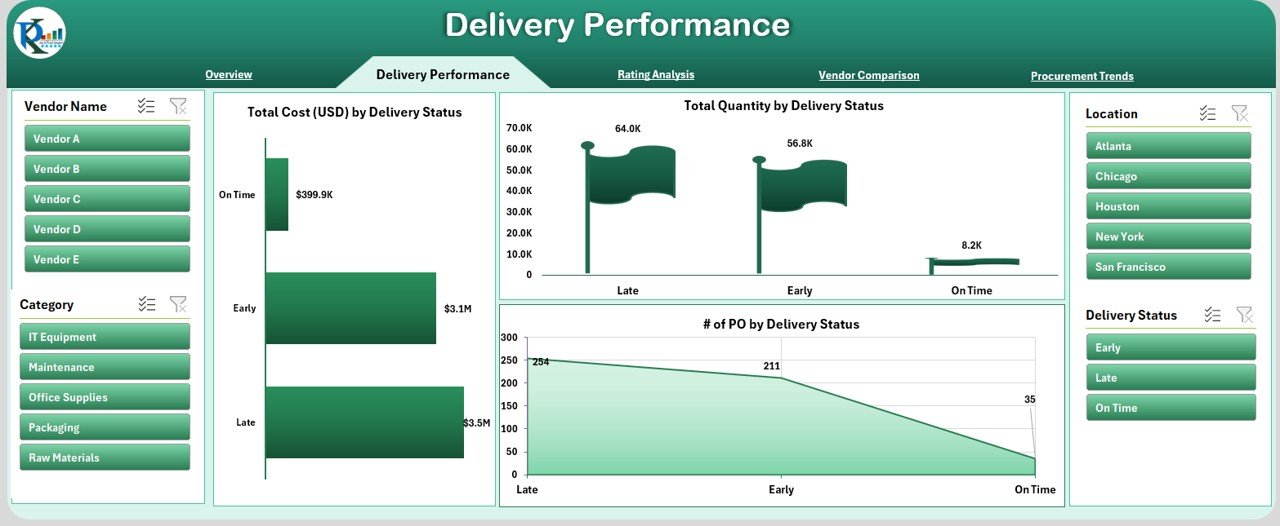
Charts:
- Total Cost (USD) by Delivery Status
- Total Quantity by Delivery Status
- Number of POs by Delivery Status
Rating Analysis Page
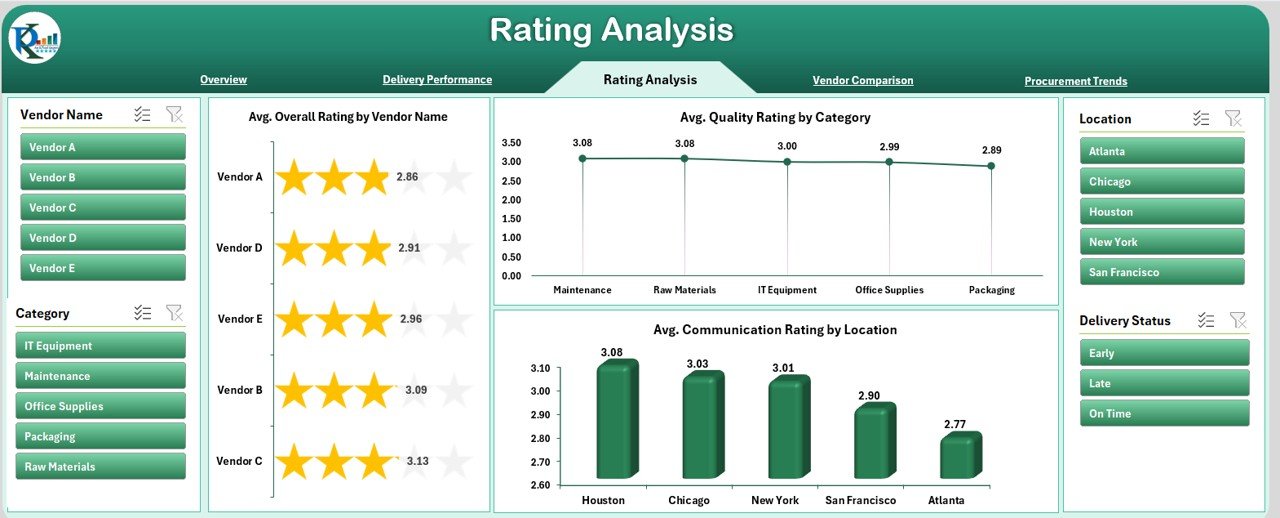
Charts:
- Avg. Overall Rating by Vendor Name
- Avg. Quality Rating by Category
- Avg. Communication Rating by Location
Vendor Comparison Page
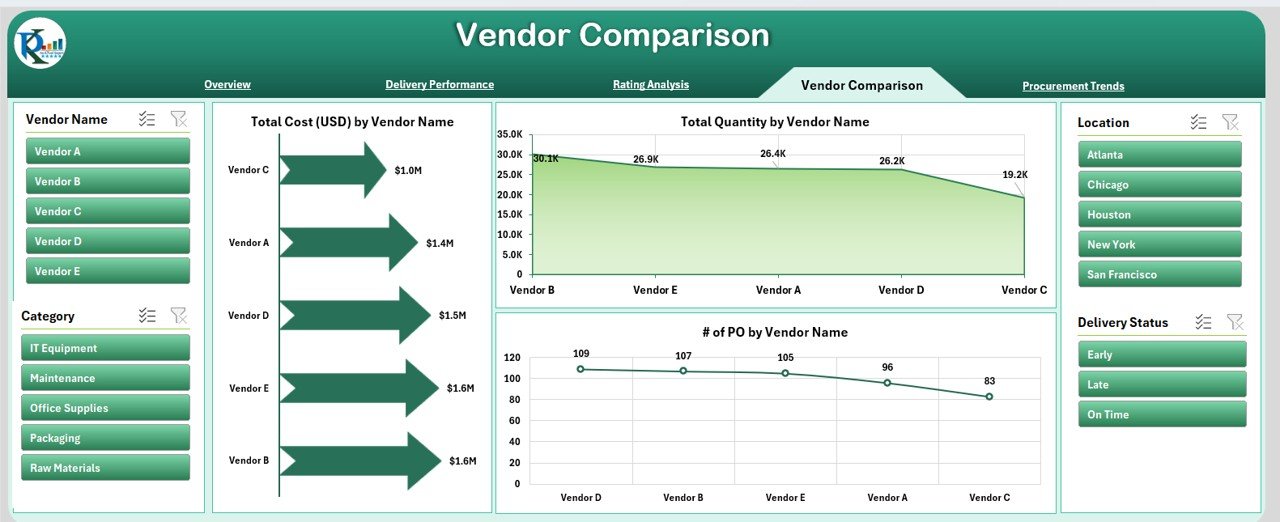
Charts:
Click to Purchases Vendor Performance Dashboard in Excel
- Total Cost (USD) by Vendor Name
- Total Quantity by Vendor Name
- Number of POs by Vendor Name
Procurement Trends Page
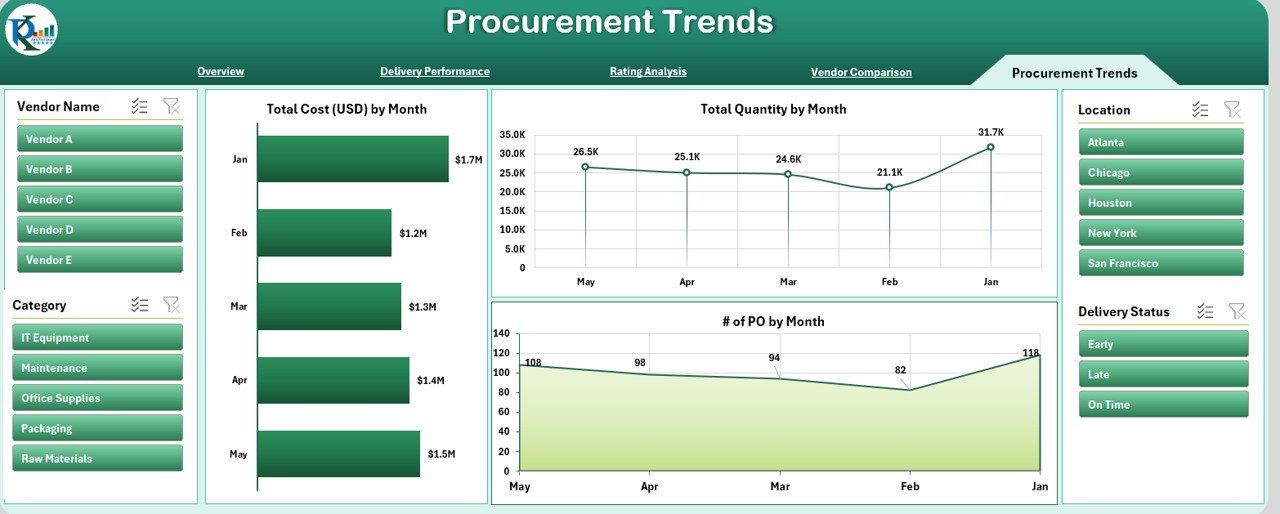
Charts:
- Total Cost (USD) by Month
- Total Quantity by Month
- Number of POs by Month
Data Structure Behind the Dashboard
The data powering this dashboard is stored in two main worksheets:
Data Sheet
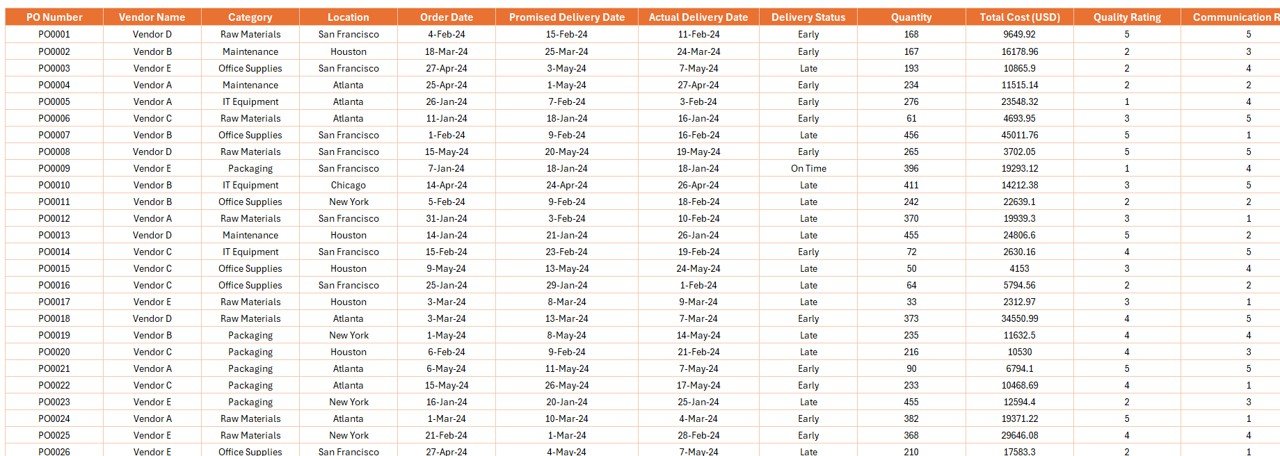
Key columns include:
- PO Number
- Vendor Name
- Category
- Location
- Order Date
- Promised Delivery Date
- Actual Delivery Date
- Delivery Status
- Quantity
- Total Cost (USD)
- Quality Rating
- Communication Rating
- Overall Rating
- Month and Year
Support Sheet
This sheet helps with dropdowns, slicers, and supporting metrics.
Advantages of Using a Vendor Performance Dashboard in Excel
Using a structured dashboard offers many practical benefits for procurement and operations teams:
✅ Real-Time Insights: Instantly identify performance issues
✅ Data-Driven Decisions: Back your vendor choices with data
✅ Visual Appeal: Make reporting easier with visuals
✅ Customization: Tailor charts and KPIs to your needs
✅ No Special Tools Required: Run it entirely in Microsoft Excel
Best Practices for the Vendor Performance Dashboard
To maximize the value of your dashboard, follow these best practices:
1. Use Standardized Rating Metrics
Keep quality, communication, and overall ratings consistent across all vendors.
2. Keep Data Updated
Regularly refresh your data sheet to maintain accuracy.
3. Use Slicers and Filters
Let users filter by category, month, location, or vendor for targeted insights.
4. Avoid Overcrowding Charts
Keep visuals clean. Too much data on one chart makes interpretation harder.
5. Audit the Data Source Monthly
Schedule monthly checks on your data entry to ensure everything is being recorded properly.
Who Can Use This Dashboard?
This template suits multiple business functions:
- Procurement Teams
- Supply Chain Managers
- Vendor Management Teams
- Quality Control Departments
Whether you’re a small business or a large enterprise, you can easily adopt and scale this solution.
Why Choose Excel for Vendor Performance Tracking?
You might wonder, why not use a more sophisticated BI tool like Power BI or Tableau? The answer is simplicity and accessibility. Excel is widely used, cost-effective, and doesn’t require advanced technical training.
You can:
- Customize formulas and logic
- Add conditional formatting
- Use PivotTables to explore data
- Export data easily for reports
How to Set Up Your Vendor Performance Dashboard
Here’s a simple step-by-step guide to get started:
- Prepare your data sheet with historical records of vendor performance
- Create Pivot Tables for each metric
- Insert Pivot Charts and organize them by dashboard section
- Add slicers and timelines to make the dashboard interactive
- Use conditional formatting to highlight good/bad performance
- Create a navigation menu at the top for user-friendly access
Tips to Enhance Dashboard Effectiveness
🔄 Link your dashboard to dynamic named ranges
🔄 Use formulas like IF, AVERAGEIFS, and COUNTIFS to calculate performance KPIs
🔄 Insert icons or data bars to show performance visually
🔄 Protect your sheet to prevent accidental edits
Future Scope and Scalability
This dashboard isn’t just a static tool. You can:
- Integrate it with Power Query to fetch live data
- Build automated email reports with VBA
- Convert it into a web dashboard using Power BI later on
Conclusion
A Vendor Performance Dashboard in Excel can transform your vendor management process. From delivery analysis to quality ratings, it gives you the full picture in one place. With proper setup and regular updates, this dashboard becomes a decision-making powerhouse.
Don’t let vendor issues catch you off guard. Start tracking, visualizing, and improving your procurement workflow today!
Frequently Asked Questions (FAQs)
1. Can I customize the dashboard for different industries?
Yes. You can adapt the dashboard for retail, manufacturing, healthcare, or any sector by tweaking the KPIs and categories.
2. Do I need coding skills to use this dashboard?
Not at all. This dashboard runs completely on Excel formulas, PivotTables, and slicers. No coding required.
3. How often should I update the data?
Ideally, update the data sheet weekly or monthly based on your order volume.
4. Can I track multiple vendors at once?
Yes. The dashboard is designed to analyze data for multiple vendors simultaneously.
Click to Purchases Vendor Performance Dashboard in Excel
Visit our YouTube channel to learn step-by-step video tutorials