In today’s fast-paced business environment, staying compliant with legal regulations is more critical than ever. Whether you’re handling industry-specific regulations or broader national laws, keeping track of compliance status can be challenging without the right tools. That’s where the Legal Compliance Dashboard in Excel comes in.
This dashboard is a powerful tool designed to help businesses track, monitor, and visualize their compliance status in real time. With its easy-to-use interface, dynamic charts, and detailed analysis capabilities, the Legal Compliance Dashboard in Excel can help your organization stay on top of compliance activities and avoid potential risks.
In this article, we will explore the key features of the Legal Compliance Dashboard template, its benefits, best practices for use, and how it can enhance your organization’s compliance management.
Click to Purchases Legal Compliance Dashboard in Excel
What is the Legal Compliance Dashboard in Excel?
The Legal Compliance Dashboard in Excel is a pre-built, ready-to-use template that allows organizations to manage and track their compliance efforts efficiently. It consolidates critical compliance data into a single view, offering key metrics, performance indicators, and detailed analysis across multiple areas, departments, and compliance priorities.
This Excel-based tool is designed to help businesses:
-
Track compliance across various departments and areas
-
Visualize performance trends over time
-
Understand compliance gaps and address delays
-
Maintain up-to-date records on compliance status and scores
Key Features of the Legal Compliance Dashboard in Excel
The Legal Compliance Dashboard comes equipped with several interactive features that provide a comprehensive view of compliance management. Let’s take a closer look at the key features:
Page Navigator
Located on the left side of the dashboard, the Page Navigator makes it easy to move between different analytical pages. It simplifies navigation, allowing users to quickly access various views and reports.
Overview Page
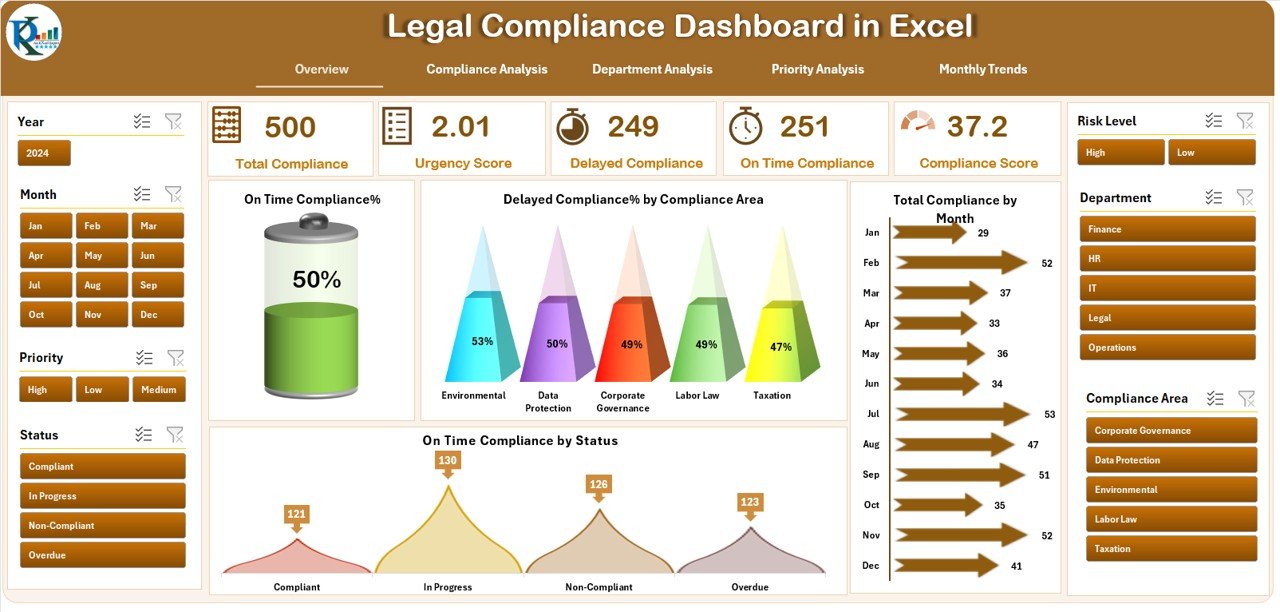
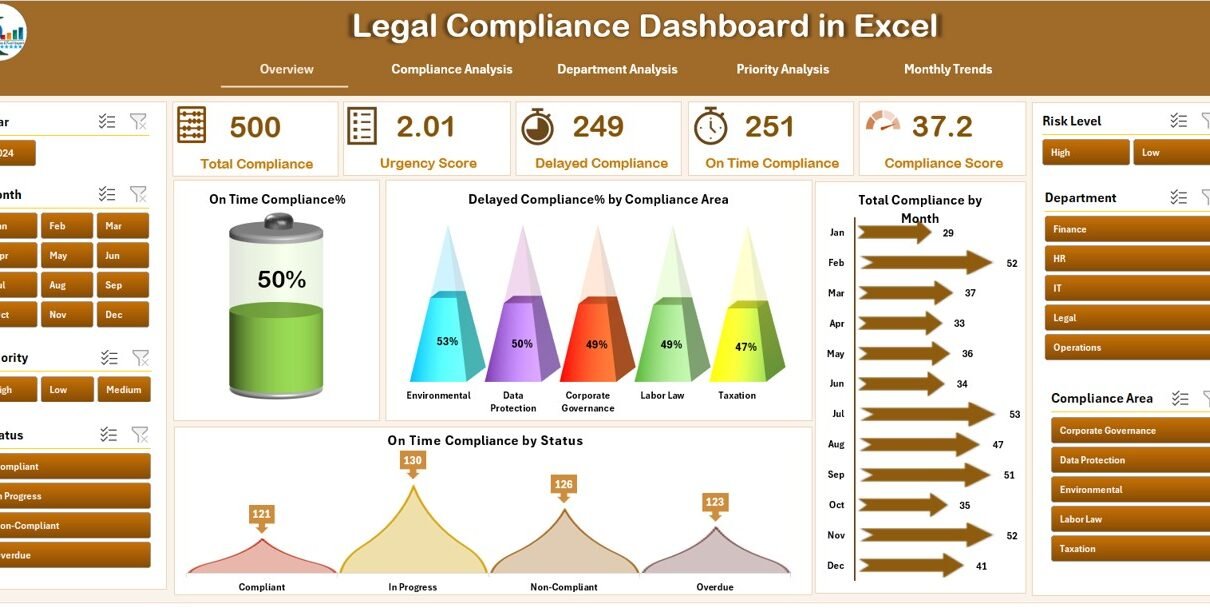
The Overview Page serves as the main dashboard. Here, you can monitor the overall compliance performance at a glance. The page includes:
-
5 Cards that display essential KPIs like the percentage of on-time compliance, delayed compliance percentage, and the total number of compliance activities.
4 Interactive Charts that visualize key metrics, including:
- Compliance %
- Delayed Compliance % by Compliance Area
- Total Compliance by Month
- On-time Compliance Status
This page provides a snapshot of your entire compliance process, allowing you to make quick decisions and spot issues early.
Compliance Analysis
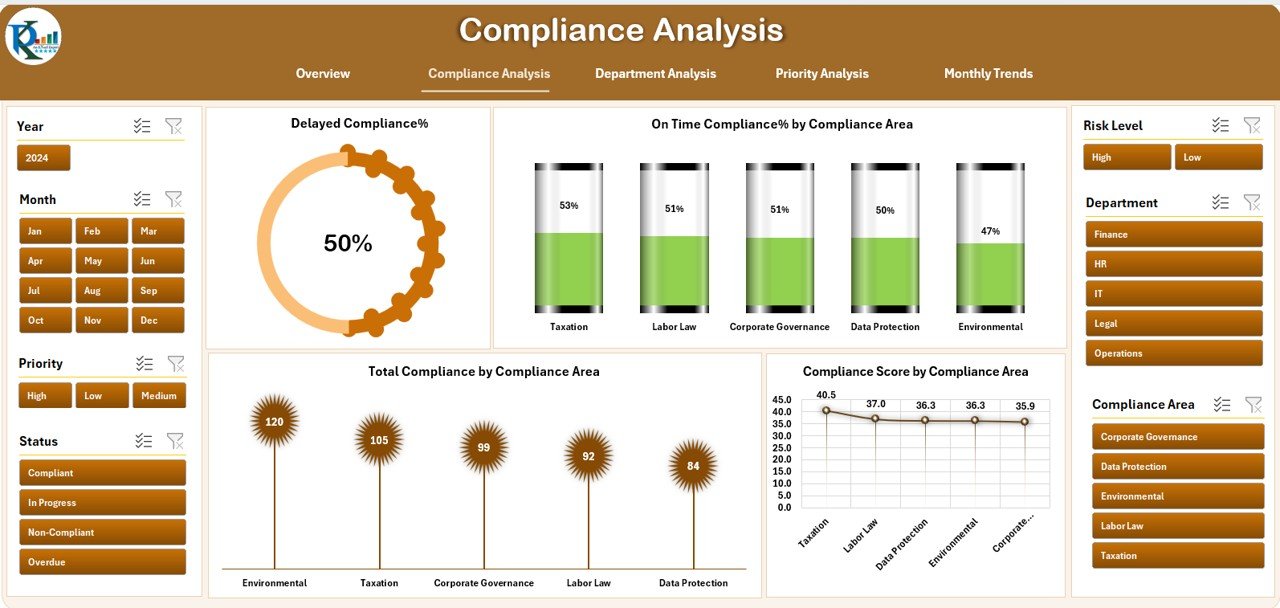
The Compliance Analysis Page allows users to dive deeper into specific compliance data. Here, you’ll find:
4 Charts that show:
- Delayed Compliance %
- On-Time Compliance % by Compliance Area
- Total Compliance by Compliance Area
- Compliance Score by Compliance Area
This page helps you track how well each compliance area is performing, highlighting areas that need attention.
Department Analysis
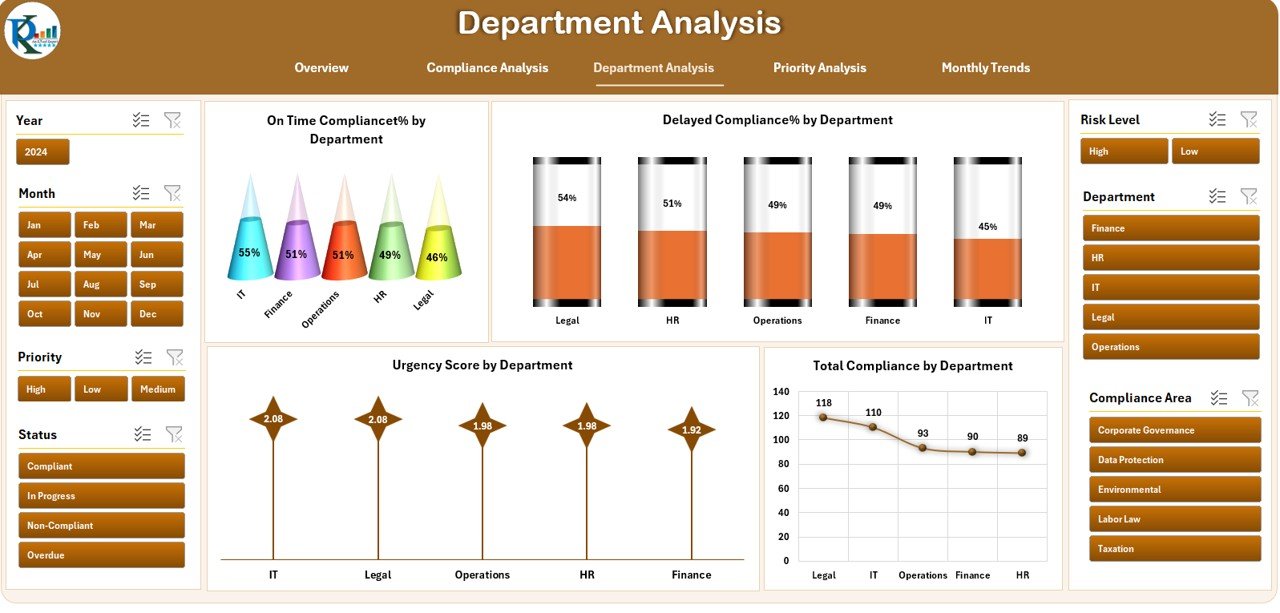
For organizations managing multiple departments, the Department Analysis Page is essential. It breaks down compliance performance by department, with:
4 Charts displaying:
- On-Time Compliance % by Department
- Delayed Compliance % by Department
- Urgency Score by Department
- Total Compliance by Department
This enables managers to identify which departments are excelling and which need improvement in terms of compliance.
Priority Analysis
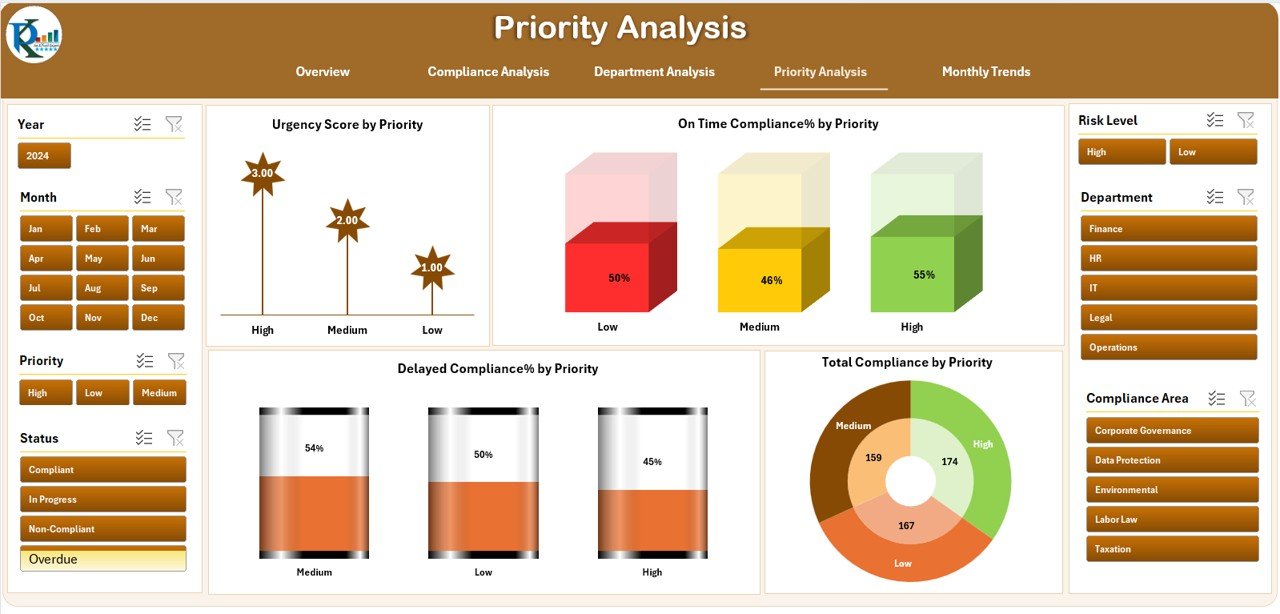
This page focuses on compliance based on priority levels, helping your team prioritize high-risk areas. It includes:
Click to Purchases Legal Compliance Dashboard in Excel
4 Charts displaying:
- Urgency Score by Priority
- On-Time Compliance % by Priority
- Delayed Compliance % by Priority
- Total Compliance by Priority
By assessing compliance through priority levels, you can address critical compliance gaps faster and more efficiently.
Monthly Trends
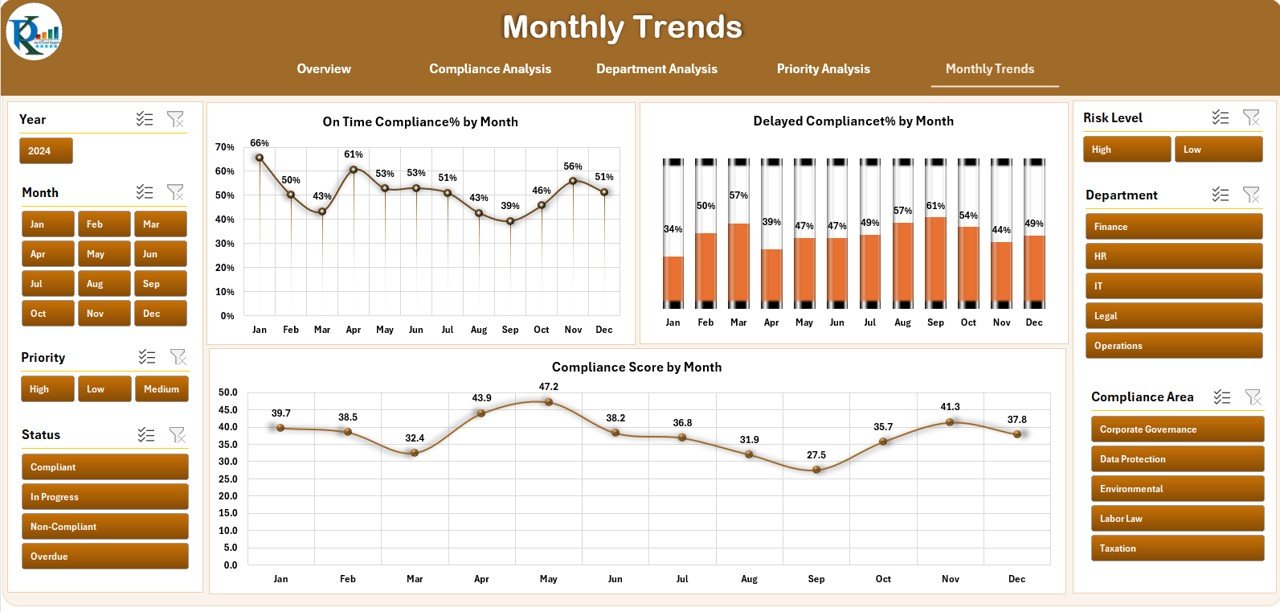
The Monthly Trends Page is where you can see compliance performance over time. It includes:
3 Charts:
- On-Time Compliance % by Month
- Delayed Compliance % by Month
- Compliance Score by Month
This page allows you to track trends and patterns, helping you forecast future compliance challenges.
Data Sheet and Support Sheet
The Data Sheet serves as the backend of the dashboard, where all compliance-related data is entered and stored. It’s easy to update and maintain, ensuring your dashboard always reflects the latest data.
The Support Sheet offers additional information and resources, making the dashboard even more user-friendly.
Advantages of Using the Legal Compliance Dashboard in Excel
Using the Legal Compliance Dashboard in Excel brings several benefits to organizations looking to streamline their compliance management processes:
1. Centralized Data Management
With all compliance data stored in a single location, the dashboard ensures easy tracking and management of compliance activities across various departments and areas.
2. Real-Time Monitoring
The dashboard updates in real-time, ensuring that compliance information is always up to date. This allows businesses to react quickly to issues and make informed decisions.
3. Visual Insights
With dynamic charts and KPIs, the dashboard provides visual insights into compliance performance, making it easier for stakeholders to interpret complex data and trends.
4. Improved Decision-Making
By providing in-depth analysis and highlighting compliance gaps, the dashboard empowers decision-makers to take timely actions to prevent legal risks.
5. Time and Cost Efficiency
Automating compliance tracking reduces the time and resources spent on manual reporting, freeing up valuable time for other critical tasks.
Best Practices for Using the Legal Compliance Dashboard in Excel
To get the most out of your Legal Compliance Dashboard, follow these best practices:
1. Regularly Update Your Data
For accurate insights, ensure that the data in your Data Sheet is regularly updated. This ensures that the dashboard reflects the most current compliance information.
2. Review Compliance Trends Monthly
Use the Monthly Trends Page to monitor compliance trends and address any areas of concern before they become significant problems.
3. Prioritize High-Risk Areas
Utilize the Priority Analysis Page to identify compliance areas that require urgent attention and allocate resources accordingly.
4. Track Compliance by Department
Use the Department Analysis Page to ensure that all departments are meeting compliance standards. Address underperforming departments to maintain overall compliance.
5. Customize the Dashboard to Fit Your Needs
Modify the dashboard to align with your organization’s specific compliance needs. Add custom metrics or adjust existing ones based on your industry’s regulations.
Conclusion
The Legal Compliance Dashboard in Excel is a versatile and powerful tool that can help your organization track and manage compliance efforts with ease. By offering detailed insights, real-time updates, and visual reports, this dashboard allows businesses to stay compliant, reduce risks, and make informed decisions.
Whether you’re dealing with regulatory requirements, industry standards, or internal policies, this dashboard is the perfect solution for managing legal compliance across various areas and departments.
Frequently Asked Questions (FAQs)
1. What is the purpose of the Legal Compliance Dashboard in Excel?
The Legal Compliance Dashboard in Excel helps organizations track and visualize compliance performance across various departments and compliance areas. It allows businesses to manage compliance efficiently, reducing risks and ensuring timely adherence to legal requirements.
2. How does the dashboard help in tracking compliance?
The dashboard provides real-time updates, dynamic charts, and KPIs that help businesses track compliance status, identify gaps, and make timely decisions to stay compliant.
3. Can I customize the dashboard to meet my business needs?
Yes, the Legal Compliance Dashboard in Excel can be customized to align with your specific compliance requirements. You can modify charts, KPIs, and data sheets based on your industry and business needs.
4. Is it easy to update the dashboard?
Yes, the dashboard is designed for easy data entry and updates. The data sheet is the central location for adding compliance information, and updates automatically reflect in the dashboard.
5. How can I ensure the data is accurate and up to date?
Regularly updating the Data Sheet with the latest compliance information ensures that your dashboard provides accurate and real-time insights into your compliance status.
Visit our YouTube channel to learn step-by-step video tutorials