In today’s data-driven world, managing a martial arts studio isn’t just about training and discipline—it’s about numbers, performance, and actionable insights. That’s where a Martial Arts Studio KPI Dashboard in Power BI comes in handy.
This powerful tool enables studio owners, instructors, and administrators to make informed decisions, boost operational efficiency, and measure what truly matters.
In this comprehensive guide, we’ll explore what a Martial Arts Studio KPI Dashboard is, how it works in Power BI, its key features, and how you can get started with one today.
Click to Purchases Martial Arts Studio KPI Dashboard in Power BI
What Is a Martial Arts Studio KPI Dashboard in Power BI?
A Martial Arts Studio KPI Dashboard in Power BI is a visual, interactive tool that tracks the Key Performance Indicators (KPIs) of a martial arts studio. It provides real-time insights into operational, instructional, and financial performance.
By combining data from various sources—primarily Excel—Power BI presents that data in a dynamic way through charts, graphs, and slicers. You can monitor your studio’s performance over time, compare against targets, and drill down into the metrics that matter most.
Whether you’re managing class attendance, tracking student progress, evaluating instructor performance, or analyzing membership growth—this dashboard simplifies it all.
Key Features of the Martial Arts Studio KPI Dashboard
The dashboard is structured across three powerful pages within Power BI, designed to give you both high-level and granular views of performance.
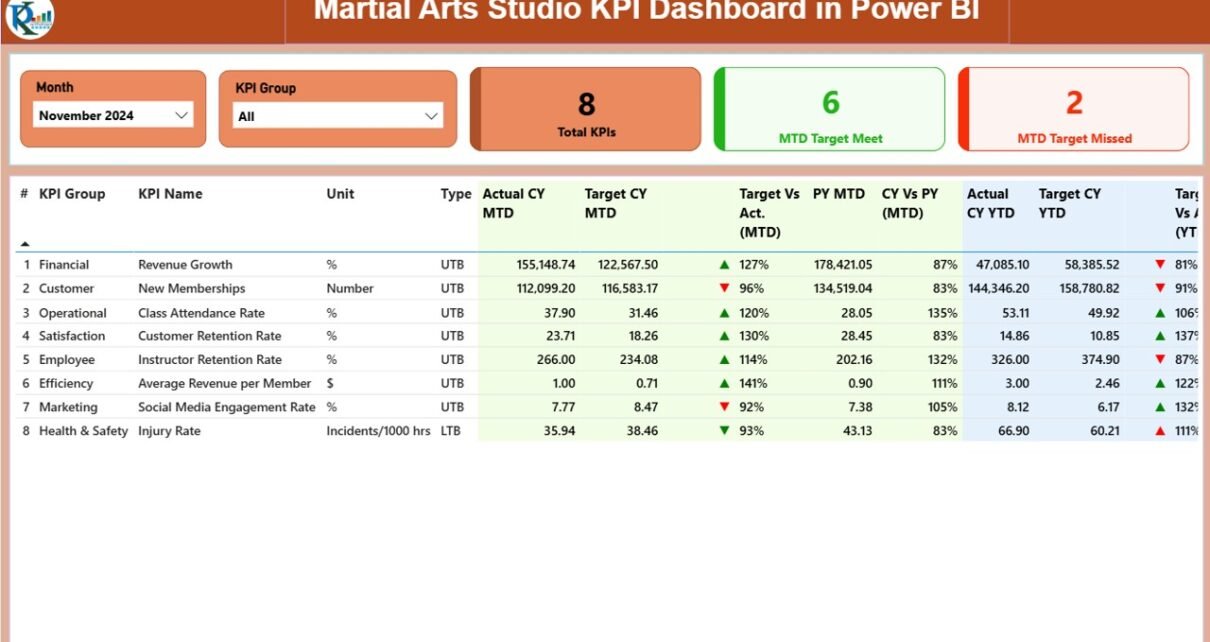
Summary Page – KPI Overview at a Glance
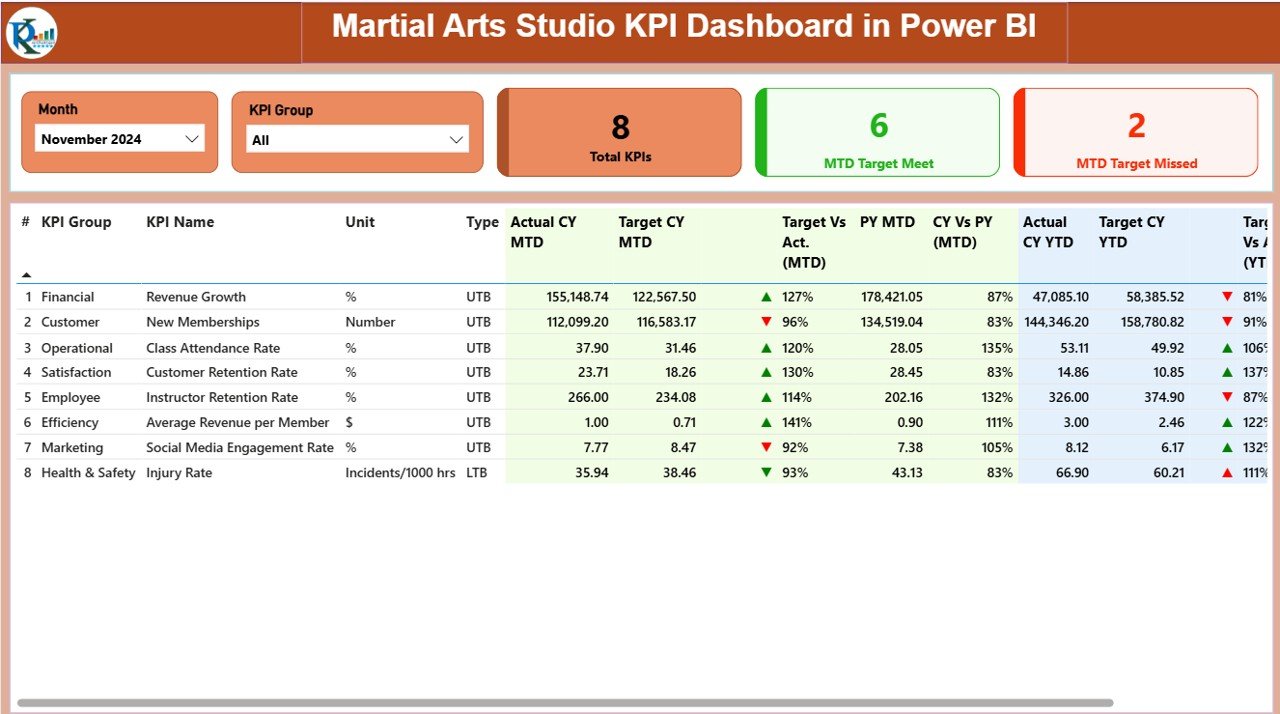
This is the main landing page where performance monitoring starts.
Top Features:
-
Slicers: Select by Month and KPI Group to filter data dynamically.
Performance Cards:
- 🔢 Total KPIs Count
- ✅ MTD Target Met Count
- ❌ MTD Target Missed Count
KPI Table with Key Metrics:
- KPI Number: Unique ID for tracking
- KPI Group: Category (e.g., Finance, Operations, Training)
- KPI Name & Unit: e.g., New Enrollments (Number), Avg. Class Size (People)
- Type: LTB (Lower the Better) or UTB (Upper the Better)
- Actual & Target MTD/YTD Values
- Icons (▲▼): Green for achieved, red for missed
- Target vs Actual %
- CY vs PY Comparisons (Current vs Previous Year)
These indicators help you see how well your studio is doing against defined targets—both month-to-date (MTD) and year-to-date (YTD).
KPI Trend Page – Track Progress Over Time
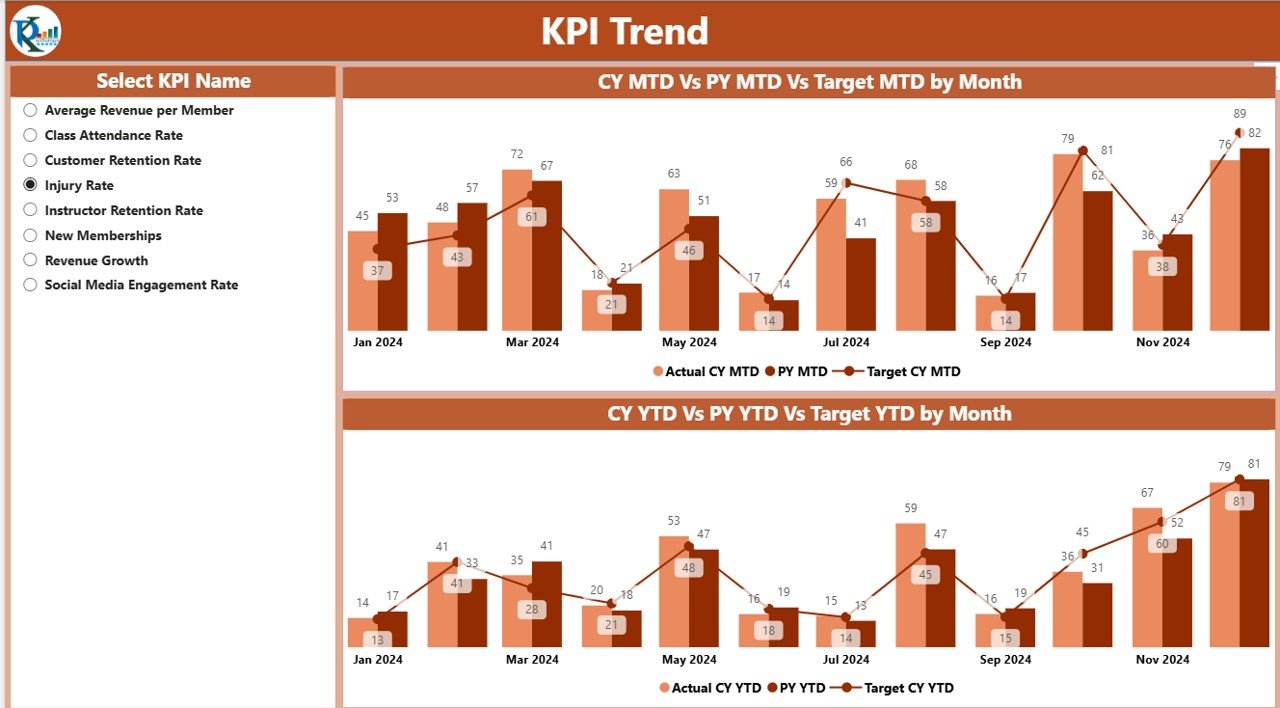
This page allows you to visualize progress over time through combo charts.
What’s Inside:
-
Slicer: Choose the KPI Name to analyze trends.
Charts:
- 📊 MTD Trend: Actual vs Target vs Previous Year
- 📊 YTD Trend: Same structure for YTD tracking
This is particularly useful for identifying seasonal trends, instructor impact, or even analyzing how marketing campaigns influence student numbers.
KPI Definition Page – Drill-Down Details
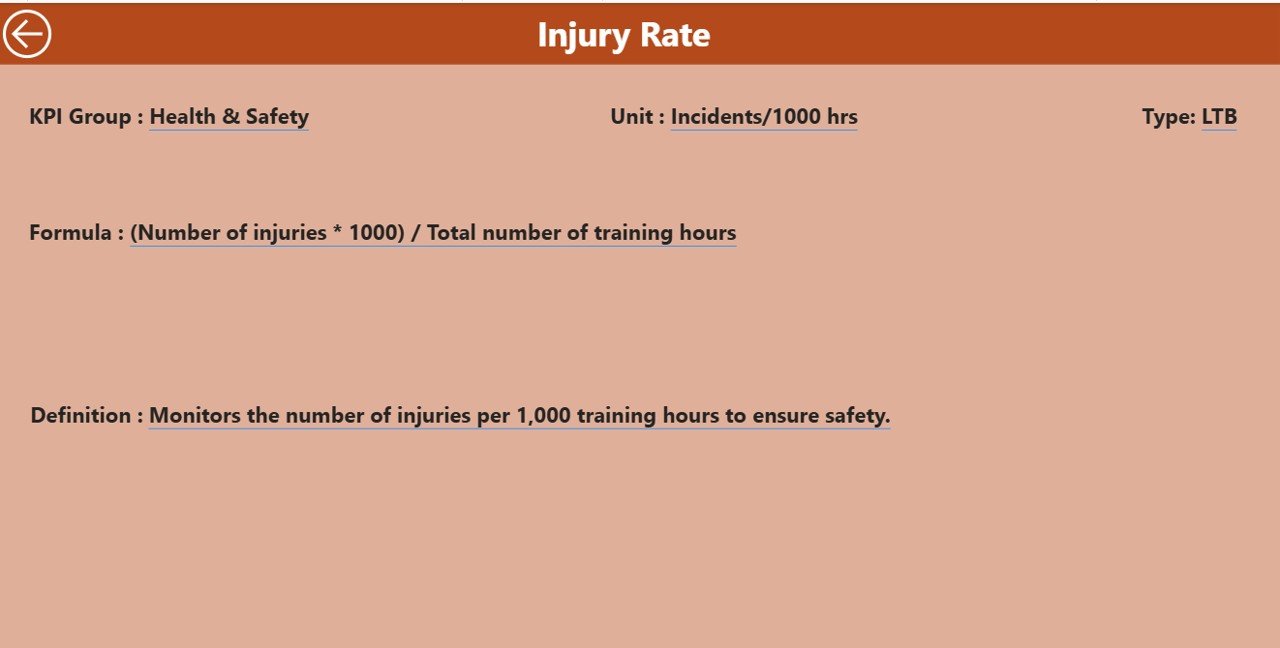
While this page remains hidden by default, it acts as a drill-through page from the summary.
Drill-through Insights:
-
Formula Used
-
KPI Definition
-
Unit of Measurement
-
KPI Type (LTB/UTB)
Navigation Tip: Click the back button on the top-left corner to return to the Summary page after viewing details.
Click to Purchases Martial Arts Studio KPI Dashboard in Power BI
Excel as the Data Source – Easy to Maintain
One of the best things about this dashboard is how simple the backend is. The entire data source is based in an Excel file, with three primary tabs:
1. Input_Actual Sheet
Enter the actual performance values:
-
KPI Name
-
Month (use the first day of the month, e.g., 01-Jan-2025)
-
MTD (Month-to-Date) Numbers
-
YTD (Year-to-Date) Numbers
2. Input_Target Sheet
Fill the target values in the same format as Actual.
3. KPI Definition Sheet
This sheet includes:
-
KPI Number
-
KPI Group
-
KPI Name
-
Unit
-
Formula
-
Definition
-
Type (LTB/UTB)
This structure keeps your reporting agile and user-friendly.
Why Power BI for Martial Arts Studio Performance?
Many studio owners struggle with static reports and complex spreadsheets. Power BI takes all of that pain away with interactive, drill-down reporting and visual clarity.
Here’s why this solution fits perfectly:
-
✅ Real-time insights
-
✅ Easy filtering with slicers
-
✅ Better decision-making for class scheduling, budget, and HR
-
✅ Quickly identifies underperforming areas
-
✅ Visual appeal helps with stakeholder presentations
Advantages of Martial Arts Studio KPI Dashboard in Power BI
Let’s break down the core benefits of this tool:
✔️ Data-Driven Decisions
You no longer guess whether your student engagement or revenue is up. You know it with numbers.
✔️ Efficiency Improvement
By tracking MTD and YTD progress, you can optimize class timings, instructor hours, and studio utilization.
✔️ Better Resource Allocation
Spot areas of overspending or underperformance, and reallocate resources intelligently.
✔️ Improved Accountability
With drill-through KPI details and assigned ownership, everyone knows their targets and outcomes.
✔️ Historical Comparison
PY (Previous Year) data helps you identify seasonality and long-term trends—crucial for planning marketing and budgeting.
Use Cases – Who Benefits the Most?
This dashboard is ideal for:
-
🧑🏫 Studio Owners & Managers
-
📋 Operations Teams
-
🥋 Lead Instructors
-
💼 Franchise Owners
-
📈 Marketing & Finance Teams
From small dojos to large franchise chains, anyone managing performance metrics will benefit immensely.
Important KPIs to Track in a Martial Arts Studio
Here are some examples of KPIs you might want to track:
-
New Enrollments (UTB)
-
Class Attendance Rate (UTB)
-
Average Class Size (UTB)
-
Monthly Revenue (UTB)
-
Dropout Rate (LTB)
-
Equipment Maintenance Issues (LTB)
-
Instructor Satisfaction Score (UTB)
-
Average Session Duration (LTB/UTB based on goal)
Categorize these KPIs into groups like Finance, Operations, Training, HR, etc.
Best Practices for the Martial Arts Studio KPI Dashboard
Following best practices will ensure that your dashboard remains accurate, insightful, and actionable.
✅ Keep KPI Definitions Clear
Use the KPI Definition sheet to document what each metric means. This avoids misinterpretation.
✅ Use Consistent Data Format
Enter dates using the first day of the month. Stick to a uniform naming convention for KPI names.
✅ Regularly Update Your Data
Update the actual and target values each month without fail. That way, trends remain current.
✅ Prioritize Actionable KPIs
Don’t overload with vanity metrics. Only include KPIs you can act on.
✅ Train Your Team
Ensure everyone knows how to use slicers, navigate pages, and read the dashboard insights.
How to Get Started with Your Own Dashboard
To implement this dashboard in your studio:
Prepare Your Excel File
- Define KPIs, targets, and formulas.
- Input past 12 months’ data.
Connect Excel to Power BI
- Load the three sheets (Actual, Target, KPI Definition).
- Build the relationships using KPI Name and Date.
Build Visuals
- Use card visuals for KPIs.
- Tables for summary view.
- Combo charts for trends.
- Drill-through for definitions.
Add Navigation Buttons
- Insert back buttons and slicers.
- Hide drill-through pages for a clean look.
Publish & Share
- Upload to Power BI Service or export PDF for stakeholder use.
Don’t want to build from scratch? Use a ready-to-use template that you can customize with your data.
Conclusion
The Martial Arts Studio KPI Dashboard in Power BI transforms performance monitoring into a clear, visual, and actionable experience. Instead of drowning in data, you’ll now get real-time insights that drive your decisions forward.
From MTD and YTD comparisons to trend tracking and historical performance—it’s all right there, at your fingertips. If you want your martial arts studio to grow smarter, more efficiently, and more profitably, then this dashboard is your next step.
Frequently Asked Questions (FAQs)
What does LTB and UTB mean in KPIs?
-
LTB = Lower the Better (e.g., Dropout Rate)
-
UTB = Upper the Better (e.g., Enrollments, Attendance)
This helps interpret whether a higher or lower value is favorable.
Can I edit the KPIs and definitions?
Yes, just open the KPI Definition sheet in the Excel source file and update the entries.
How often should I update the dashboard?
Monthly updates are ideal. You can update MTD and YTD numbers at the beginning or end of each month.
Do I need coding knowledge to use Power BI?
No coding is required to use this template. However, familiarity with Power BI Desktop and Excel is helpful.
Can I add more KPI Groups?
Absolutely. Add new groups to the KPI Definition sheet, and Power BI will recognize them through slicers.
What’s the benefit of comparing CY vs PY?
Comparing current year with previous year helps identify trends and evaluate growth or decline in performance.
Is this dashboard suitable for franchises?
Yes. You can scale this dashboard across multiple branches by adding a “Branch” column to your data.
Visit our YouTube channel to learn step-by-step video tutorials