In today’s digital world, cybersecurity awareness isn’t just a best practice—it’s a necessity. Organizations must not only implement security tools but also measure how well their teams understand and follow security protocols. That’s where a Cybersecurity Awareness KPI Dashboard in Power BI becomes invaluable.
This article provides a complete, easy-to-understand, and SEO-optimized overview of how to use Power BI to track cybersecurity awareness KPIs. You’ll learn about the dashboard’s key features, best practices, advantages, and much more.
Click to Purchases Cybersecurity Awareness KPI Dashboard in Power BI
What Is a Cybersecurity Awareness KPI Dashboard?
A Cybersecurity Awareness KPI Dashboard is a data visualization tool that tracks the performance of cybersecurity training and awareness activities within an organization.
With this dashboard, you can:
- Measure how many employees have completed training.
- Monitor adherence to security policies.
- Track monthly progress against targets.
- Compare year-over-year improvements in awareness.
When built in Power BI, this dashboard offers dynamic filters, drill-through options, and colorful visuals that make it easy to digest critical metrics at a glance.
Why Use Power BI for Cybersecurity Awareness KPIs?
Power BI is a powerful business analytics service by Microsoft. It enables you to:
- Create interactive reports
- Use slicers and filters for custom views
- Import data from Excel and other sources
- Display trends with combo charts
- Drill through to detailed data
With Power BI, you can keep stakeholders informed and identify areas that need attention—without needing to code or spend on expensive software.
Components of the Cybersecurity Awareness KPI Dashboard in Power BI
The dashboard comes with three key pages that deliver in-depth performance tracking:
Summary Page
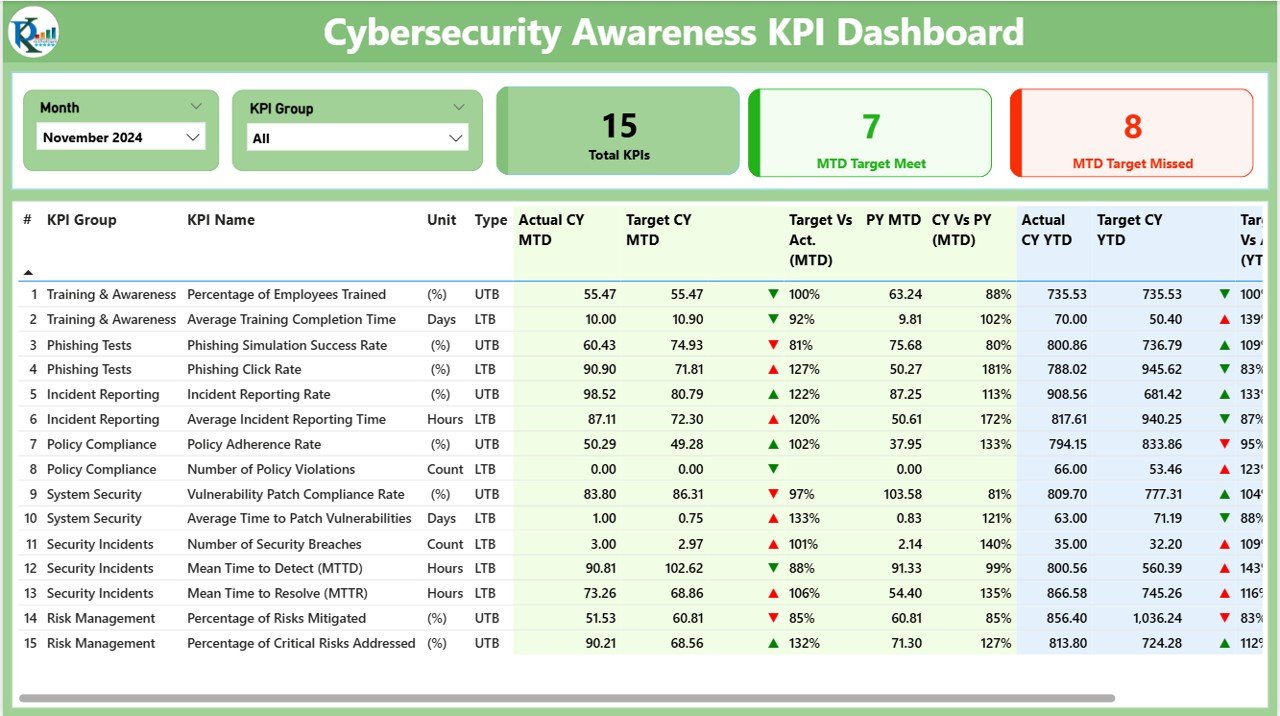
This is the heart of the dashboard. Here’s what you’ll find:
- Slicers: Month and KPI Group filters at the top for custom views.
Click to Purchases Cybersecurity Awareness KPI Dashboard in Power BI
KPI Cards:
- Total KPIs Count
- MTD (Month-to-Date) Target Met Count
- MTD Target Missed Count
Detailed KPI Table with columns:
- KPI Number
- KPI Group
- KPI Name
- Unit of Measurement
- Type (LTB or UTB)
- Actual CY MTD
- Target CY MTD
- MTD Icon (Green ▲ or Red ▼)
- Target Vs Actual (MTD%)
- PY MTD
- CY Vs PY (MTD%)
- Actual CY YTD
- Target CY YTD
- YTD Icon
- Target Vs Actual (YTD%)
- PY YTD
- CY Vs PY (YTD%)
Each value is visually supported with icons and percentages, making interpretation quick and clear.
KPI Trend Page

This page gives visual insight into performance over time.
Two combo charts:
- MTD Chart: Shows Actuals, Targets, and Previous Year
- YTD Chart: Same format as above
- KPI slicer: Lets users choose specific KPIs to explore trend details
This page helps in spotting declining or improving awareness trends over months.
KPI Definition Page (Drill-through)
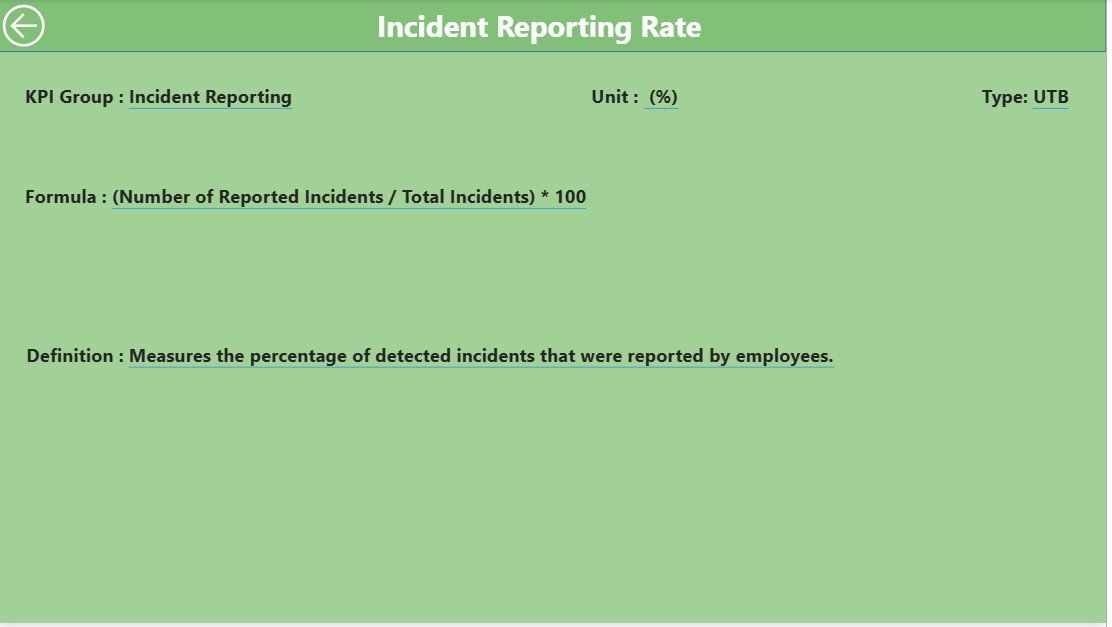
Though hidden by default, users can drill through from the Summary page to view:
- KPI Formula
- Detailed KPI Definition
There’s also a Back button on the top left corner to return to the main Summary page effortlessly.
Data Input Structure in Excel
This dashboard uses an Excel file as its data source, organized into three clear sheets:
Click to Purchases Cybersecurity Awareness KPI Dashboard in Power BI
Input Actual Sheet

Enter:
- KPI Name
- Month (use the first date of the month)
- MTD Actual
- YTD Actual
Input Target Sheet

Enter:
- KPI Name
- Month (first date format)
- MTD Target
- YTD Target
KPI Definition Sheet
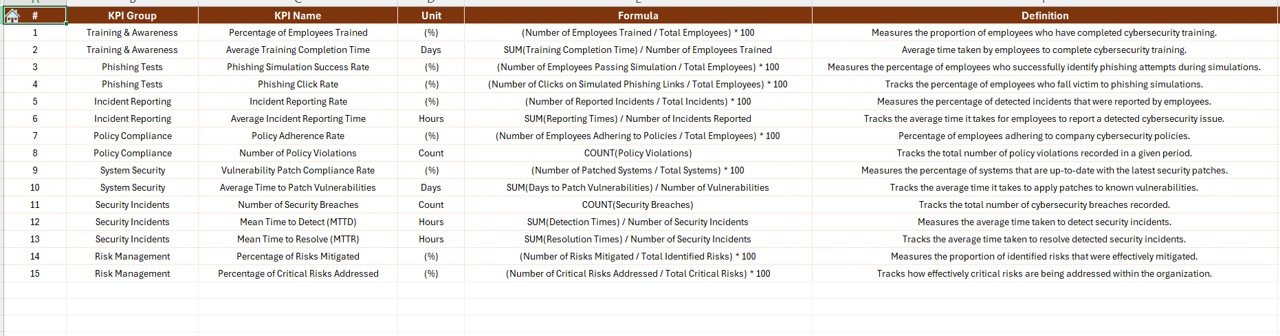
Fill in:
- KPI Number
- KPI Group
- KPI Name
- Unit
- Formula
- Definition
- Type (LTB or UTB)
Advantages of Cybersecurity Awareness KPI Dashboard in Power BI
🔄 Real-Time Monitoring
Keep track of KPI performance instantly using dynamic filters and cards.
📊 Data-Driven Insights
With comparisons between current and past data, managers can take informed actions.
🌐 Centralized Information
All awareness-related KPIs are in one place—no more scattered data or manual tracking.
🔄 Drill-Down Flexibility
Quickly dig into detailed KPI formulas and descriptions with drill-through capabilities.
📊 Visual Clarity
Icons and charts make data easier to understand for technical and non-technical users.
Best Practices for Using Cybersecurity Awareness KPI Dashboard
Click to Purchases Cybersecurity Awareness KPI Dashboard in Power BI
To get the most out of your Power BI dashboard, follow these tips:
✅ Define Clear KPIs
Make sure your KPIs are specific, measurable, and aligned with cybersecurity goals.
✅ Update Data Regularly
Ensure the Excel file is updated every month for accurate MTD and YTD analysis.
✅ Customize Slicers for User Roles
Let different departments or roles filter and view data most relevant to them.
✅ Use Conditional Formatting
Use icons or colors to highlight underperformance (e.g., red arrows for missed targets).
✅ Leverage Drill-Through
Encourage users to drill through and explore KPI formulas to understand metrics better.
✅ Monitor Trends
Use the Trend page frequently to identify and respond to long-term behavioral patterns.
How Can This Dashboard Improve Cybersecurity Posture?
This dashboard doesn’t just track numbers—it changes behavior. By keeping visibility high:
- Employees stay motivated to complete training on time.
- Managers identify gaps in awareness early.
- Executives understand the ROI of awareness programs.
Better visibility means better decisions—and better cybersecurity.
How to Customize the Dashboard for Your Organization?
You can easily tailor the dashboard to fit your needs:
- Change KPI Names or Groups: Just update the KPI Definition sheet.
- Add More KPIs: Expand the rows in the input sheets and refresh Power BI.
- Switch Themes: Use Power BI’s built-in theme options to match your brand.
- Integrate with Power Automate: Send alerts when KPIs fall below thresholds.
Conclusion
The Cybersecurity Awareness KPI Dashboard in Power BI is an essential tool for any organization serious about data security. With real-time insights, visual clarity, and user-friendly navigation, it empowers everyone from analysts to executives to monitor and improve cybersecurity awareness across the board.
If you want to make your cybersecurity training more accountable, measurable, and effective, this dashboard is your go-to solution.
Frequently Asked Questions (FAQs)
1. What is the purpose of a Cybersecurity Awareness KPI Dashboard?
It tracks how well employees understand and follow cybersecurity policies by measuring various KPIs related to awareness activities.
2. Why use Power BI for this dashboard?
Power BI makes it easy to create interactive, dynamic, and visually engaging dashboards without any coding.
3. How do I update the dashboard each month?
Update the Excel sheets (Input Actual and Input Target) with new data and refresh the Power BI file.
4. Can I add more KPIs to this dashboard?
Yes, just add new entries in the Excel file and refresh the Power BI model.
5. What does LTB and UTB mean in KPI Type?
LTB = Lower The Better (e.g., Number of incidents) UTB = Upper The Better (e.g., Training completion rate)
6. Is drill-through functionality important?
Absolutely. It helps users understand the KPI logic, formulas, and purpose behind each metric.
7. Can I share this dashboard online?
Yes, you can publish it to the Power BI Service and share with your team using secure permissions.
Click to Purchases Cybersecurity Awareness KPI Dashboard in Power BI
Visit our YouTube channel to learn step-by-step video tutorials