In today’s fast-paced education landscape, institutions face mounting pressure to comply with complex regulations. Furthermore, stakeholders demand transparent reporting and data-driven insights. Consequently, tracking regulatory adherence through an Excel-based KPI dashboard empowers administrators, educators, and compliance officers to monitor performance in real time. This article explains how the Education and Learning Regulatory Adherence KPI Dashboard in Excel helps you stay on top of compliance requirements, offers hands-on guidance to implement it effectively, and shares best practices to maximize its impact.
Click to Purchases Education and Learning Regulatory Adherence KPI Dashboard in Excel
What Is an Education and Learning Regulatory Adherence KPI Dashboard?
An Education and Learning Regulatory Adherence KPI Dashboard in Excel provides a centralized platform to measure key compliance indicators across curricula, processes, and accreditation standards. Rather than juggling multiple spreadsheets and manual reports, you gain:
-
Real-time visibility: You view current-month and year-to-date (YTD) metrics at a glance.
-
Trend analysis: You track month-over-month and year-over-year performance for each KPI.
-
Data accuracy: You minimize manual errors by structuring inputs and automating calculations.
-
Interactive reporting: You slice and dice data via dropdowns and pivot-style charts.
Because the template lives in Excel, you can leverage familiar tools—pivot tables, conditional formatting, and formulas—without investing in dedicated BI software. As a result, small schools, training centers, and large educational boards can adopt it quickly.
Key Features of the Dashboard
This dashboard includes seven worksheets designed for clarity, flexibility, and comprehensive insights. Each sheet plays a crucial role:
Home Sheet

- Serves as the index page.
- Contains six buttons that jump to respective worksheets.
- Provides navigational ease, so you spend less time hunting for data.
Click to Purchases Education and Learning Regulatory Adherence KPI Dashboard in Excel
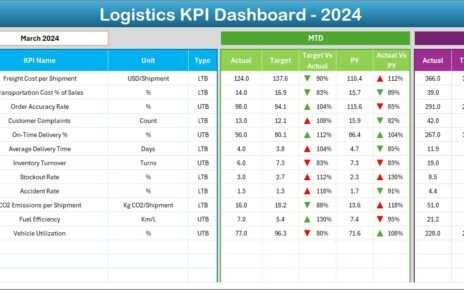
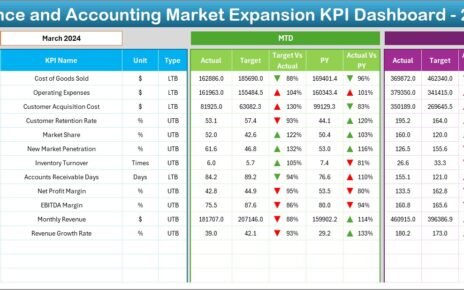
Dashboard Sheet

- Acts as the main reporting hub.
- Displays Month-to-Date (MTD) Actual, Target, and Previous Year (PY) values.
- Shows Target vs. Actual and PY vs. Actual comparisons using up/down conditional-formatting arrows.
- Offers YTD Actual, Target, and PY data with similar visual cues.
KPI Trend Sheet

- Empowers you to select any KPI via a dropdown in cell C3.
- Reveals KPI Group, Unit, Type (Lower the Better/Upper the Better), Formula, and Definition.
- Plots MTD and YTD trend charts for Actual, Target, and PY figures.
Actual Numbers Input Sheet

- Lets you input current year’s Actual values for both MTD and YTD.
- Allows you to set the first month of the year in cell E1, dynamically adjusting the calendar reference.
Target Sheet

- Hosts Target values for every KPI by month (MTD and YTD).
- Maintains clear separation of Actual vs. Target inputs to avoid data overlap.
Click to Purchases Education and Learning Regulatory Adherence KPI Dashboard in Excel
Previous Year Numbers Sheet

- Mirrors the “Target Sheet” layout for PY values.
- Enables side-by-side comparison to evaluate performance improvements.
KPI Definition Sheet

- Stores each KPI’s metadata: Name, Group, Unit, Formula, and Definition.
- Acts as the data source for dropdown lists and chart labels.
Advantages of an Education and Learning Regulatory Adherence KPI Dashboard
When you implement this dashboard, you unlock several benefits:
-
Enhanced Compliance Oversight
You monitor critical indicators—such as curriculum update rates, audit completion percentages, and accreditation milestones—in one place. Therefore, you spot gaps before they trigger regulatory penalties. -
Streamlined Reporting
Instead of creating separate monthly or quarterly reports, you update raw numbers on the input sheets. Then, the dashboard automatically reflects changes through formulas and pivot-style visuals. -
Improved Decision-Making
By comparing Actual vs. Target and PY trends, you identify best practices and areas needing intervention. Moreover, department heads receive actionable insights rather than raw data. -
Scalable Structure
You can add new KPIs by updating the KPI Definition sheet. Next, populate target and actual values; the dashboard integrates them without additional configuration. -
Cost-Effective Solution
Leveraging Excel eliminates licensing fees for specialized BI platforms. Plus, most educational institutions already maintain Office 365 or standalone Excel licenses.
How to Use the Dashboard: Step-by-Step Guide
Set Up KPI Definitions
- Open the KPI Definition sheet.
- List each KPI along with its Group, Unit, Formula, and concise Definition.
- Mark each KPI Type as “Lower the Better (LTB)” or “Upper the Better (UTB).”
Enter Target Values
- Navigate to the Target sheet.
- Fill in monthly MTD and cumulative YTD targets for each KPI.
- Confirm that date references align with the fiscal calendar.
Input Actual Figures
- Switch to the Actual Numbers Input sheet.
- Enter the first month of the year in cell E1; Excel adjusts monthly headers automatically.
- Input MTD and YTD Actual data for each KPI.
Add Previous Year Data
- Go to the Previous Year Numbers sheet.
- Mirror the layout of the Target sheet and enter equivalent PY values.
Review the Dashboard
- Return to the Dashboard sheet.
- Use the dropdown in cell D3 to select the month you want to analyze.
- Observe conditional-formatting arrows that highlight performance against targets and PY.
Analyze Trends
- Click the KPI Trend sheet.
- Choose any KPI from the dropdown in C3.
- Study the line charts that display MTD and YTD trends for Actual, Target, and PY.
Navigate Home
- Use buttons on the Home sheet to jump between tabs seamlessly.
By following these steps, you maintain an up-to-date compliance dashboard with minimal manual effort.
Best Practices for the Education and Learning Regulatory Adherence KPI Dashboard
To maximize effectiveness and ensure data integrity, adopt these best practices:
-
Validate Input Data Regularly
First, establish a schedule to audit raw data entries. Next, cross-check source reports (e.g., LMS logs, audit records) to prevent discrepancies. -
Maintain Formula Consistency
Wherever possible, use named ranges and structured table references. Doing so ensures that formulas automatically adjust if you add new rows or columns. -
Use Dynamic Ranges
Leverage Excel’s Table feature (Insert → Table). Then, apply formulas like[@Actual]and[@Target]to automatically encompass new data points. -
Protect Critical Sheets
Lock cells containing formulas and pivot cache settings. Thus, you prevent accidental overwrites when non-technical staff update input sheets. -
Document KPI Definitions
Include clear, concise definitions on the KPI Definition sheet. Consequently, any user—from compliance officers to department heads—understands what each metric measures. -
Schedule Monthly Updates
Assign responsibility to a compliance coordinator for monthly data entry. Since you update only the input sheets, you preserve dashboard integrity and consistency. -
Train End Users
Conduct brief workshops to demonstrate dropdown usage, chart interpretation, and button navigation. As a result, teams engage more deeply with the dashboard’s insights. -
Archive Historical Data
At fiscal year-end, copy the dashboard workbook and archive it in a secure location. Then, clear the input sheets for the new year—this creates a clean slate while preserving historical records.
Click to Purchases Education and Learning Regulatory Adherence KPI Dashboard in Excel
How Does the Dashboard Drive Compliance Improvement?
This dashboard not only tracks compliance but also fosters a culture of continuous improvement:
-
Visibility
Stakeholders view performance metrics in real time. Therefore, everyone stays aligned on regulatory priorities. -
Accountability
Transparent reporting assigns responsibility—each department observes how its actions impact overall compliance. -
Proactive Intervention
By spotting downward trends early, you apply corrective measures (e.g., refresher training, process audits) before violations occur. -
Data-Driven Strategy
You allocate resources to areas that need the most support. For instance, if audit completion rates lag, you can reassign staff or adjust timelines.
Conclusion
Implementing the Education and Learning Regulatory Adherence KPI Dashboard in Excel equips educational institutions with a robust, cost-effective tool to monitor compliance, streamline reporting, and drive strategic improvements. By following the setup guide, adopting best practices, and leveraging the interactive features, you empower teams to maintain regulatory standards with confidence. In addition, your institution benefits from enhanced transparency, proactive decision-making, and long-term data integrity.
Frequently Asked Questions with Answers
1. What KPIs should I include for regulatory adherence?
Focus on metrics such as audit completion rate, policy training completion, incident resolution time, accreditation milestones achieved, and document review frequency.
2. How often should I update the dashboard?
Update input sheets monthly to capture MTD and YTD metrics. For high-risk areas, consider weekly updates to catch issues earlier.
3. Can I add custom KPIs to this dashboard?
Yes. Simply add new entries on the KPI Definition sheet, then enter targets and actuals in the respective sheets. The dashboard adapts automatically.
4. How do I handle mid-year regulation changes?
Insert a new column in the Target and Previous Year Numbers sheets for the revised period. Update definitions accordingly, and adjust dropdown ranges if needed.
5. Can non-Excel users access the dashboard?
Export specific charts or tables as PDFs for distribution. Alternatively, share the workbook via a cloud platform with view-only permissions to prevent edits.
6. How do I reset the dashboard for a new fiscal year?
Archive the current workbook. Then, clear Actual, Target, and PY sheets while retaining the KPI Definition sheet. Update cell E1 on the Actual Numbers Input sheet to the new year.
7. Does this dashboard support multi-campus setups?
Yes. Add a “Campus” column in the input sheets and use Excel’s slicers or pivot filters to segment data by location.
8. How can I secure sensitive data?
Protect sheets containing formulas and raw data. Use Excel’s password protection, and limit edit permissions via your organization’s file-sharing policies.
Visit our YouTube channel to learn step-by-step video tutorials
Click to Purchases Education and Learning Regulatory Adherence KPI Dashboard in Excel
Watch the step-by-step video tutorial: