Employee turnover is one of the most important metrics that companies track. Understanding turnover trends allows organizations to take proactive steps toward improving employee retention. The Employee Turnover Dashboard in Excel is a comprehensive tool that helps HR departments and management teams monitor key performance indicators (KPIs) related to employee turnover, resignation, and termination.
In this article, we will explore the key features of the Employee Turnover Dashboard, the KPIs it tracks, and how it can be used to improve HR decision-making.
What is the Employee Turnover Dashboard in Excel?
The Employee Turnover Dashboard in Excel is a ready-to-use template that provides HR professionals with real-time insights into employee turnover trends. It includes various worksheets, charts, slicers, and cards that visualize data to help identify patterns in employee exits, whether through resignation, termination, or retirement.
The dashboard tracks key metrics such as total headcount, turnover rates, and trends by department, gender, location, and age group. By monitoring these KPIs, HR teams can make informed decisions to improve employee retention strategies.
Key Features of the Employee Turnover Dashboard
Click to buy Employee Turnover Dashboard in Excel
The Employee Turnover Dashboard includes multiple worksheets and charts designed to provide detailed insights into turnover trends. Here are the key features of each section:
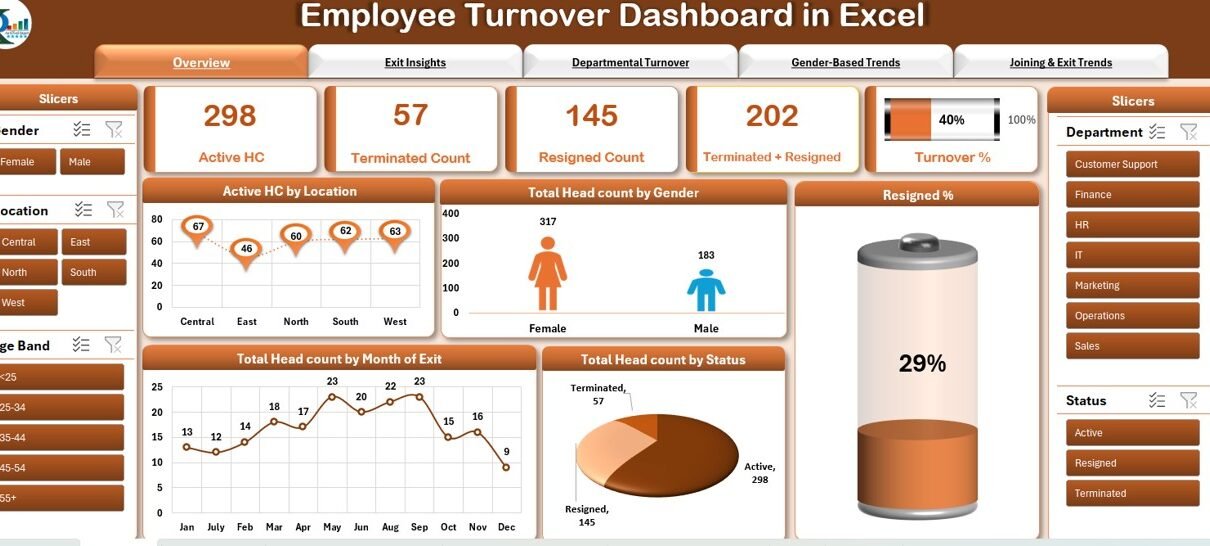
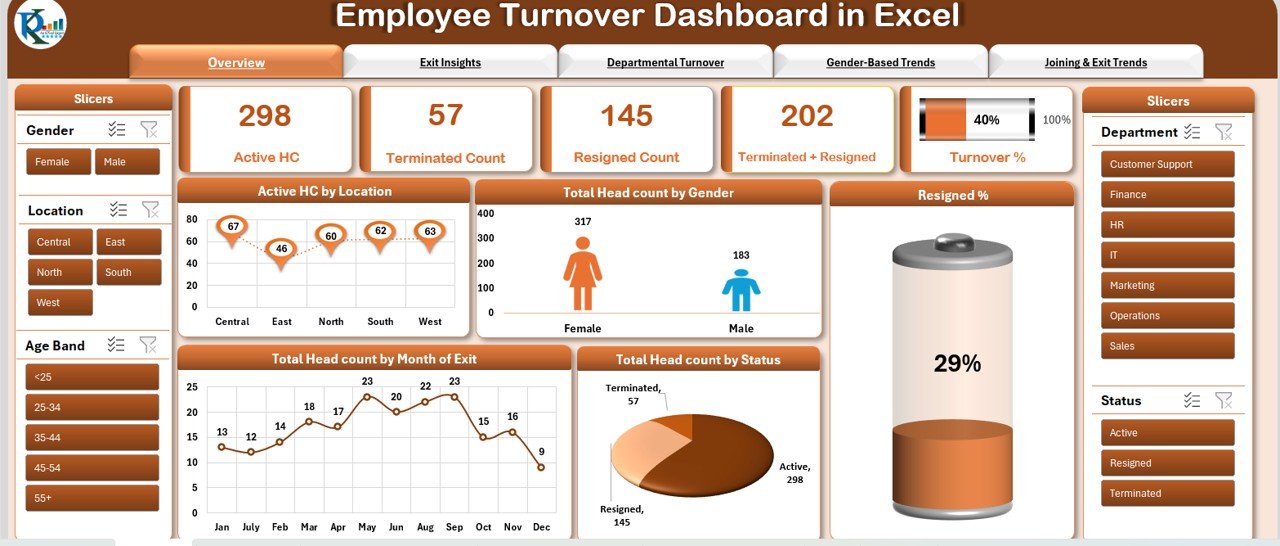
1. Overview Sheet Tab
The Overview Sheet provides a high-level summary of employee turnover data. It includes several charts, cards, and slicers for easy tracking of key metrics.
Cards:
- Active HC (Headcount): Displays the current number of active employees.
- Terminated Count: Shows the number of employees who have been terminated.
- Resigned Count: Displays the number of employees who resigned.
- Terminated + Resigned Count: Shows the total number of employees who either resigned or were terminated.
- Turnover %: Calculates the turnover percentage based on the total number of exits compared to the total headcount.
Charts:
- Active HC by Location: Displays the active headcount segmented by location.
- Total Headcount by Gender: Shows the total headcount distribution based on gender.
- Resigned %: Displays the percentage of employees who resigned over a specific period.
- Total Headcount by Month of Exit: Shows the number of employees who left by month.
- Total Headcount by Status: Displays the current headcount divided by employment status (active, terminated, etc.).
Click to buy Employee Turnover Dashboard in Excel
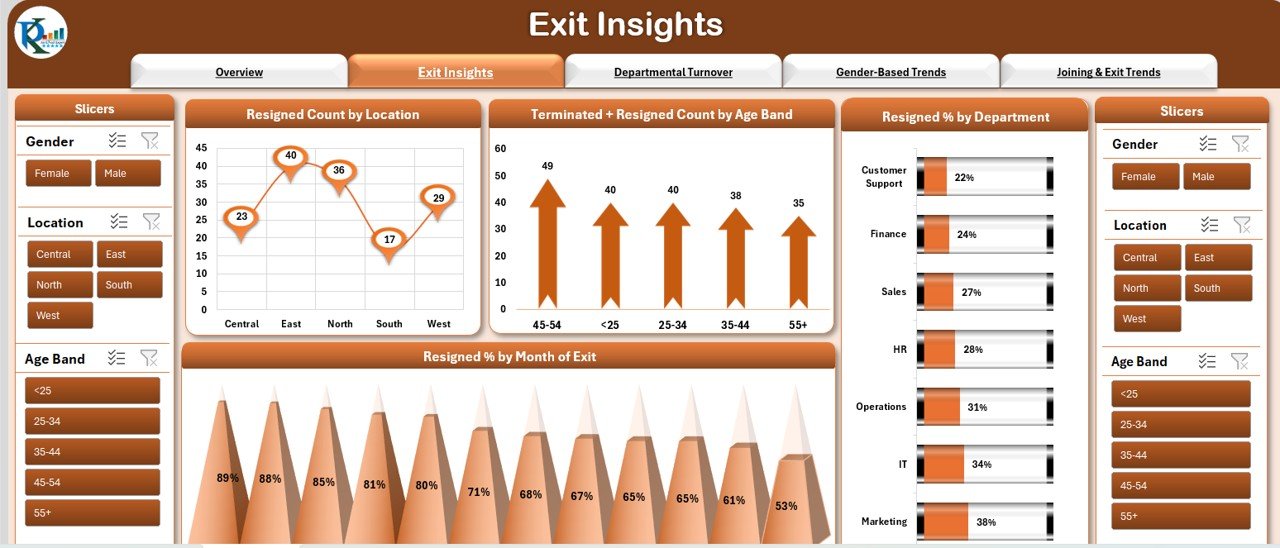
2. Exit Insights Sheet Tab
The Exit Insights Sheet provides a detailed breakdown of employee exits and their trends.
Charts:
- Resigned Count by Location: Shows where employees who resigned were located.
- Terminated + Resigned Count by Age Band: Breaks down the number of resignations and terminations by age group.
- Resigned % by Department: Displays the resignation rate for each department.
- Resigned % by Month of Exit: Shows resignation rates based on the month employees left.
Click to buy Employee Turnover Dashboard in Excel
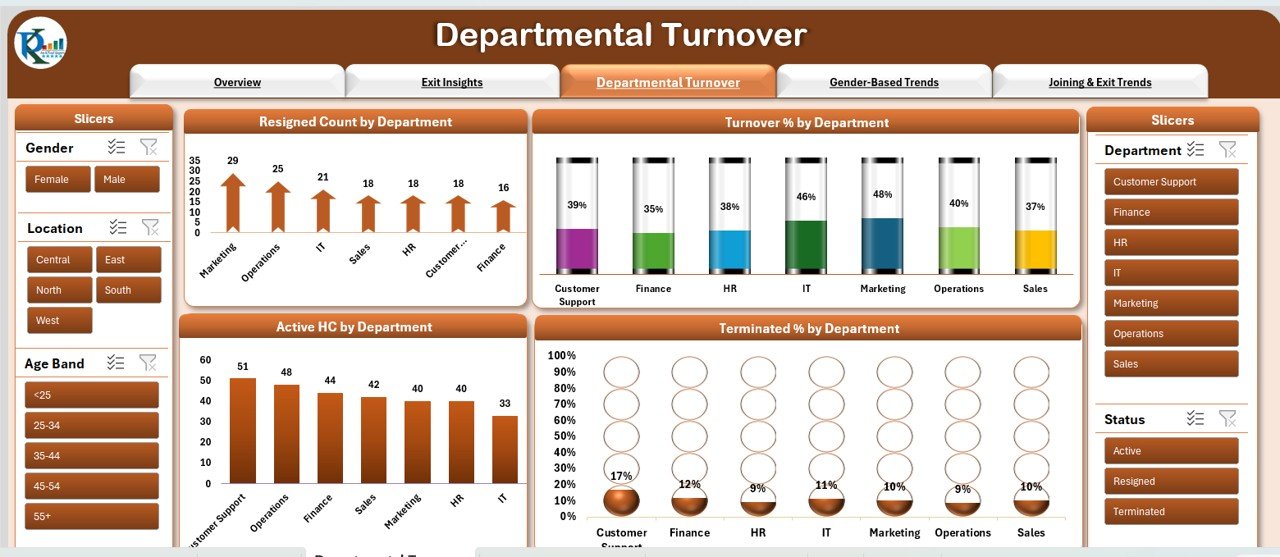
3. Departmental Turnover Sheet Tab
This sheet focuses on department-wise turnover data, which is essential for identifying problem areas within specific teams or divisions.
Charts:
- Resigned Count by Department: Displays the number of employees who resigned by department.
- Turnover % by Department: Shows the turnover rate for each department.
- Active HC by Department: Displays the active headcount by department.
- Terminated % by Department: Shows the termination rate by department.
4. Gender-Based Trends Sheet Tab
This sheet provides insights into turnover trends based on employee gender.
Charts:
- Active HC by Gender: Displays the active headcount by gender.
- Terminated Count by Gender: Shows the number of terminations by gender.
- Resigned % by Age Band: Displays the resignation percentage by age group.
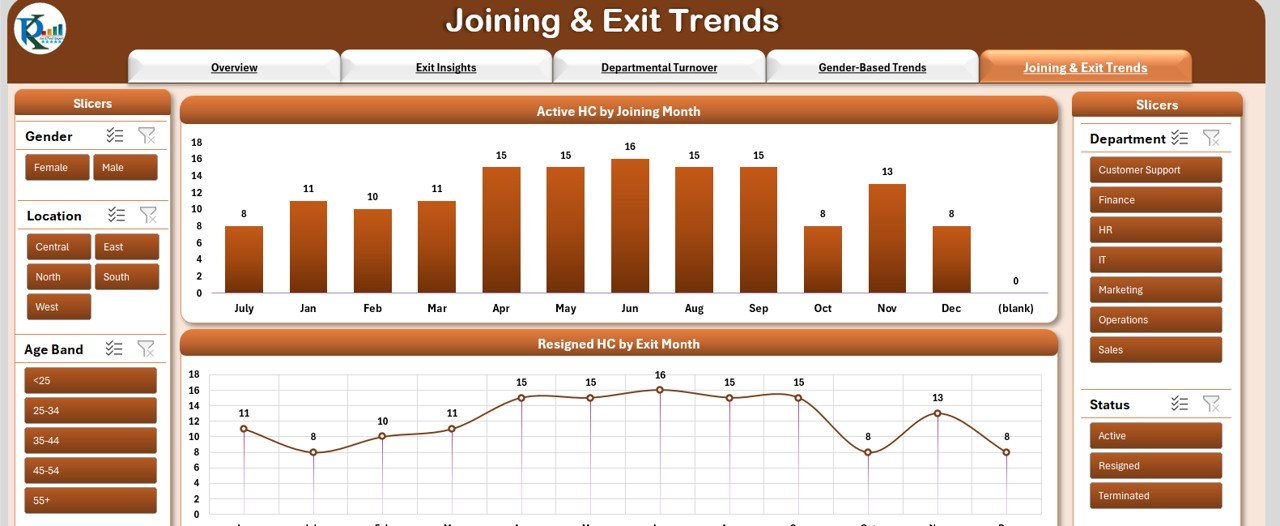
5. Joining & Exit Trends Sheet Tab
The Joining & Exit Trends Sheet shows trends related to employee joinings and exits.
Charts:
- Active HC by Joining Month: Displays the number of new joiners in each month.
- Resigned HC by Exit Month: Shows the number of resignations by the month of exit.
Click to buy Employee Turnover Dashboard in Excel
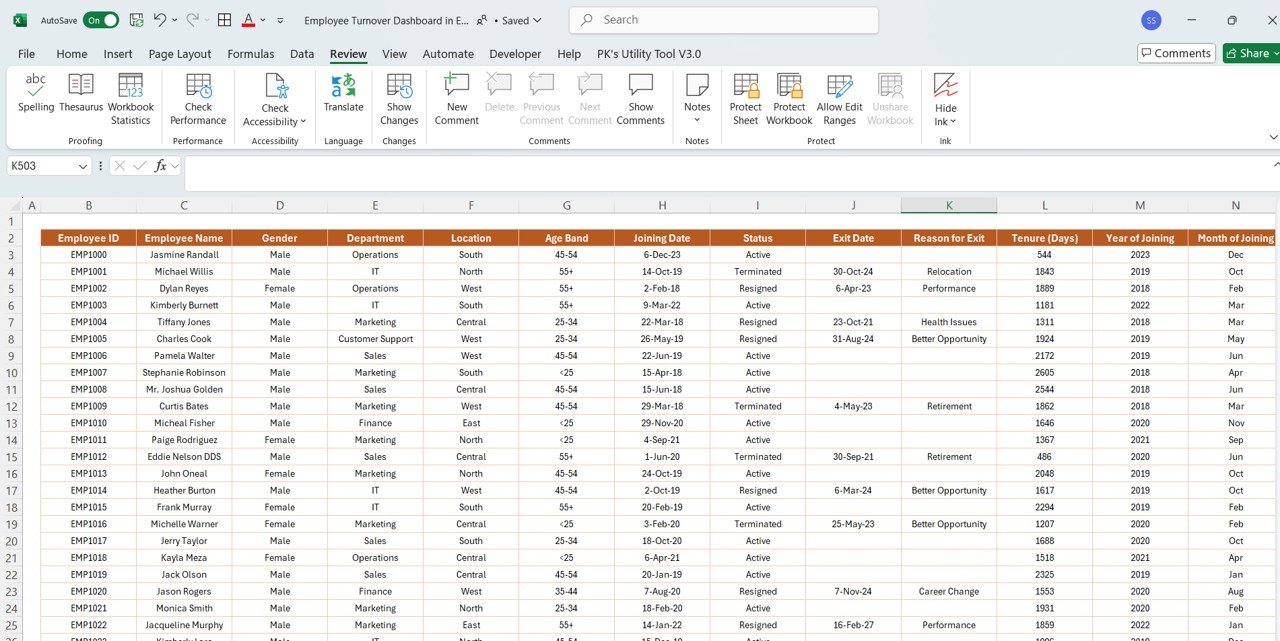
6. Data Sheet Tab
The Data Sheet is where you enter your raw data for the dashboard:
Advantages of Using the Employee Turnover Dashboard
The Employee Turnover Dashboard offers several key benefits to HR teams and decision-makers:
- Comprehensive Tracking: Monitor key turnover metrics, including resignation, termination, and retention rates.
- Data-Driven Insights: Leverage data to make informed decisions about employee retention strategies and operational improvements.
- Visual Representation: Use charts and slicers to quickly interpret complex data and trends.
- Increased Efficiency: The dashboard automates the calculation of turnover percentages and the tracking of various key metrics, saving time.
- Identifying Problem Areas: Departmental and gender-based insights help pinpoint areas that may require targeted interventions.
Opportunity for Improvement in the Employee Turnover Dashboard
Click to buy Employee Turnover Dashboard in Excel
While the Employee Turnover Dashboard is a powerful tool, there are opportunities to enhance its functionality:
-
Automated Data Import: Integrating the dashboard with HR software or employee databases can eliminate manual data entry and keep the dashboard up-to-date automatically.
-
Mobile Access: Making the dashboard mobile-friendly would allow HR managers to access data on the go.
-
Predictive Analytics: Adding forecasting features could help predict future turnover rates based on historical data.
-
Customization for Different Sectors: Customize the dashboard to meet the needs of different industries or company sizes for better relevance.
Best Practices for Using the Employee Turnover Dashboard
To maximize the benefits of the Employee Turnover Dashboard, consider the following best practices:
- Regularly Update Data: Ensure that your data is accurate and up-to-date to provide reliable insights.
- Use Trends for Proactive Measures: Analyze trends in turnover data to take proactive measures in reducing employee exits.
- Set Targeted Goals: Use the dashboard’s KPI features to set specific turnover reduction targets for departments or the organization as a whole.
- Share Insights with Teams: Use the insights from the dashboard to collaborate with department heads and leadership to address turnover issues.
- Track Employee Feedback: Implement feedback mechanisms to track the reasons behind resignations and terminations, which can then be addressed through company policies.
Conclusion
The Employee Turnover Dashboard in Excel is an invaluable tool for monitoring and reducing employee turnover. By tracking key metrics like resignation rates, termination counts, and department-based turnover, this dashboard allows HR teams to make data-driven decisions that improve employee retention and overall workforce management. The visual representation of turnover data helps highlight areas that need attention, allowing companies to implement targeted strategies for improvement.
Frequently Asked Questions (FAQs)
Click to buy Employee Turnover Dashboard in Excel
1. What KPIs are tracked in the Employee Turnover Dashboard?
The dashboard tracks KPIs such as Active HC, Terminated Count, Resigned Count, Turnover %, and department-based turnover data.
2. Can I customize the Employee Turnover Dashboard?
Yes, you can customize the dashboard by adding new KPIs, changing chart types, or modifying the layout to fit your company’s needs.
3. How do I update the Employee Turnover Dashboard?
Simply input your data into the Data Sheet tab, and the dashboard will automatically update with the new figures.
4. Can I use the dashboard for multiple departments?
Yes, the dashboard allows you to track turnover data by department, gender, age band, and other factors.
5. How often should I update the Employee Turnover Dashboard?
It’s recommended to update the dashboard regularly, especially when new employee data is available, such as new hires, terminations, and resignations.
Visit our YouTube channel to learn step-by-step video tutorials
Click to buy Employee Turnover Dashboard in Excel