In today’s conscious consumer world, ethical fashion is no longer just a trend—it’s a necessity. Brands, manufacturers, and stakeholders need reliable tools to measure their sustainability efforts and compliance with ethical standards. That’s where the Ethical Fashion KPI Dashboard in Power BI comes in.
This ready-to-use dashboard helps fashion brands and supply chains monitor key performance indicators (KPIs) that align with ethical practices. From tracking waste reduction and fair wages to comparing yearly progress, this tool is your go-to solution for insightful, data-driven decisions.
Click to Purchases Ethical Fashion KPI Dashboard in Power BI
What is the Ethical Fashion KPI Dashboard in Power BI?
The Ethical Fashion KPI Dashboard in Power BI is a visual analytics solution that connects to an Excel-based dataset. It offers a centralized view of ethical fashion metrics, ensuring that stakeholders remain informed and accountable across all levels.
This dashboard includes three powerful pages:
- Summary Page
- KPI Trend Page
- KPI Definition Page
Each section serves a specific purpose and together they form a comprehensive reporting ecosystem.
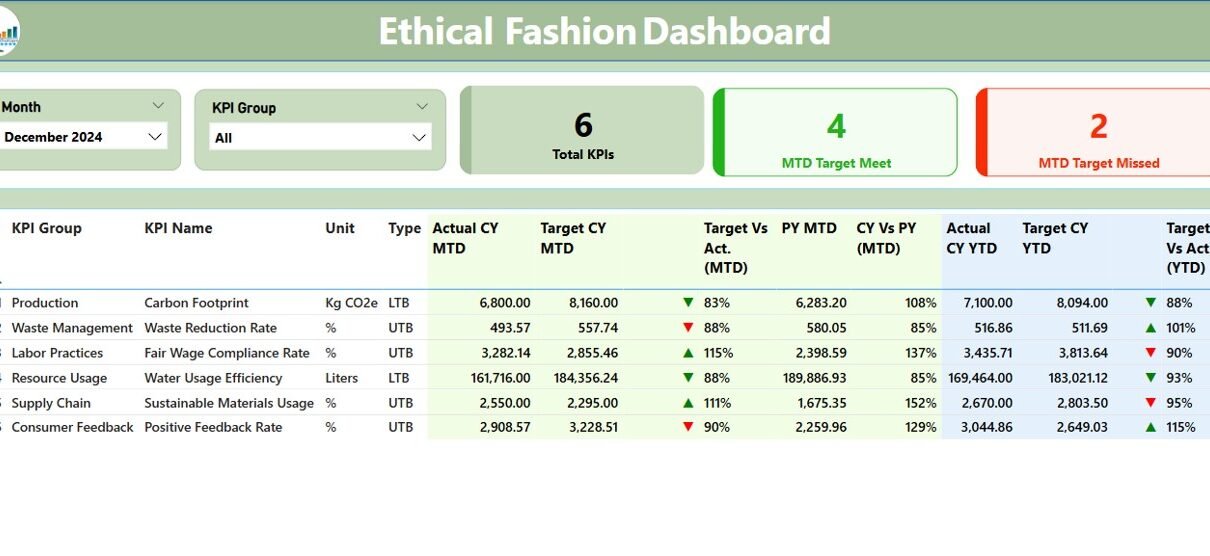
Summary Page: Your Ethical Performance at a Glance
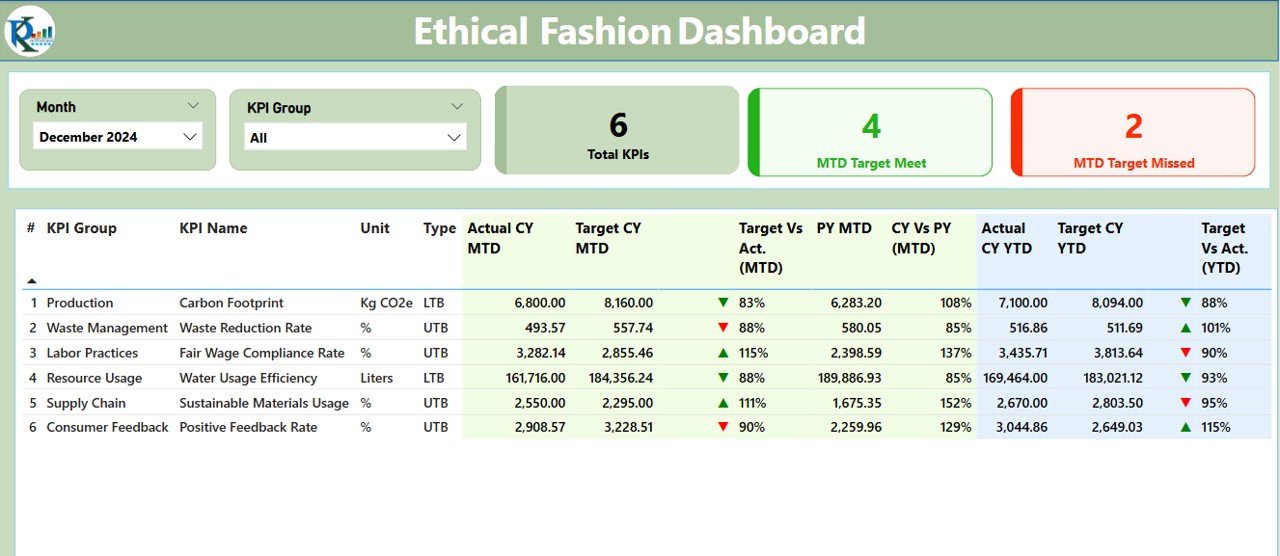
This main dashboard page offers:
- Month Selector: Filter KPIs by reporting month.
- KPI Group Filter: Focus on specific categories like Labor Rights, Waste Reduction, or Energy Consumption.
Performance Cards:
- Total KPI Count
- MTD (Month-To-Date) Target Met Count
- MTD Target Missed Count
Below the Cards:
A detailed performance table showing:
- KPI Number & Group: Organizes each metric for easy identification.
- KPI Name & Unit: Clear and concise representation of each measure.
- Type: Whether it’s “LTB” (Lower the Better) or “UTB” (Upper the Better).
- Actual vs. Target MTD & YTD: Includes percentage performance and visual status icons (green ▲ for met, red ▼ for missed).
- Comparison to Previous Year (PY): Side-by-side MTD and YTD comparisons with calculated improvement ratios.
With just a few clicks, users can immediately see how well they’re doing in each key area of ethical fashion.
Click to Purchases Ethical Fashion KPI Dashboard in Power BI
KPI Trend Page: Visualize Ethical Progress Over Time
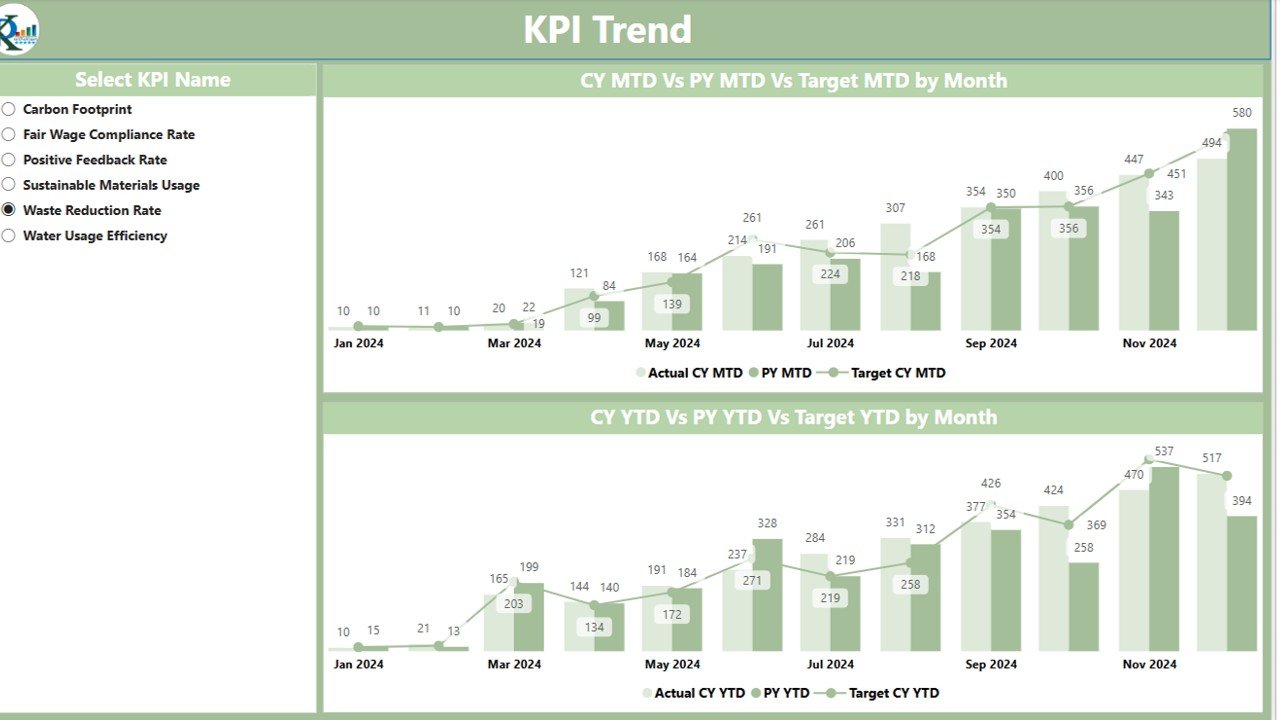
Tracking trends helps identify both success stories and areas for improvement. This page includes:
- Slicer for KPI Selection: Pick any KPI to view trends.
MTD and YTD Combo Charts:
- Actual Current Year
- Actual Previous Year
- Target
With this page, decision-makers can see how ethical initiatives are evolving month-over-month and year-over-year.
KPI Definition Page: Understand Every Metric
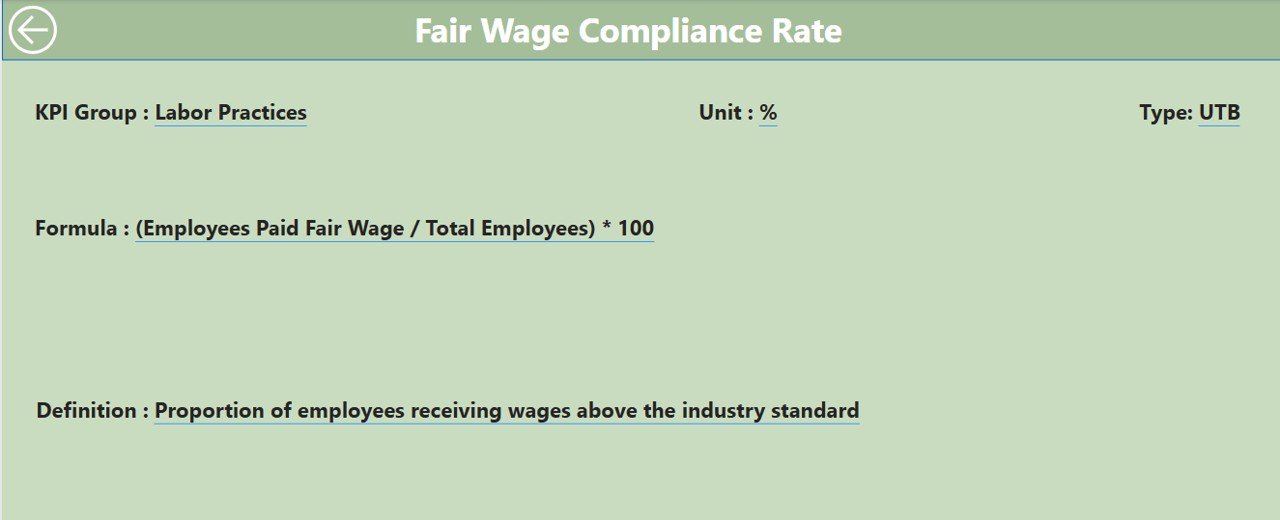
This hidden drill-through page provides transparency behind the numbers:
- KPI Number
- KPI Group
- KPI Name
- Unit
- Formula
- Definition
- Type (UTB/LTB)
Navigate to this page directly from the summary view by drilling through a KPI row. When done, click the Back button in the top-left corner to return.
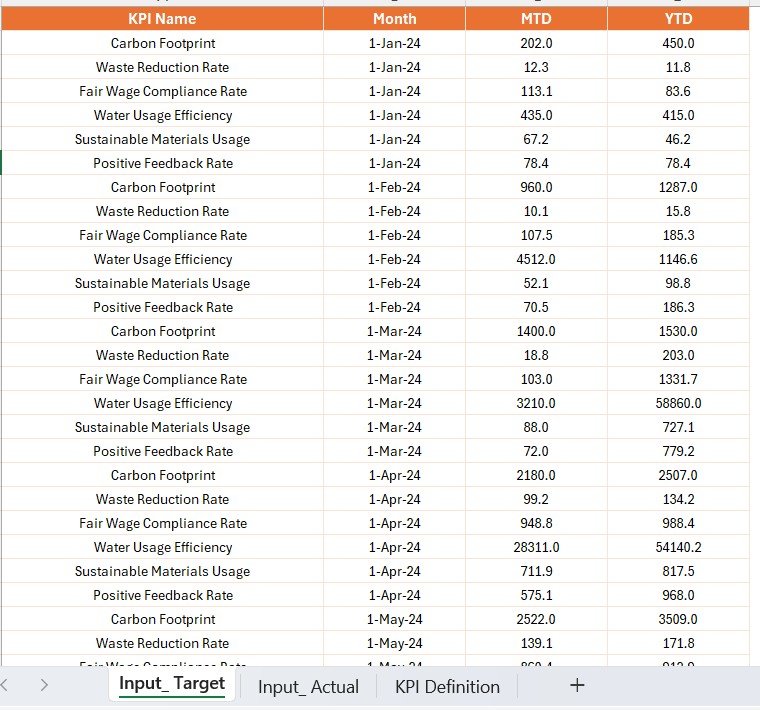
Data Input in Excel: Keep It Simple and Accurate
The dashboard uses an Excel file as its backend. Users need to populate three straightforward worksheets:
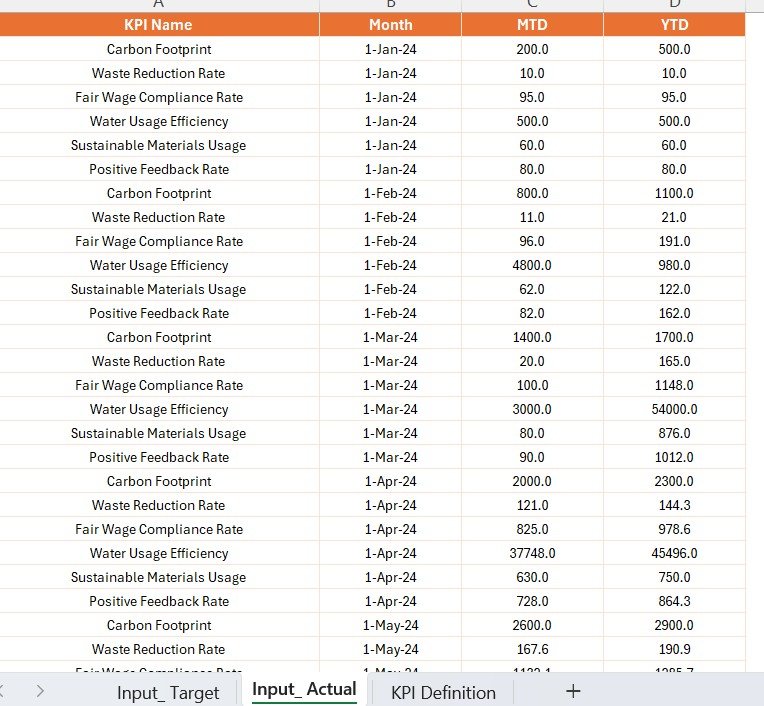
1. Input_Actual Sheet
Fill in actual performance data:
- KPI Name
- Month (use first date of the month)
- MTD Values
- YTD Values
Click to Purchases Ethical Fashion KPI Dashboard in Power BI
2. Input_Target Sheet
Fill in target values:
- KPI Name
- Month
- MTD Target
- YTD Target
3. KPI Definition Sheet
Complete KPI metadata:
- KPI Number
- KPI Group
- KPI Name
- Unit
- Formula
- Definition
- Type (LTB/UTB)
Advantages of Ethical Fashion KPI Dashboard
Implementing this Power BI dashboard offers numerous benefits:
🔹 Holistic View: See real-time ethical performance in one place.
🔹 Quick Insights: Cards and charts quickly show progress and problem areas.
🔹 Data-Driven Decisions: Guide sustainability actions using current and historical data.
🔹 Excel Integration: Easy to update with familiar tools.
🔹 Customizable KPIs: Track metrics that matter most to your brand.
Best Practices for Using the Ethical Fashion KPI Dashboard
To get the most out of this dashboard, follow these best practices:
✏️ Maintain Data Accuracy
Ensure your Excel files are updated regularly and values are double-checked.
🔍 Focus on Actionable KPIs
Don’t overload your dashboard. Include KPIs that truly impact your ethical and business goals.
🕛 Review Monthly
Schedule time to review performance monthly. Use the comparison features to track improvement.
🧲 Train Your Team
Make sure all stakeholders know how to interpret and act on the data.
💪 Align with Certifications
Choose KPIs that align with standards like GOTS, Fair Trade, and B Corp.
Why Should Fashion Brands Monitor Ethical KPIs?
Ethical fashion isn’t just good for the planet—it’s good for business. Consumers increasingly choose brands that show transparency and responsibility.
When you monitor KPIs like fair wages, sustainable materials use, and energy efficiency, you:
- Build brand loyalty.
- Meet regulatory compliance.
- Attract ethically conscious investors and partners.
Conclusion: Make Your Ethical Goals Measurable
The Ethical Fashion KPI Dashboard in Power BI transforms complex sustainability tracking into an intuitive, actionable tool. Whether you’re a small ethical label or a large apparel brand shifting toward greener practices, this dashboard can help.
So, if you want to turn promises into performance, this is the solution you need.
Frequently Asked Questions (FAQs)
1. What is the Ethical Fashion KPI Dashboard used for?
This dashboard tracks ethical and sustainable fashion KPIs using Power BI and Excel data sources. It helps you measure progress and make better decisions.
2. Can I add my own KPIs?
Yes! Just update the KPI Definition sheet in the Excel file and refresh the Power BI dashboard.
3. Is this dashboard suitable for small brands?
Absolutely. It is simple to maintain, Excel-based, and scalable for both small and large fashion brands.
4. How often should I update the data?
Monthly updates are ideal to make full use of the MTD and YTD tracking features.
5. Does it support tracking of certifications?
You can customize it to include KPIs tied to GOTS, B Corp, or Fair Trade certifications.
Click to Purchases Ethical Fashion KPI Dashboard in Power BI
Visit our YouTube channel to learn step-by-step video tutorials