Managing human resources efficiently has never been more important. After all, every organization’s success depends on allocating its workforce in the right way. This is where a Human Resources Resource Allocation KPI Dashboard in Excel comes into play! 🎯
In this article, we will dive deep into everything you need to know about this powerful dashboard. We will explore its key features, the advantages it offers, best practices for using it, and answer some of the most frequently asked questions. So, let’s jump right in!
Click to Purchases Human Resources Resource Allocation KPI Dashboard in Excel
What is a Human Resources Resource Allocation KPI Dashboard?
A Human Resources Resource Allocation KPI Dashboard is an Excel-based tool that tracks, analyzes, and displays critical Key Performance Indicators (KPIs) related to HR resource allocation. It gives HR teams and leadership a bird’s-eye view of how human resources are being utilized across different projects, departments, or activities.
This dashboard empowers decision-makers to monitor trends, identify gaps, and allocate workforce resources more effectively.
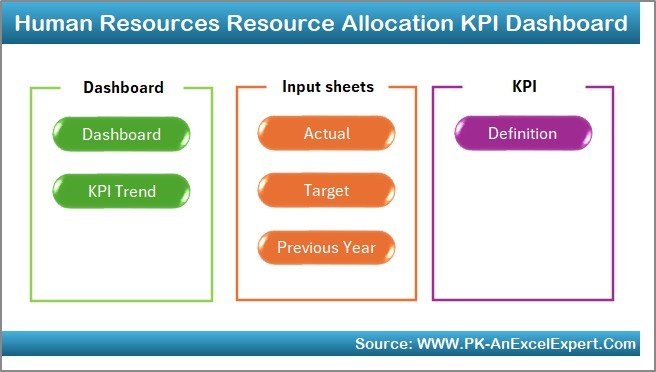
Key Features of the Human Resources Resource Allocation KPI Dashboard
We have created a ready-to-use template that makes it easier for HR professionals to manage their KPIs without building anything from scratch. Let’s take a detailed look at the amazing features included:
Home Sheet 🏠
The Home sheet acts as a navigation center.
- It provides 6 buttons that allow you to jump quickly to other sheets.
- This saves a lot of time and keeps your workflow smooth and efficient.
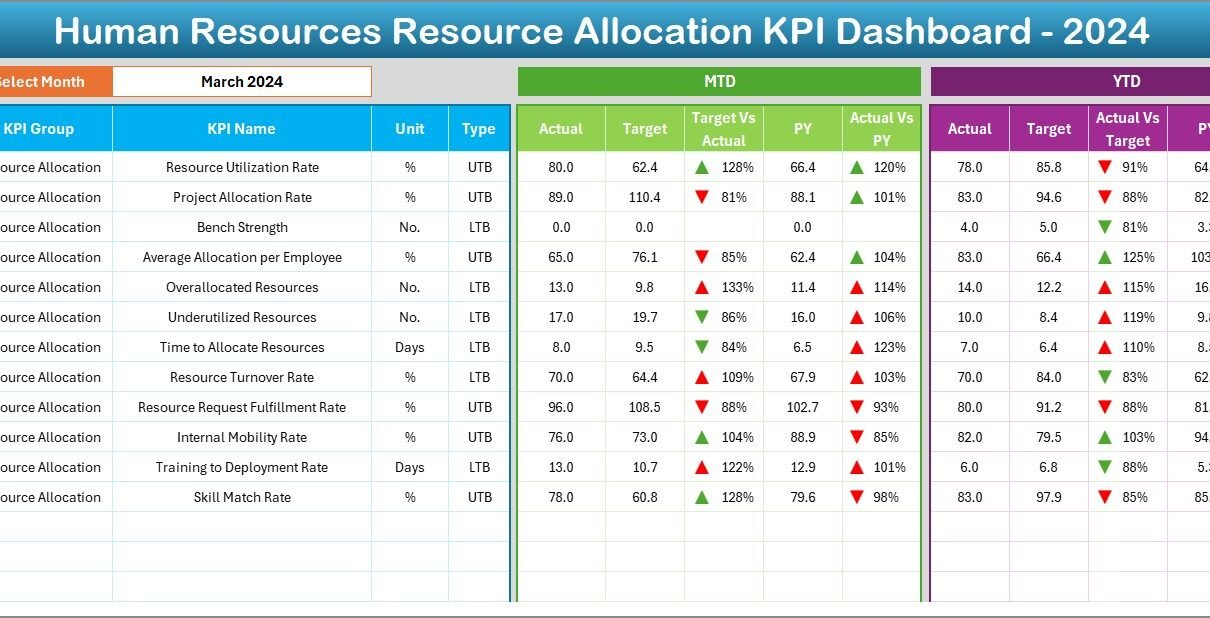
Dashboard Sheet 📊
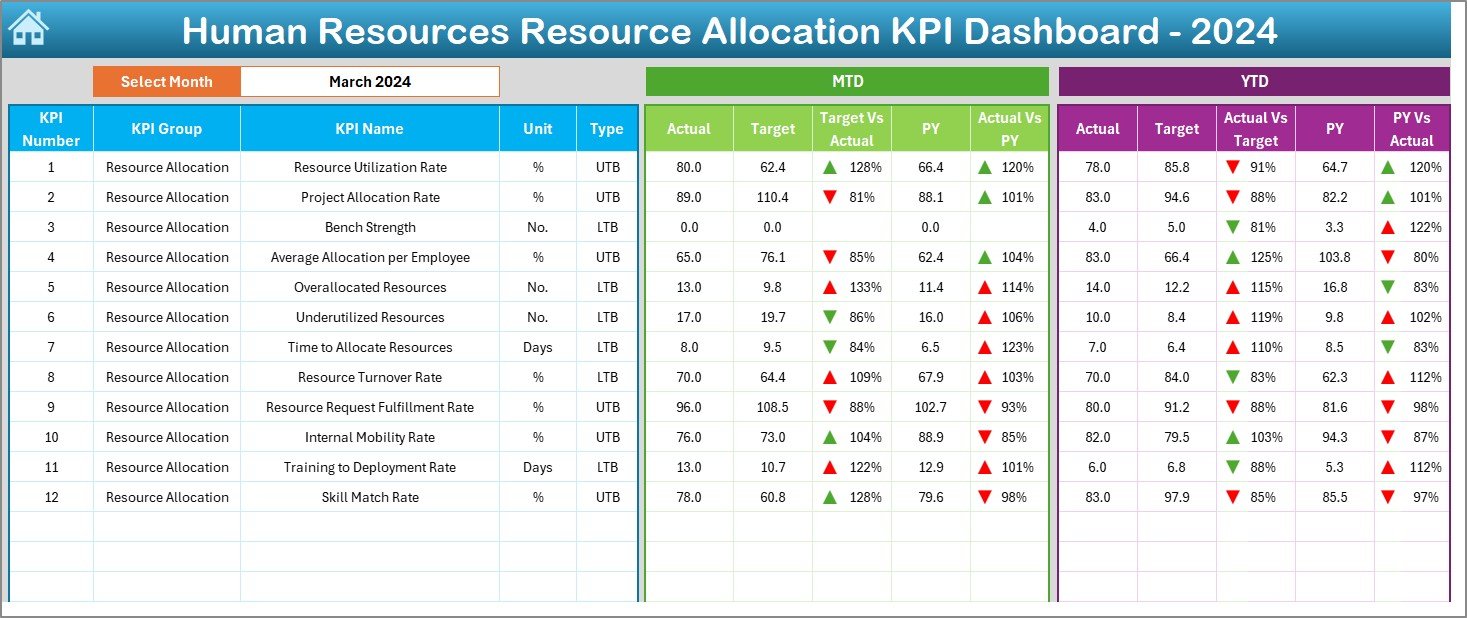
This is the main sheet where you will find a complete overview of your HR KPIs.
- Month Selector at Range D3: Select the month from the drop-down, and the dashboard updates automatically!
- MTD and YTD Comparison:
- MTD (Month-to-Date) Actual vs Target and Previous Year (PY) values
- YTD (Year-to-Date) Actual vs Target and PY values
- Conditional Formatting: Up and down arrows make it visually clear where performance is improving or declining.
KPI Trend Sheet 📈
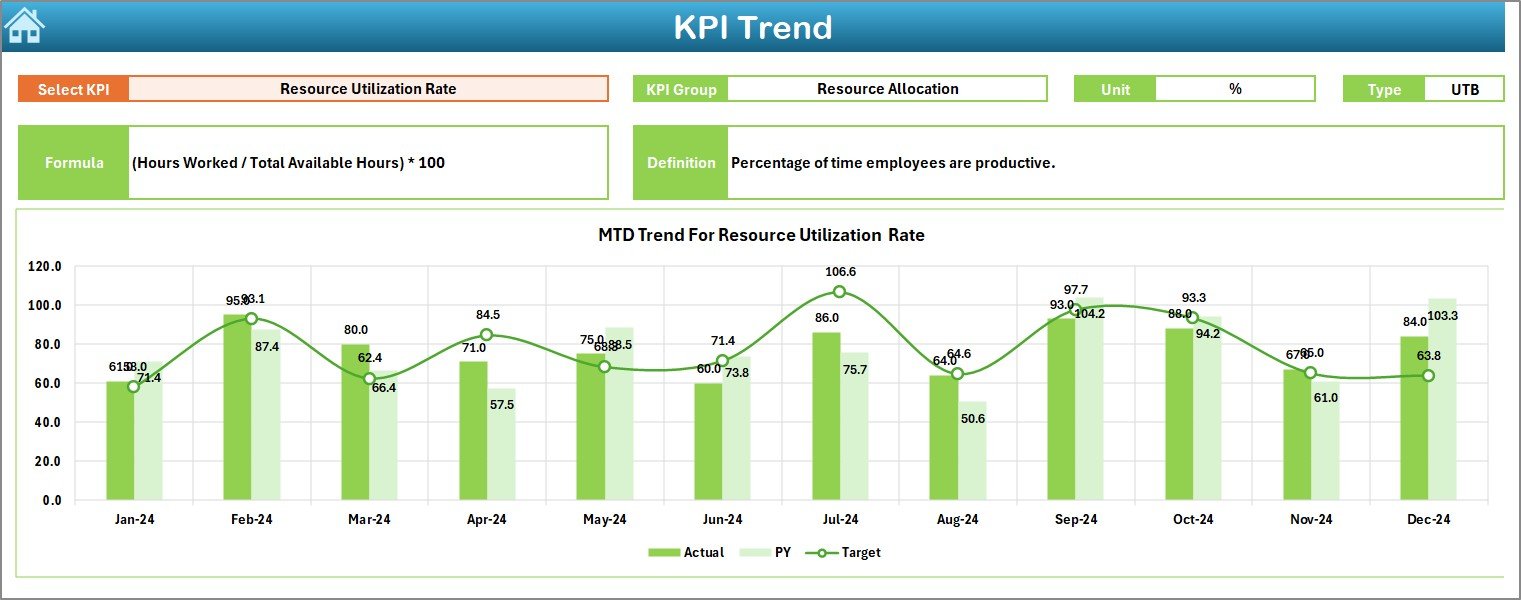
In this sheet:
- Dropdown Selector at C3 allows you to pick a KPI.
- View:
- KPI Group
- Unit
- Type (Lower the Better or Upper the Better)
- Formula
- Definition
- Trend Charts: See MTD and YTD performance trends for Actual, Target, and PY data.
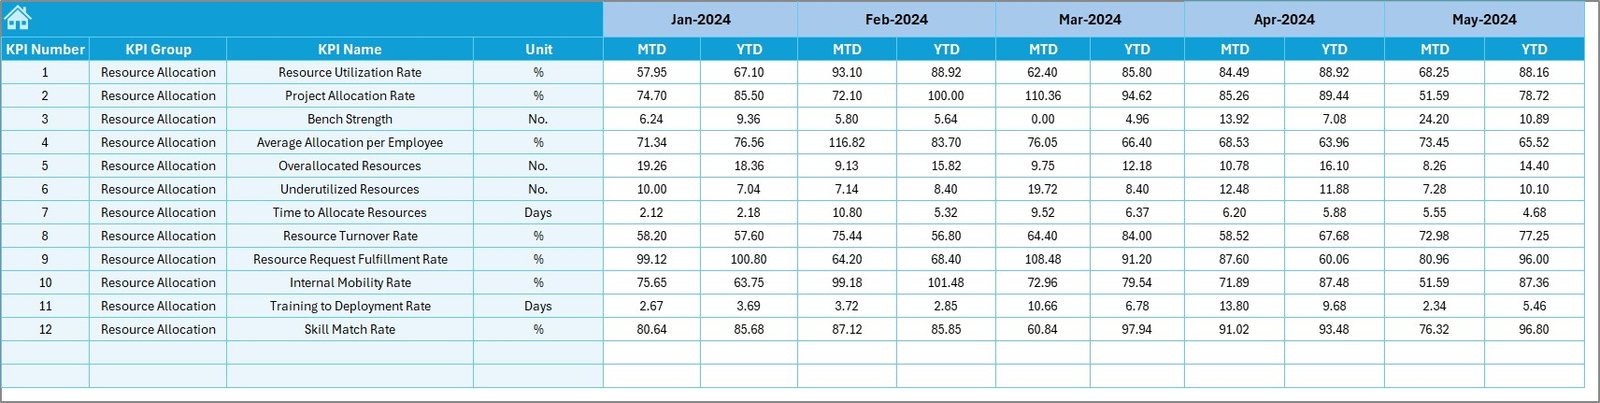
Actual Numbers Input Sheet 📝
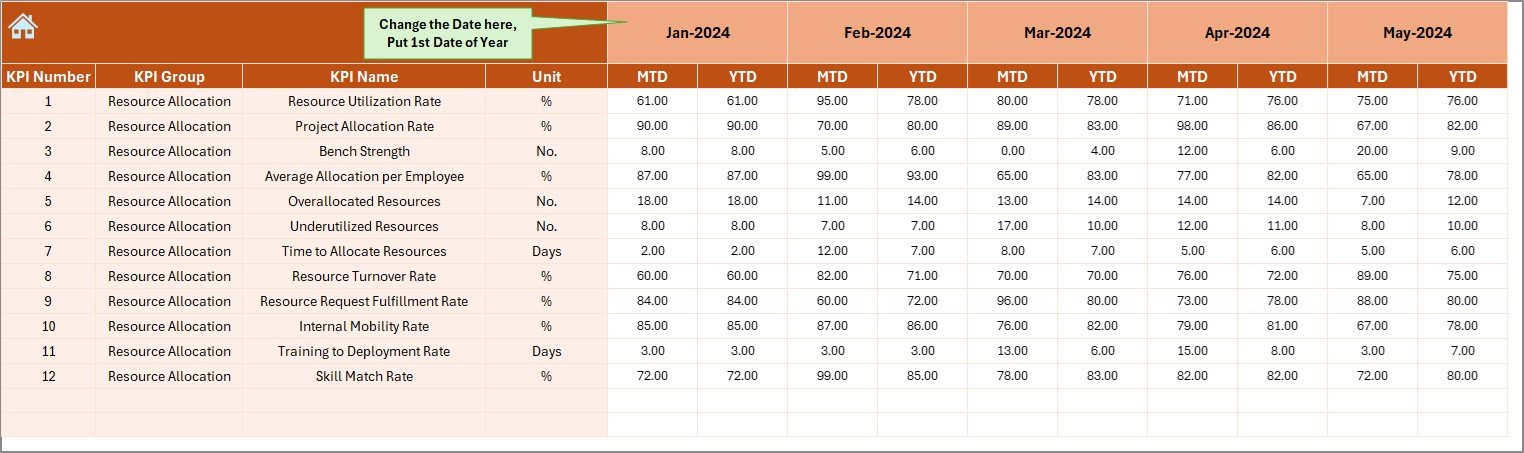
- Enter Actual Numbers for each KPI here.
- Month changes dynamically based on the date selected at Range E1.
- Helps you keep your data accurate and current.
Target Sheet 🎯
- Input your monthly and YTD targets here.
- Simple structure ensures targets are easy to set and track.
Previous Year Numbers Sheet 📅
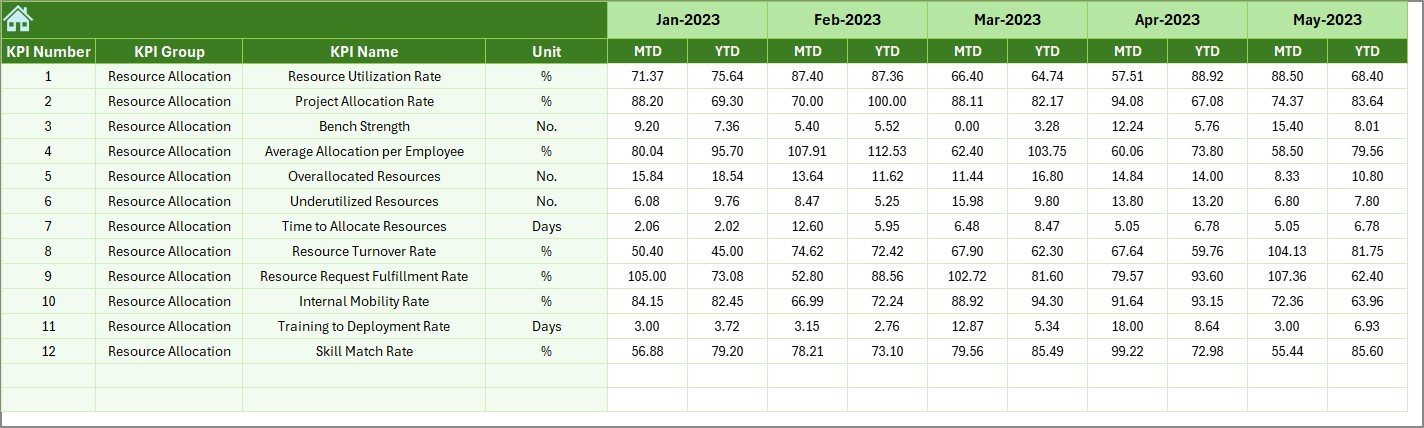
- Capture your Previous Year Data.
- Allows quick comparison with the current year’s performance.
Click to Purchases Human Resources Resource Allocation KPI Dashboard in Excel
KPI Definition Sheet 📚

- Store details such as KPI Name, KPI Group, Unit, Formula, and Definition.
- Keeps your dashboard organized and reference-ready.
Why Should You Use a Resource Allocation KPI Dashboard?
You might be wondering, why do I even need a dashboard like this? Well, let’s look at some compelling reasons:
- Better Workforce Planning: Allocate resources where they are needed most.
- Performance Insights: Quickly identify top-performing and under-performing departments.
- Data-Driven Decisions: Make smarter HR decisions backed by real numbers.
- Time Savings: Forget complicated spreadsheets — this dashboard handles everything visually!
Advantages of Human Resources Resource Allocation KPI Dashboard
Let’s break down the clear advantages of using this dashboard:
✅ Real-Time Tracking
Keep track of resource allocation at any time with up-to-date data.
✅ Quick Decision Making
Visual indicators like arrows for up and down movements enable faster reactions.
✅ Customizable and Scalable
Add more KPIs as your business grows without reworking the entire dashboard.
✅ Improved Transparency
Share the dashboard with teams or leadership for complete transparency.
✅ Historical Data Comparison
Compare current performance with previous years to spot long-term trends.
✅ User-Friendly Navigation
Jump between sheets easily using buttons, saving time and effort.
✅ One-Click Trend Analysis
Get an instant visual on how your KPIs are progressing month by month.
How Does the Dashboard Work?
Understanding how this dashboard functions can help you make the most of it. Here’s a simple walkthrough:
Select the Month
Choose your month from the drop-down in the Dashboard sheet.
Input Actual Data
Enter your monthly and YTD actuals in the Actual Numbers Input sheet.
Set Targets
Fill in your goals in the Target Sheet for MTD and YTD.
Input Previous Year Data
Enter last year’s data for a year-over-year comparison.
Monitor KPIs
Use the Dashboard and KPI Trend sheets to keep an eye on performance metrics.
That’s it! With just a few clicks every month, you stay on top of resource allocation like a pro.
Best Practices for the Human Resources Resource Allocation KPI Dashboard
While this dashboard makes HR management easier, following some best practices can take your efficiency to the next level:
🔹 Update Data Regularly
Ensure that actuals, targets, and previous year numbers are updated every month without fail.
🔹 Choose Meaningful KPIs
Only track KPIs that truly impact your workforce and projects.
🔹 Set Realistic Targets
Avoid unrealistic goals. They only cause frustration and demotivation.
🔹 Use Conditional Formatting Wisely
Make sure the color codes or arrows accurately represent performance to avoid confusion.
🔹 Share the Dashboard
Keep your HR and leadership teams informed by sharing the dashboard regularly.
🔹 Review Trends Monthly
Spend time analyzing the KPI trend sheet every month to spot emerging issues or opportunities early.
🔹 Keep Definitions Clear
In the KPI Definition sheet, write short, clear definitions so everyone understands what each KPI measures.
Common KPIs You Can Track with This Dashboard
Here’s a list of sample KPIs that you might want to track using this dashboard:
- Employee Utilization Rate
- Workforce Cost Efficiency
- Vacancy Rate
- Absenteeism Rate
- Overtime Hours
- Training Participation Rate
- Internal Mobility Rate
- Employee Turnover Rate
- Project Staffing Accuracy
- Time to Hire
- New Hire Retention Rate
- HR to Employee Ratio
You can customize and add more KPIs based on your specific needs!
How to Customize the Dashboard for Your Organization?
Customizing the dashboard is quite simple. Here’s how you can do it:
Add New KPIs
Insert them in the KPI Definition sheet and update the Actual, Target, and Previous Year sheets accordingly.
Change Conditional Formatting
Adjust the rules if you want to use different colors or symbols.
Modify Charts
Update the charts to display any new KPIs you add.
Adapt to Fiscal Year
Change the starting month if your fiscal year is different from the calendar year.
Personalize the Look
Update fonts, colors, and styles to match your company’s branding!
Conclusion
In today’s fast-moving business world, you cannot afford to mismanage your most valuable resource — your people. A Human Resources Resource Allocation KPI Dashboard in Excel helps you keep track, plan better, and make smart decisions backed by real data. 🌟
By implementing this dashboard, HR teams can achieve better workforce optimization, improve employee satisfaction, and contribute directly to organizational growth. If you want to take your HR management to the next level, adopting a tool like this is an absolute must.
Frequently Asked Questions (FAQs)
What is the main purpose of a Human Resources Resource Allocation KPI Dashboard?
The main purpose is to track and analyze HR resource utilization, ensuring that employees are efficiently allocated across various departments and projects.
Can I customize the dashboard for my organization’s specific needs?
Yes! The dashboard is fully customizable. You can add or remove KPIs, update targets, and even modify the visual layout.
Is this dashboard suitable for small businesses?
Absolutely! Whether you have 10 employees or 1000, this dashboard can help you manage your workforce effectively.
How often should I update the data?
You should update the data monthly to ensure accuracy and to monitor trends effectively.
Do I need advanced Excel skills to use this dashboard?
Not at all. Basic Excel knowledge is enough to input data and navigate between sheets.
Can I use this dashboard for project-specific resource allocation?
Yes! You can track resource allocation at the project level by setting up specific KPIs related to project staffing and efficiency.
Click to Purchases Human Resources Resource Allocation KPI Dashboard in Excel
Visit our YouTube channel to learn step-by-step video tutorials