In today’s dynamic world of international commerce, companies need more than spreadsheets and basic reports to stay competitive. Understanding trade performance, monitoring key indicators, and identifying growth opportunities requires real-time insights. That’s where the International Trade KPI Dashboard in Power BI becomes a game-changer.
This article will guide you through everything you need to know about this powerful dashboard—from its core features and benefits to best practices and implementation tips.
Click to Purchases International Trade KPI Dashboard in Power BI
What Is an International Trade KPI Dashboard in Power BI?
An International Trade KPI Dashboard in Power BI is an advanced reporting tool designed to visualize and track global trade metrics using dynamic, interactive visuals. It pulls data from an Excel-based dataset and transforms it into actionable insights across key performance indicators (KPIs) like export volume, import trends, trade balance, and compliance efficiency.
Built in Microsoft Power BI, this dashboard helps businesses:
-
Monitor real-time performance
-
Compare actuals with targets
-
Analyze historical trends
-
Make data-driven decisions at a glance
With just a few clicks, trade managers can evaluate whether their strategies are working—or need adjustments.
Key Features of the Dashboard
This dashboard comes with three core pages in the Power BI Desktop application:
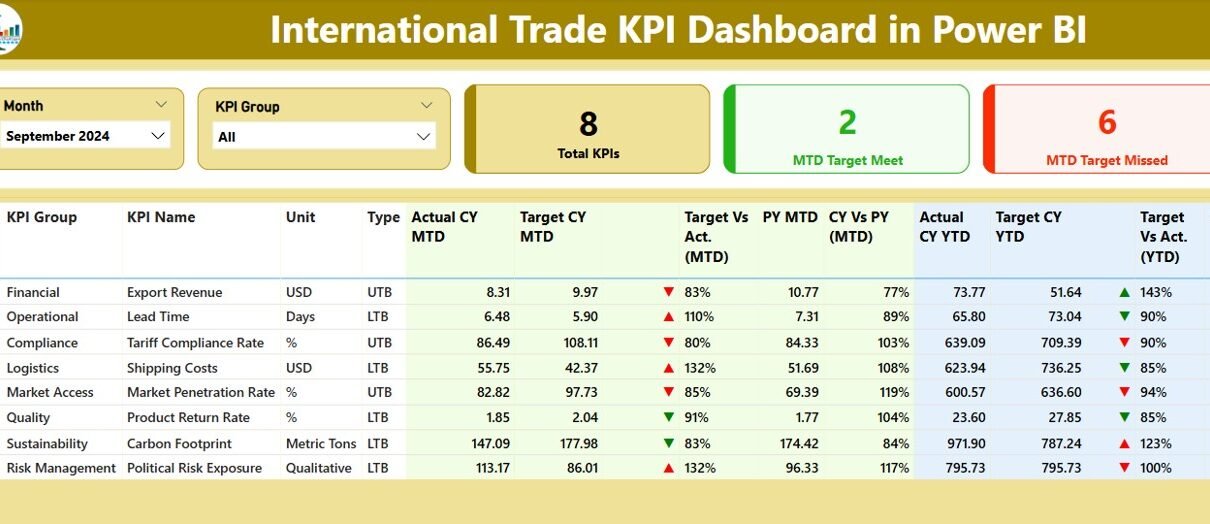
Summary Page – Your Snapshot of Trade Performance

This is the main view of the dashboard and includes:
-
🔄 Month and KPI Group slicers at the top to filter data quickly
📊 Cards showing:
- Total KPI Count
- MTD Target Met
- MTD Target Missed
Detailed Table displaying:
- KPI Number – Sequential number for tracking
- KPI Group – The trade category or department
- KPI Name – The specific performance metric
- Unit – Measurement unit (e.g., USD, Tons, %, etc.)
- Type – UTB (Upper the Better) or LTB (Lower the Better)
👉 MTD and YTD Metrics:
-
Actual CY MTD – Actual Month-to-Date value
-
Target CY MTD – Planned MTD goal
-
MTD Icon – Up (▲) or down (▼) arrow with green/red color based on status
-
Target vs Actual (MTD) – Formula:
(Actual / Target) -
PY MTD – Last year’s MTD value
-
CY vs PY (MTD) – Formula:
(Current MTD / Previous MTD)
📅 Year-to-Date Analysis:
-
Actual CY YTD
-
Target CY YTD
-
YTD Icon – Arrow indicators for trend
-
Target vs Actual (YTD) – Formula:
(Actual / Target) -
PY YTD – Last year’s YTD figure
-
CY vs PY (YTD) – Formula:
(Current YTD / Previous YTD)
KPI Trend Page – Discover Growth Patterns

This page features:
📉 Two combo charts:
- Actual vs Target vs Previous Year for MTD
- Actual vs Target vs Previous Year for YTD
-
🔍 KPI Name slicer on the left for targeted analysis
This view makes it easy to spot patterns and evaluate performance across different months.
KPI Definition Page – Drill Down Into Details

Though hidden, this drill-through page offers in-depth insights:
-
Click on any KPI from the Summary page and drill down
-
View Formula, KPI Definition, and Unit
-
Use the Back button on the top-left corner to return
Excel Data Integration: Keep Your Source Flexible
The dashboard uses Excel as the data source, making it easy to manage and update. You’ll find three input worksheets:
1. Input_Actual Sheet

Fill in:
-
KPI Name
-
Month (use the first date of the month)
-
MTD and YTD actual numbers
2. Input_Target Sheet

Provide:
-
Target MTD and YTD figures for each KPI
-
Use the same date format as the actuals
Click to Purchases International Trade KPI Dashboard in Power BI
3. KPI Definition Sheet

Define each KPI with:
-
KPI Number
-
Group
-
Name
-
Unit
-
Formula
-
Definition
-
Type (UTB or LTB)
This structure ensures clean, organized data for Power BI to ingest and visualize accurately.
Advantages of International Trade KPI Dashboard in Power BI
Let’s break down the major benefits:
✅ Real-Time Monitoring: Track MTD and YTD performance without manual updates.
✅ Visual Clarity: Use arrows, colors, and graphs to spot performance gaps.
✅ Dynamic Filtering: Slicers allow quick filtering by month or KPI group.
✅ Target vs Actual Tracking: Instantly see how close you are to meeting your goals.
✅ Historical Comparison: View current metrics against last year’s performance.
✅ User-Friendly Interface: Simple navigation with drill-through and back buttons.
✅ Excel-Driven Data: Easy to manage and update for any business user.
Why Power BI for International Trade?
Power BI offers unique advantages over traditional tools:
-
Cloud and desktop compatibility
-
Seamless integration with Excel
-
Advanced visualizations
-
High performance even with large datasets
-
Custom DAX formulas for powerful analytics
This makes it ideal for international trade professionals who need agility and precision.
How to Use the Dashboard Effectively?
Here’s how you can get started:
-
Update your Excel files monthly with new MTD/YTD values
-
Open the Power BI dashboard and click Refresh
-
Analyze key cards and visuals to spot performance issues
-
Drill-through for deeper investigation
-
Download/share reports with your team or stakeholders
📈 Best Practices for the International Trade KPI Dashboard
Follow these best practices for maximum impact:
🔄 Refresh Data Monthly: Stay current with up-to-date insights.
📊 Limit KPI Groups: Too many groups may clutter visuals.
🎯 Set Smart Targets: Targets should be realistic and measurable.
🧮 Use Consistent Units: Avoid mix-ups by standardizing units across all KPIs.
💾 Maintain Excel Files Carefully: Clean data ensures smooth dashboard updates.
👥 Train Stakeholders: Ensure users understand what UTB and LTB mean.
🎯 Align KPIs with Business Goals: Make sure your KPIs support your strategic objectives.
🚦 Use Visual Alerts Wisely: Color-coded arrows draw attention to critical issues.
💼 Who Should Use This Dashboard?
Click to Purchases International Trade KPI Dashboard in Power BI
This dashboard is ideal for:
-
International Trade Analysts
-
Supply Chain Managers
-
Import/Export Coordinators
-
Compliance Officers
-
C-Level Executives
-
Business Intelligence Teams
Whether you manage raw material imports or finished goods exports, this dashboard helps you stay aligned with performance goals.
🧭 Common KPIs to Track in International Trade
Here are some example KPIs you can include in your dashboard:
-
Export Volume (MTD/YTD)
-
Import Cost (USD)
-
Custom Clearance Time
-
Delivery Lead Time
-
Trade Compliance Rate
-
Currency Exchange Impact
-
Number of Trade Violations
-
Freight Cost per Unit
-
Port Dwell Time
-
Order Fulfillment Ratio
These KPIs help evaluate trade efficiency, cost management, and regulatory compliance.
Conclusion
The International Trade KPI Dashboard in Power BI isn’t just another reporting tool—it’s your command center for smarter, faster, and more accurate decisions. By connecting structured Excel data to interactive visuals, businesses can uncover patterns, track progress, and optimize performance in global trade operations.
Whether you’re scaling exports, managing import costs, or tracking compliance, this dashboard ensures your entire team stays informed and aligned.
❓ Frequently Asked Questions (FAQs)
Q1. Can I use this dashboard without Power BI Pro?
Answer: Yes, you can use it in Power BI Desktop for free. However, to share it on the cloud or collaborate, a Power BI Pro license is required.
Q2. How often should I update the Excel data?
Answer: Ideally, update it monthly to keep MTD and YTD insights accurate.
Q3. Can I customize the KPIs?
Answer: Absolutely. You can modify or add new KPIs by updating the Excel file and refreshing Power BI.
Q4. What if I don’t have last year’s data?
Answer: You can leave PY MTD and PY YTD columns blank, but you won’t get comparison insights until you populate them.
Q5. Is this dashboard suitable for non-technical users?
Answer: Yes. It’s designed to be user-friendly with intuitive navigation, slicers, and clear visual indicators.
Q6. Can I add filters by region or product?
Answer: Definitely. You can enhance the dashboard by adding filters like region, product type, or department in Power BI.
Visit our YouTube channel to learn step-by-step video tutorials

