Office renovations are an essential part of maintaining a productive and comfortable work environment. However, managing the various aspects of a renovation project can be a complex and time-consuming task. With multiple stakeholders, budgets, and timelines to monitor, it can quickly become overwhelming. Thankfully, Power BI offers a powerful solution in the form of an Office Renovation Project Dashboard, enabling project managers to stay on top of every detail.
In this article, we will explore the Office Renovation Project Dashboard in Power BI, which is designed to provide clear insights into every aspect of the renovation process. From tracking costs to monitoring progress and evaluating contractor performance, this dashboard integrates all essential data into one easy-to-use interface.
Click to Purchases Office Renovation Project Dashboard in Power BI
What is the Office Renovation Project Dashboard in Power BI?
The Office Renovation Project Dashboard in Power BI is a ready-to-use solution for managing office renovation projects. It consolidates all critical project data into a visual format, allowing project managers to track budgets, progress, contractors, locations, and monthly trends. By capturing the data in an Excel file and integrating it with Power BI, this dashboard provides real-time, actionable insights for better decision-making.
Key Features of the Office Renovation Project Dashboard
The dashboard is structured into five main pages, each serving a specific purpose in managing the renovation project:
-
Overview Page
-
Department Summary
-
Contractor Performance
-
Location Analysis
-
Monthly Trends
Let’s dive deeper into each page to understand how they contribute to the overall project management process.
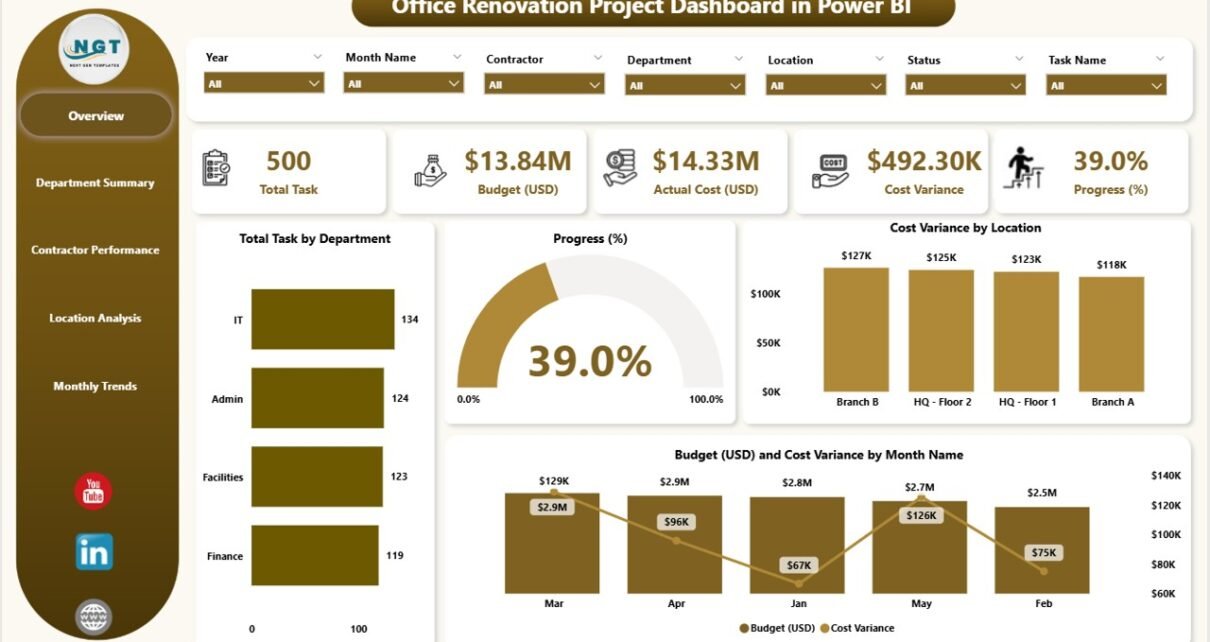
Overview Page
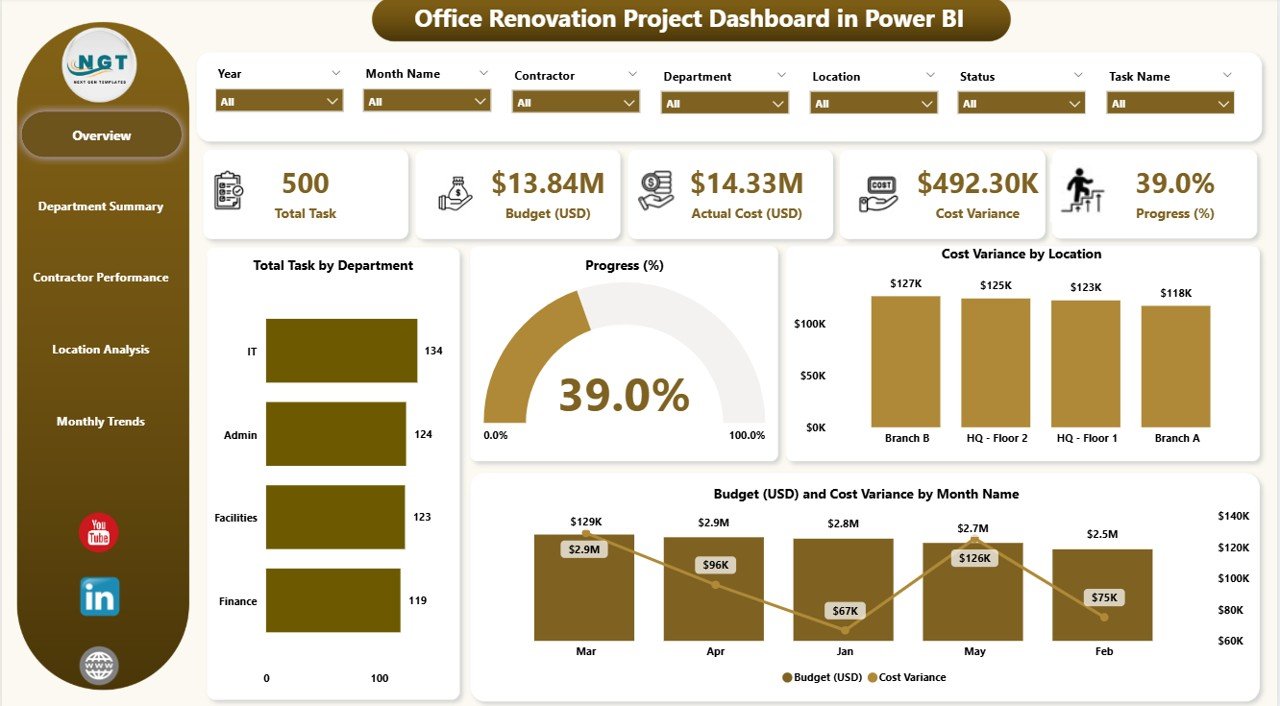
The Overview Page is the main dashboard that provides a high-level view of the entire renovation project. It allows project managers to get a snapshot of key metrics at a glance. This page features:
-
7 Slicers: These slicers enable users to filter the data based on different criteria such as departments, contractors, locations, and more.
5 Cards: The cards display crucial KPIs, including:
- Total Tasks by Department: This card shows the number of tasks assigned to each department.
- Progress (%): This card indicates the overall progress of the project, as a percentage of completion.
- Cost Variance by Location: This shows the budget vs. actual cost variance for each location.
- Budget (USD): Displays the allocated budget for the renovation project.
- Cost Variance by Month Name: This card tracks the cost variance for each month throughout the renovation.
By having all of these metrics displayed in one place, project managers can easily track the project’s performance in real time.
Department Summary
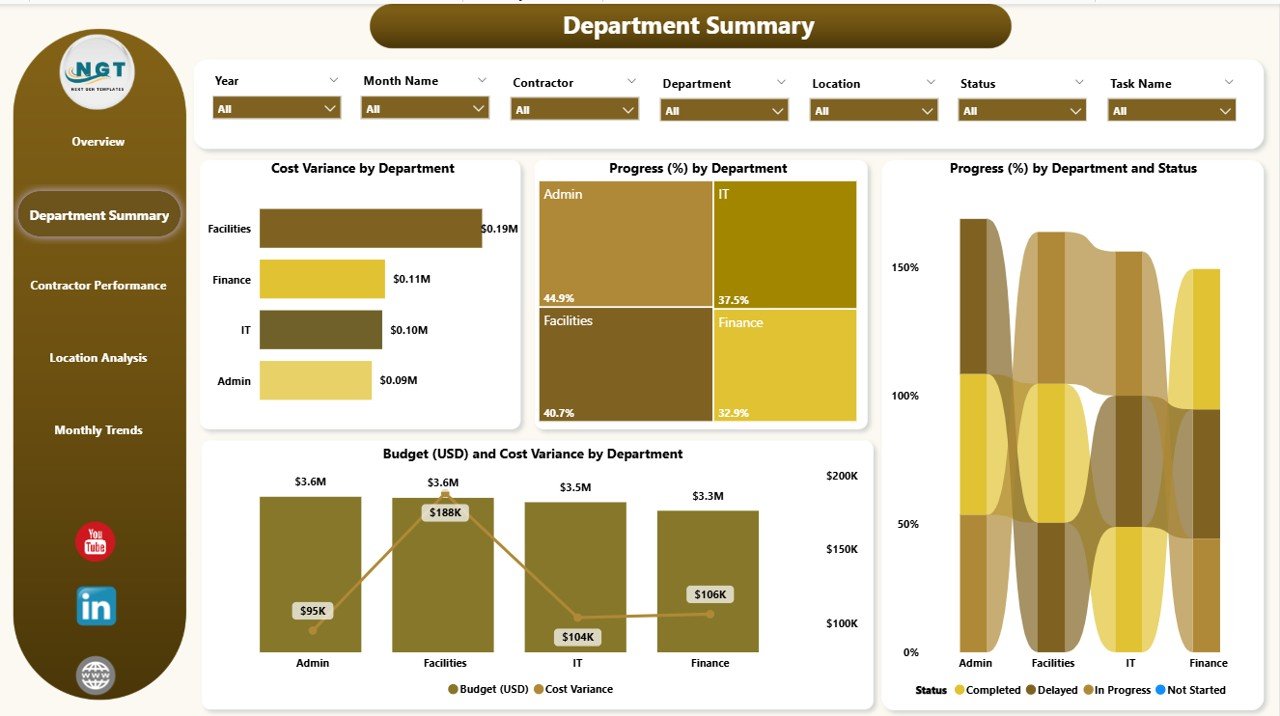
The Department Summary page focuses on tracking the performance of each department involved in the renovation project. This page features:
-
7 Slicers: These slicers help filter the data by department, task type, or other relevant categories.
4 Charts: The charts offer detailed insights into department-specific performance:
- Cost Variance by Department: This chart compares the estimated cost against the actual cost for each department.
- Progress (%) by Department: Shows the percentage of tasks completed within each department.
- Progress (%) by Department and Status: Displays the progress and status of each department’s tasks (e.g., completed, in progress, pending).
- Budget (USD) and Cost Variance by Department: Tracks the budget and cost variance for each department.
This page is crucial for understanding how different departments are contributing to the project and where any discrepancies may lie.
Contractor Performance
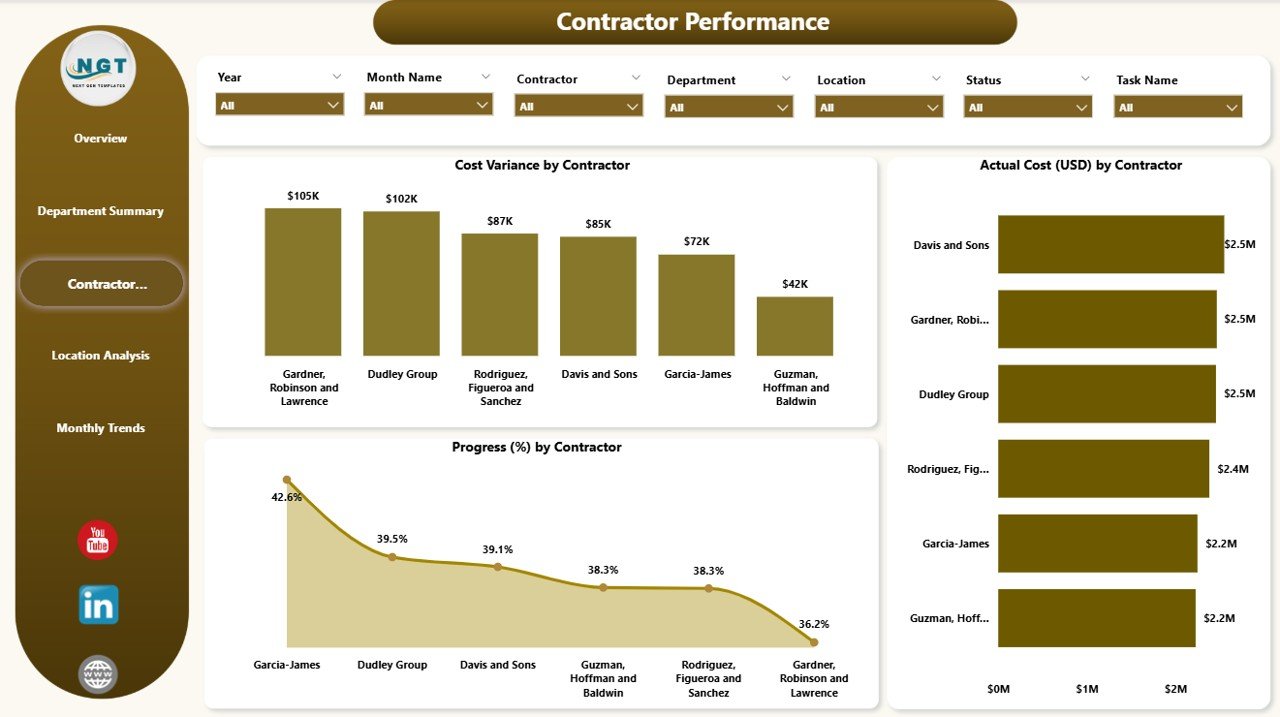
The Contractor Performance page evaluates how well each contractor is performing throughout the renovation. This page features:
-
7 Slicers: These slicers filter data based on contractor performance, location, or department.
3 Charts: These charts offer insights into contractor-specific metrics:
- Cost Variance by Contractor: Displays the cost variance (budget vs. actual) for each contractor.
- Actual Cost (USD) by Contractor: Shows the actual cost incurred by each contractor.
- Progress (%) by Contractor: Tracks the progress made by each contractor as a percentage of total tasks.
This page is vital for identifying contractors who may be over budget or behind schedule, allowing project managers to take corrective action as needed.
Location Analysis
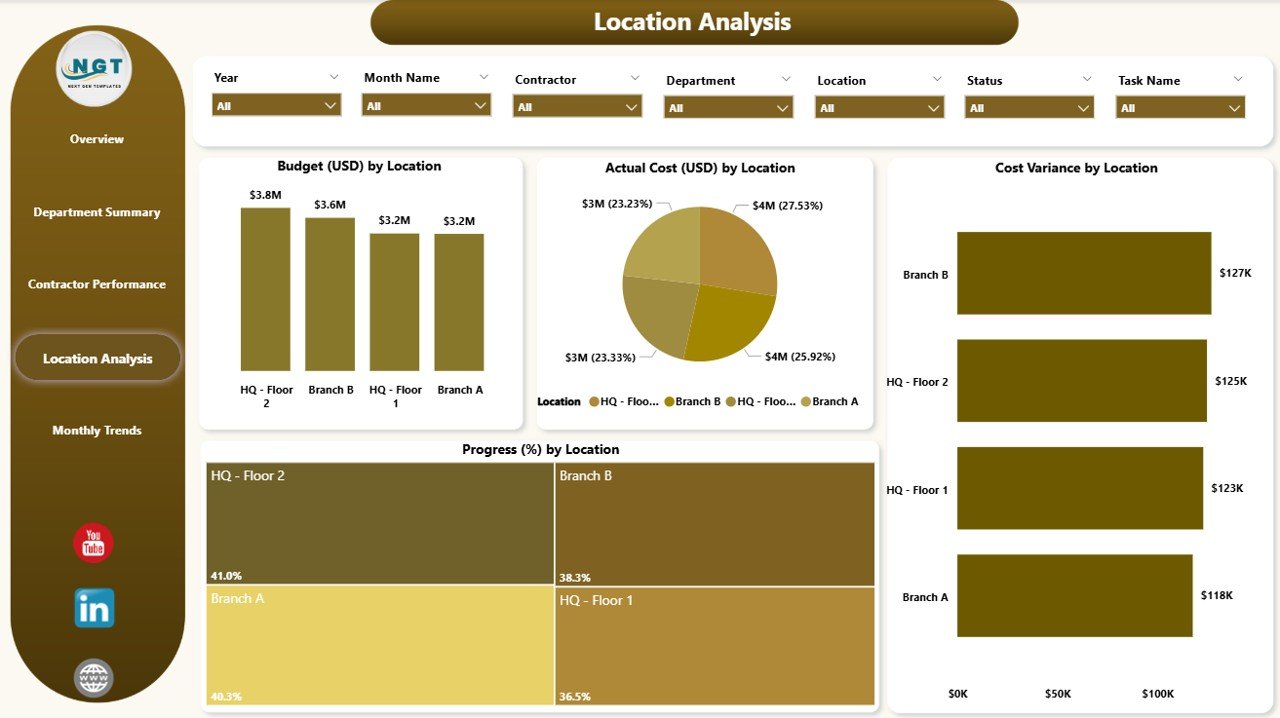
The Location Analysis page allows project managers to track the renovation progress by location. This page is particularly useful for larger office spaces that may involve multiple locations or departments. Key features include:
-
7 Slicers: These slicers enable filtering by location, contractor, and other categories.
4 Charts: The charts provide insights into location-based data:
- Budget (USD) by Location: Displays the allocated budget for each location.
- Actual Cost (USD) by Location: Shows the actual cost incurred for each location.
- Cost Variance by Location: Tracks the budget vs. actual cost variance by location.
- Progress (%) by Location: Monitors the completion progress of each location.
This page helps ensure that all locations are on track and that any cost overruns or delays are immediately visible.
Monthly Trends
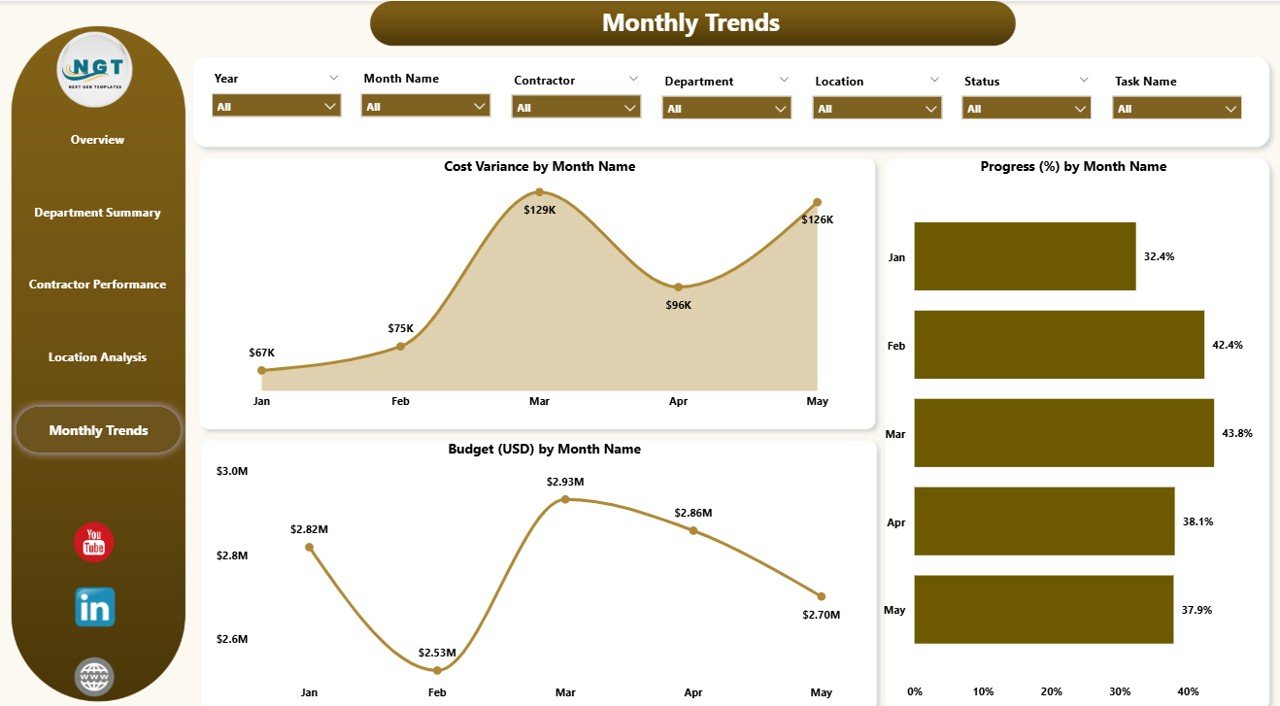
The Monthly Trends page tracks the performance of the renovation project over time. It highlights trends in cost and progress, helping project managers predict future outcomes. This page features:
-
7 Slicers: Filters data by month, location, or other categories.
2 Charts: These charts track the following trends:
- Cost Variance by Month Name: Shows how the costs have fluctuated each month, comparing actual costs to the planned budget.
- Progress (%) by Month Name: Monitors how much progress has been made each month, displayed as a percentage of completion.
By analyzing monthly trends, project managers can adjust strategies to keep the renovation on track.
Advantages of the Office Renovation Project Dashboard in Power BI
Using a Power BI dashboard for office renovation projects offers several advantages:
-
Centralized Data: All project data is stored and displayed in one central location, making it easy to track progress, budgets, and contractor performance.
-
Real-Time Updates: With the dashboard pulling data from Excel, it provides real-time insights into the project’s status, enabling quick decision-making.
-
Visual Insights: The use of charts, slicers, and cards makes it easy to visualize complex data, allowing project managers to understand trends and outliers at a glance.
-
Improved Decision-Making: By having all critical data at your fingertips, the dashboard empowers project managers to make informed decisions that keep the project on budget and on schedule.
-
Enhanced Collaboration: The dashboard can be shared with different stakeholders, ensuring that everyone involved in the project has access to the same data.
Best Practices for Using the Office Renovation Project Dashboard
To get the most out of the Office Renovation Project Dashboard, consider following these best practices:
-
Regularly Update Data: Ensure that the data in the Excel file is updated regularly so that the dashboard reflects the most current information.
-
Use Slicers Effectively: Slicers allow for granular analysis, so make use of them to filter the data by department, location, or contractor for more targeted insights.
-
Monitor Key Metrics: Keep a close eye on metrics like cost variance, progress, and budget allocation to catch potential issues early.
-
Share the Dashboard with Stakeholders: Make sure all relevant stakeholders have access to the dashboard to foster transparency and collaboration.
-
Analyze Monthly Trends: Regularly review the Monthly Trends page to identify any patterns or areas where the project is lagging behind schedule.
Conclusion
The Office Renovation Project Dashboard in Power BI is an invaluable tool for project managers overseeing office renovations. With its comprehensive features and user-friendly interface, this dashboard allows you to track every aspect of the project—from costs and progress to contractor performance and location-specific analysis. By using this dashboard, you can make better decisions, avoid cost overruns, and ensure the renovation project stays on track.
Frequently Asked Questions (FAQs)
1. How does the Office Renovation Project Dashboard in Power BI help track costs?
The dashboard tracks costs by department, contractor, location, and monthly trends. It displays cost variance between the budgeted and actual costs, helping project managers spot any discrepancies.
2. Can the Office Renovation Project Dashboard be customized?
Yes, the dashboard is customizable. You can modify slicers, charts, and other elements to suit your specific project needs.
3. How often should the data be updated in the dashboard?
It’s recommended to update the data regularly, ideally on a weekly or bi-weekly basis, to ensure the dashboard reflects real-time project performance.
4. What makes this dashboard better than other project management tools?
Unlike other tools, the Power BI dashboard integrates with Excel and provides visual, real-time insights. It consolidates all project data into one place, making it easy to analyze and manage.
5. Is the Office Renovation Project Dashboard easy to use?
Yes, the dashboard is designed to be user-friendly. With its intuitive interface, even those without technical experience can navigate and use it effectively.
Visit our YouTube channel to learn step-by-step video tutorials