Managing compliance in project environments has become more important than ever. Whether you’re leading a large organization or running a small project team, keeping track of compliance metrics helps reduce risks and improve project outcomes. But how can you do this efficiently? The answer lies in a Project Management Compliance KPI Dashboard in Excel.
In this comprehensive guide, we’ll walk through everything you need to know about building, using, and benefiting from a Project Management Compliance KPI Dashboard. Not only will we explore its features, but we’ll also share best practices, advantages, and frequently asked questions.
Click to Purchases Project Management Compliance KPI Dashboard in Excel
What Is a Project Management Compliance KPI Dashboard?
A Project Management Compliance KPI Dashboard is a powerful Excel-based tool that helps project managers track key compliance indicators throughout the project lifecycle. These indicators, or KPIs, measure how well the project aligns with regulatory standards, internal guidelines, and external policies.
It gives you a clear, visual, and data-driven way to evaluate compliance performance, flag risks, and make better decisions.
Key Components of the Compliance KPI Dashboard
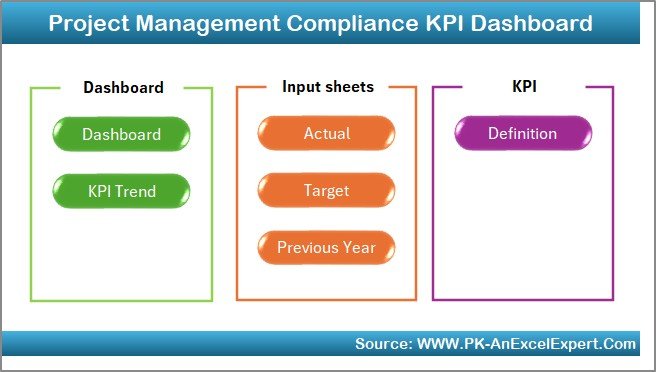
This Excel dashboard has 7 interactive and interlinked worksheet tabs, each serving a unique purpose.
Home Sheet
The Home sheet serves as the control center. It contains 6 easy-to-use buttons that act as quick navigation tools to jump directly to different sections of the dashboard.
Dashboard Sheet Tab
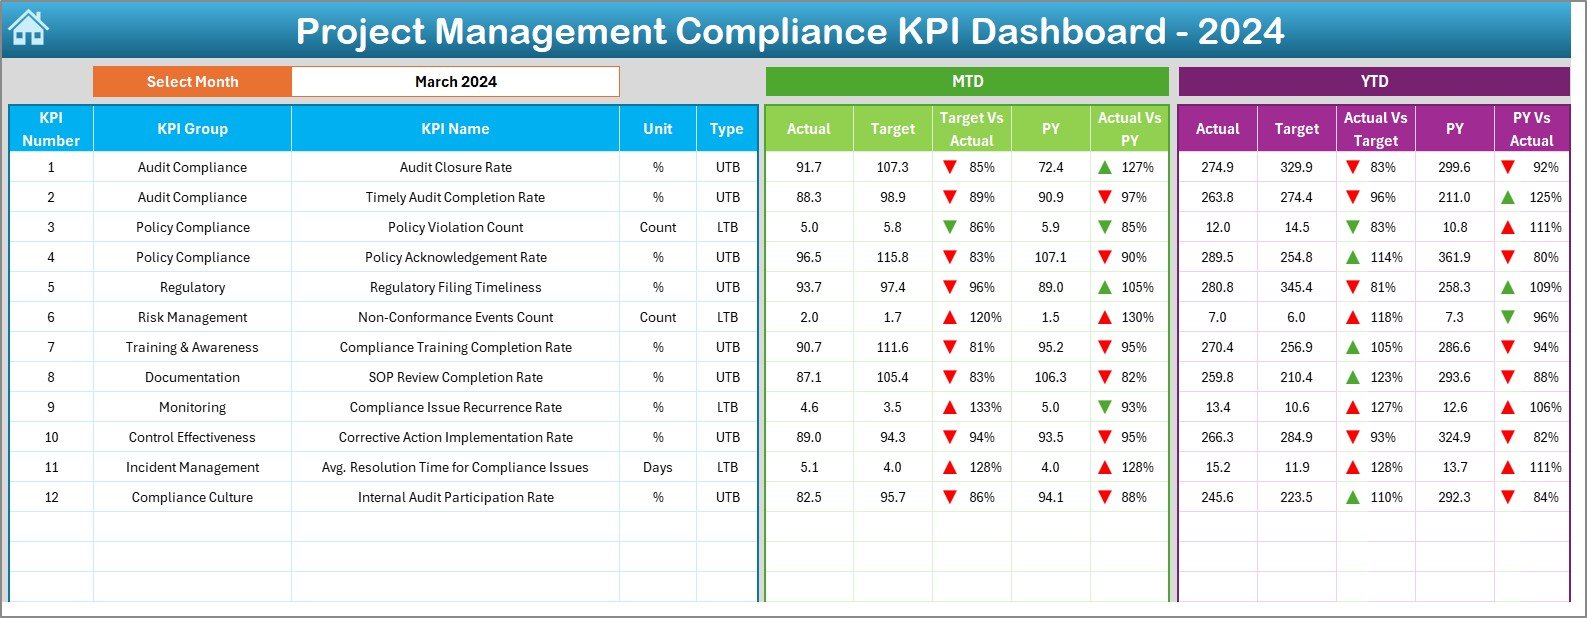
This is the main sheet where the magic happens.
-
Select any month using the dropdown in cell D3
-
View the entire dashboard update based on the selected month
Monitor:
- MTD (Month to Date): Actual, Target, Previous Year
- YTD (Year to Date): Actual, Target, Previous Year
-
Compare Target vs Actual and Previous Year vs Actual
-
Visual indicators like up and down arrows highlight KPI status using conditional formatting
KPI Trend Sheet Tab
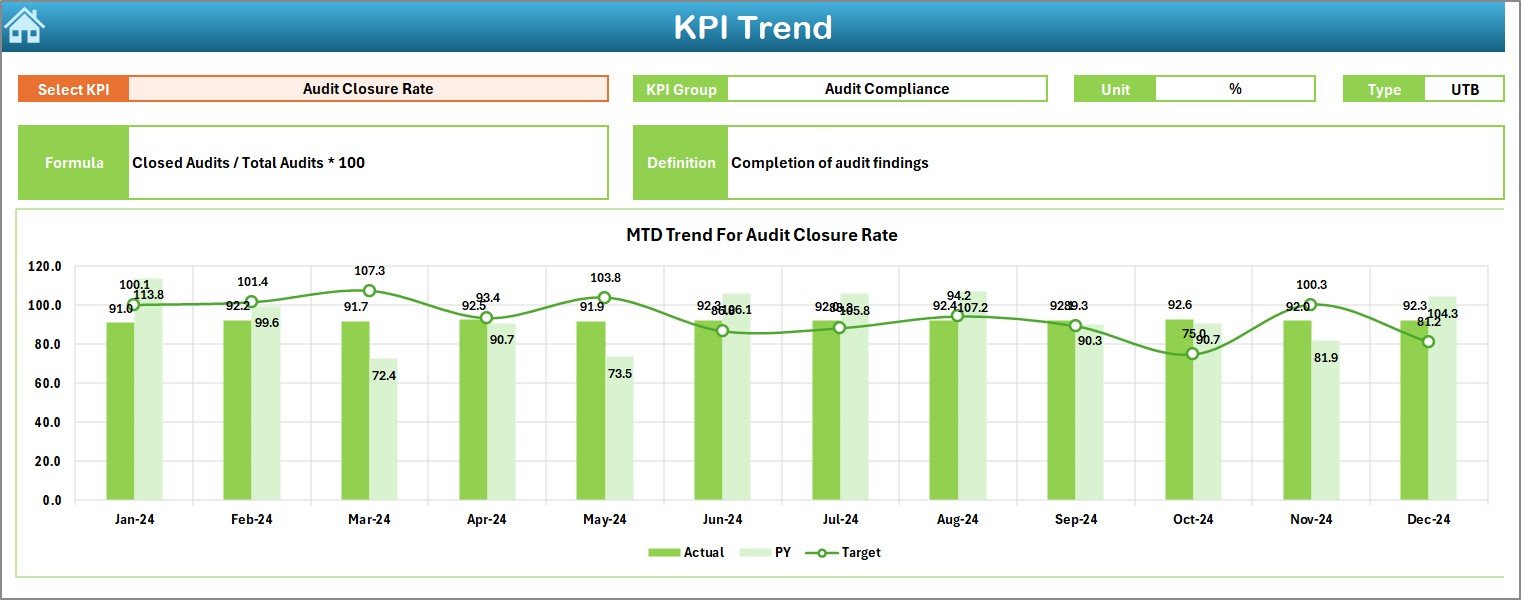
This tab offers deep insights into the trend of each KPI over time.
-
Select the KPI using the dropdown in cell C3
See details like:
- KPI Group
- Unit
- KPI Type (UTB or LTB)
- Formula
- Definition
-
Visual charts display MTD and YTD trend lines for Actual, Target, and Previous Year values
Actual Numbers Input Sheet
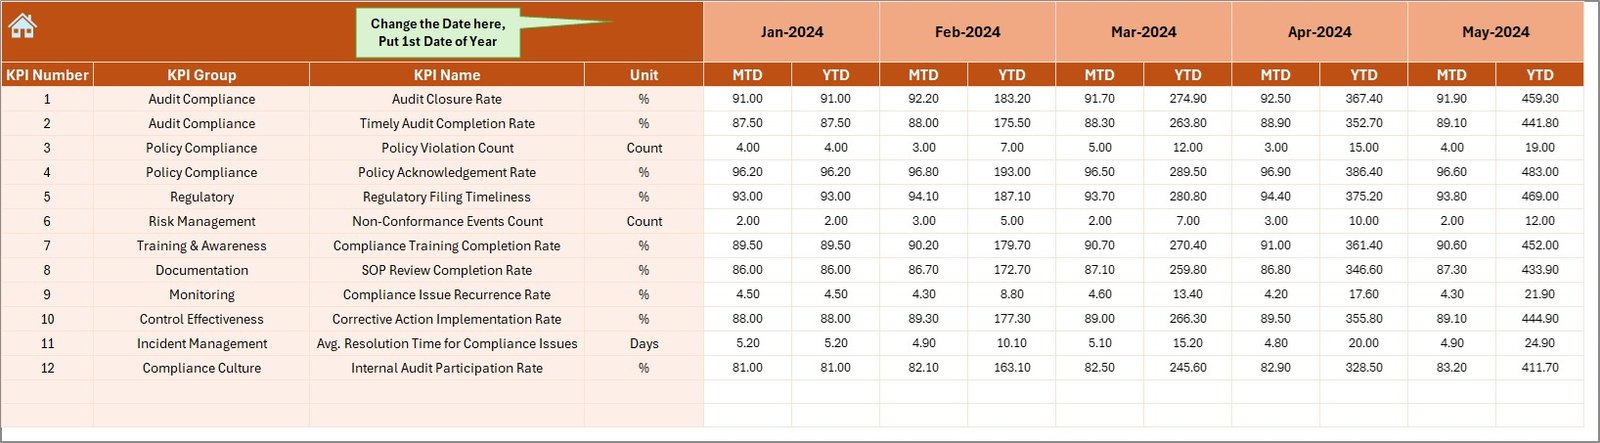
This sheet is where you’ll enter monthly actual values for each KPI.
-
Use cell E1 to set the starting month
-
Enter MTD and YTD figures with ease
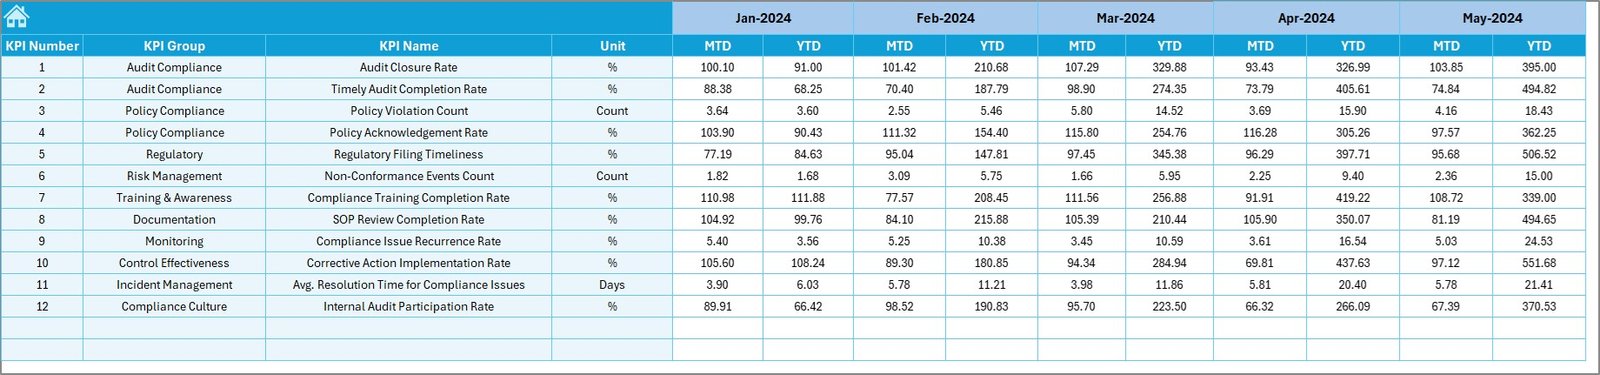
Target Sheet Tab
This is where you set your compliance goals.
-
Input both MTD and YTD Target values for each KPI
-
Adjust targets as required for the reporting period
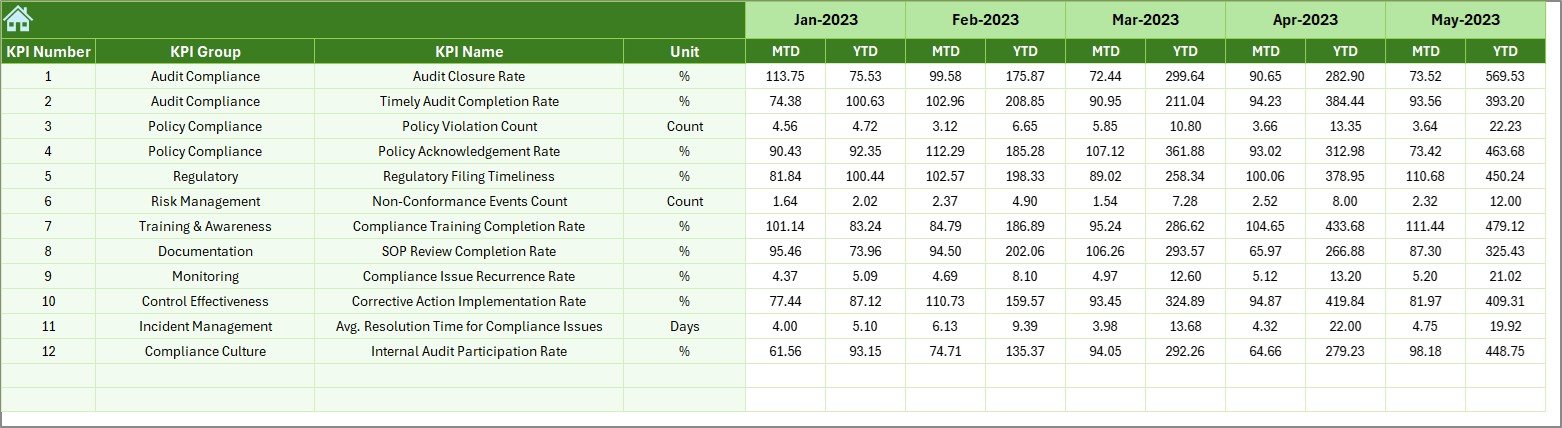
Previous Year Number Sheet
Benchmark performance by entering last year’s data for each KPI, similar to how you enter the current year’s actual numbers.
Click to Purchases Project Management Compliance KPI Dashboard in Excel
KPI Definition Sheet Tab
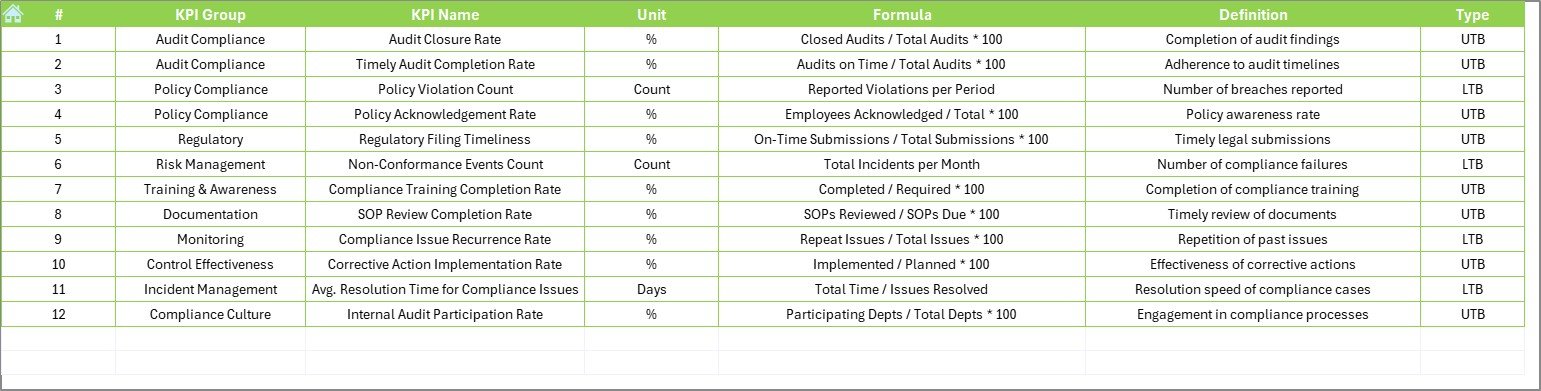
This is your KPI reference dictionary.
-
Define each KPI clearly
-
Specify KPI Group, Unit, Formula, and whether it’s a UTB (Upper The Better) or LTB (Lower The Better)
Advantages of Using a Compliance KPI Dashboard in Excel
Let’s explore how this dashboard can help your project team stay compliant and productive.
✔️ Saves Time and Effort
No need to build reports from scratch or switch between tools. Everything is consolidated in one file.
✔️ Tracks Real-Time Performance
With MTD and YTD views, you’ll always know how your compliance indicators are trending.
✔️ Reduces Compliance Risks
Instant alerts via color-coded arrows highlight when performance drops below expected targets.
✔️ Supports Informed Decisions
Easy access to KPI definitions, formulas, and trends helps leaders take smarter actions.
✔️ Boosts Accountability
Team members can view how their actions affect compliance, encouraging responsibility and follow-through.
Most Common Compliance KPIs to Track
Not sure what KPIs to include? Here are some common and valuable ones for project compliance:
-
Audit Completion Rate
-
Regulatory Breach Incidents
-
Policy Training Completion Rate
-
Document Review Timeliness
-
Incident Reporting Lag
-
Compliance Task Closure Time
-
Risk Assessment Coverage
-
Contract Review Compliance
Best Practices for the Project Management Compliance KPI Dashboard
To make the most of your Excel dashboard, follow these best practices:
1. Keep KPI Definitions Clear and Simple
Every KPI should be understandable without extra explanation. Include definitions directly in the KPI Definition Sheet.
2. Align KPIs with Business Goals
Choose only those compliance KPIs that directly impact your project outcomes and organizational risk profile.
3. Update Data Consistently
Ensure actuals, targets, and previous year data are entered monthly. This keeps trends accurate.
4. Use Conditional Formatting Wisely
Color-coded visuals (like green for on-target, red for below target) make it easy to interpret results quickly.
5. Review Trends Regularly
Don’t just look at the current month. Use the KPI Trend tab to identify ongoing issues or areas of improvement.
6. Secure Your File
Add password protection or lock formula cells to prevent unauthorized edits.
Why Excel for Compliance Dashboards?
Some may wonder why Excel is still a great choice. Here’s why:
✅ Familiar and User-Friendly
Most teams already know how to use Excel—there’s no steep learning curve.
✅ Fully Customizable
You can easily add, remove, or modify KPIs, charts, and layouts.
✅ Offline Access
No need for internet connectivity or software licenses. Just open the file and work.
✅ Cost-Effective
There’s no need for expensive BI tools or compliance tracking software.
Real-World Application Scenarios
Let’s look at how different teams can use this dashboard:
🏢 Corporate Compliance Team
Track adherence to internal policies, training completion, and regulatory audit scores.
🛠 Project Management Office (PMO)
Monitor project-level risks, document reviews, and stakeholder approvals.
💻 IT Project Teams
Ensure data privacy laws, cybersecurity protocols, and compliance checks are up to date.
🏥 Healthcare Projects
Stay aligned with health safety standards, inspections, and medical compliance KPIs.
Monthly Workflow Example
Here’s how to use the dashboard in a typical monthly routine:
-
Start of Month: Update the actual values in the “Actual Numbers Input” tab.
-
Mid-Month: Compare progress against targets using the “Dashboard” sheet.
-
End of Month: Review trends and update previous year numbers if necessary.
-
Quarterly: Adjust targets based on current business goals.
-
Annually: Refresh definitions or KPIs if project scope changes.
Customizing the Dashboard for Your Project
Want to tailor it for your project or industry? Here are quick suggestions:
-
Change KPI Names and Units based on your compliance focus.
-
Add slicers to filter data by team, project, or location.
-
Insert pivot tables to analyze results further.
-
Automate some entries using simple VBA macros.
Conclusion
A Project Management Compliance KPI Dashboard in Excel is not just a spreadsheet—it’s a complete tracking and reporting system that empowers your team to stay compliant, reduce risk, and perform better. From intuitive navigation to dynamic visuals and detailed KPI insights, this dashboard offers everything a project manager needs to stay on top of compliance.
Whether you’re overseeing a large enterprise project or managing a single team, this Excel dashboard can make a big difference in how you approach compliance and performance measurement.
❓ Frequently Asked Questions (FAQs)
Q1. What are compliance KPIs in project management?
Compliance KPIs are metrics used to measure how well a project or organization follows rules, regulations, and internal policies.
Q2. Why should I use Excel for KPI dashboards?
Excel is easy to use, cost-effective, and fully customizable. You don’t need special software to track, analyze, and report performance.
Q3. Can I add more KPIs to this dashboard?
Yes! The dashboard is fully flexible. You can insert new rows in the input and target sheets and define additional KPIs in the definition tab.
Q4. How often should I update the KPI data?
It’s best to update monthly for MTD and YTD data. You can also do quarterly reviews for more strategic insights.
Q5. What does LTB and UTB mean?
LTB stands for Lower the Better and UTB stands for Upper the Better. These terms help you understand whether higher or lower values are better for a particular KPI.
Visit our YouTube channel to learn step-by-step video tutorials