In today’s rapidly evolving business environment, effective project management training and development play a crucial role. However, tracking and measuring the success of these training programs can often become overwhelming. Thankfully, with the Project Management Training and Development KPI Dashboard in Excel, managing, monitoring, and enhancing your team’s performance becomes significantly easier.
This comprehensive article covers everything you need to know about this KPI dashboard, its advantages, best practices, and useful tips to ensure your training initiatives lead to real improvements.
Click to Purchases Project Management Training and Development KPI Dashboard in Excel
What is a Project Management Training and Development KPI Dashboard?
A Project Management Training and Development KPI Dashboard is an Excel-based tool designed to measure, track, and visualize Key Performance Indicators (KPIs) related to employee training and skill development. It provides instant insights into training effectiveness, participation rates, skill improvements, and overall training impact on project outcomes.
Key Features of the Project Management Training and Development KPI Dashboard
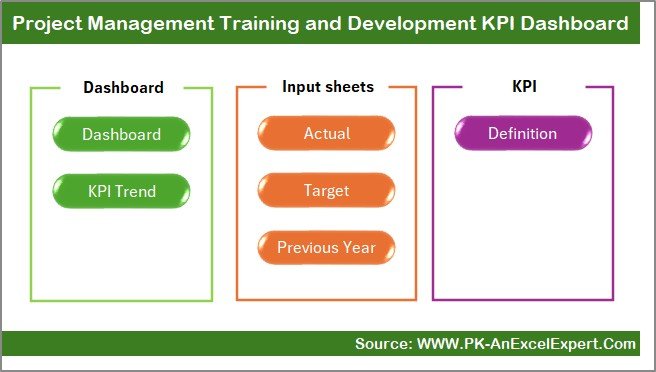
The dashboard contains seven strategically designed worksheets:
Home Sheet
The Home Sheet acts as an intuitive index page, enabling seamless navigation through six interactive buttons that jump directly to the respective worksheet. This enhances user experience and efficiency.
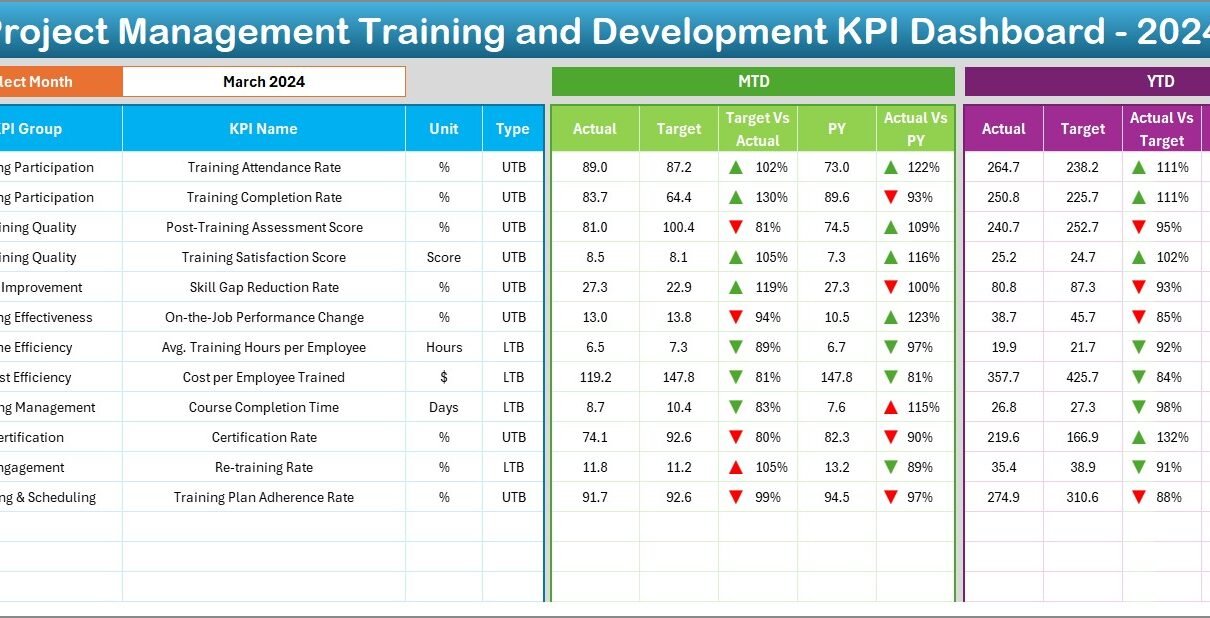
Dashboard Sheet Tab
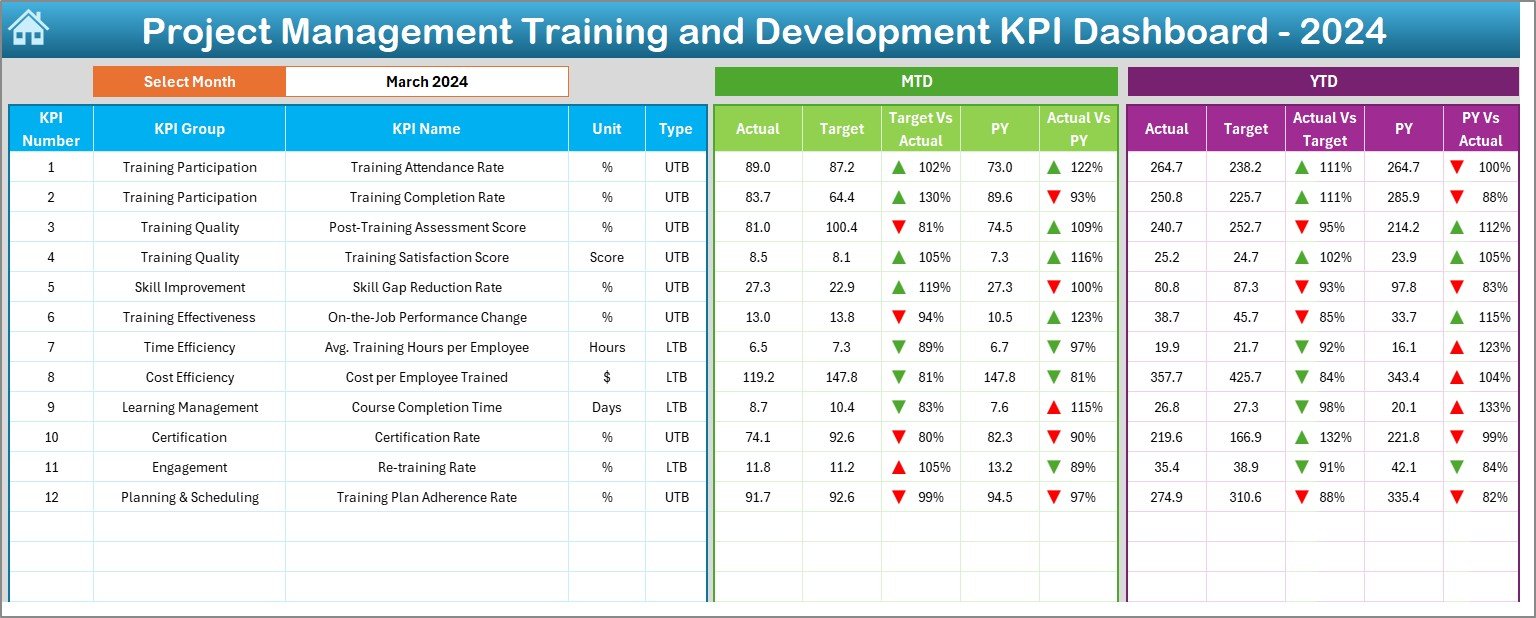
This sheet is the core of the dashboard, showcasing vital training KPIs. Key features include:
- Month selection dropdown (cell D3), instantly updating all data for the selected month.
- Display of Month-to-Date (MTD) Actual, Target, and Previous Year (PY) data.
- Year-to-Date (YTD) Actual, Target, and PY data visualization.
- Clear, easy-to-understand conditional formatting with visual up/down arrows comparing actual figures against targets and PY data.
KPI Trend Sheet Tab
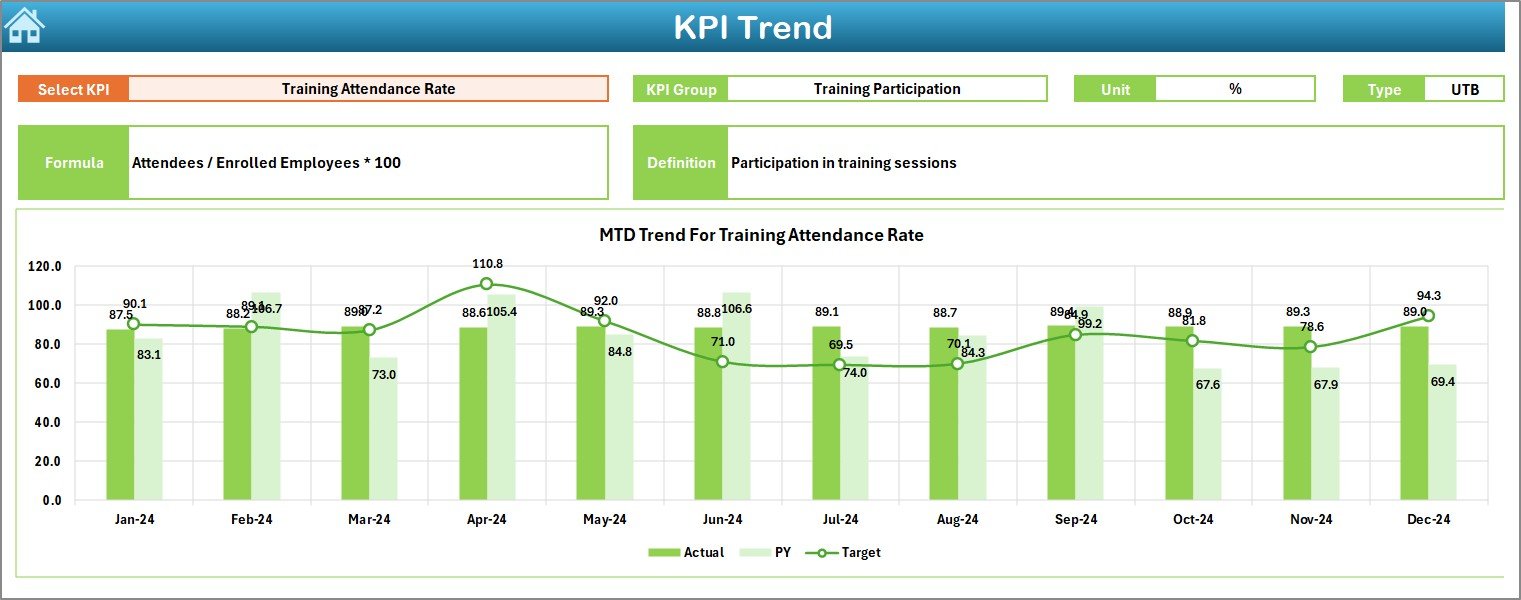
This dynamic sheet provides detailed insights into KPI trends. Features include:
- Dropdown menu in cell C3 for selecting KPIs.
- Detailed display of KPI Group, Unit, KPI Type (Lower the Better/Upper the Better), Formula, and Definitions.
- Graphical representations of MTD and YTD trends for Actual, Target, and PY data.
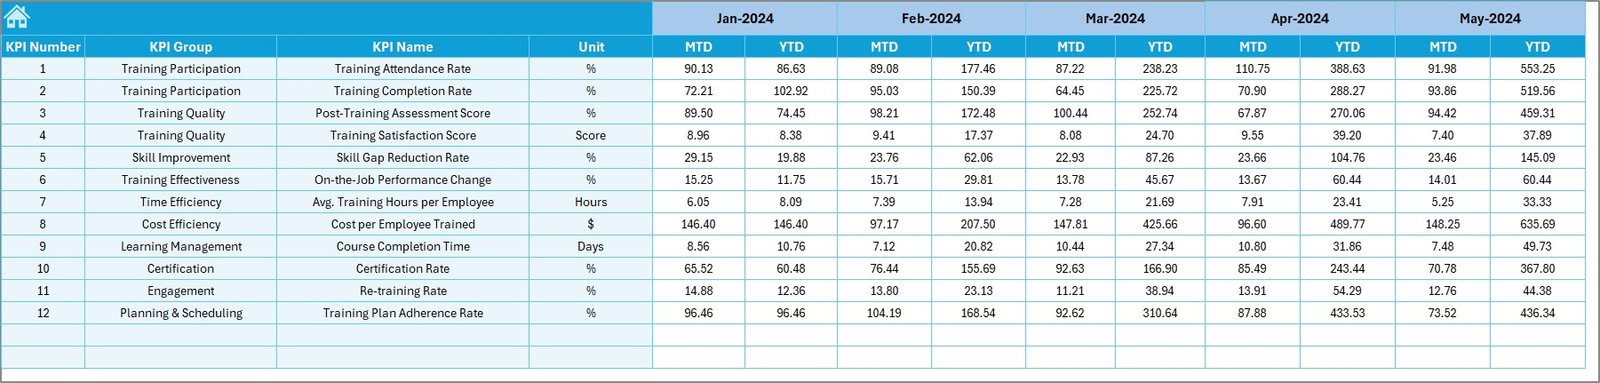
Actual Numbers Input Sheet
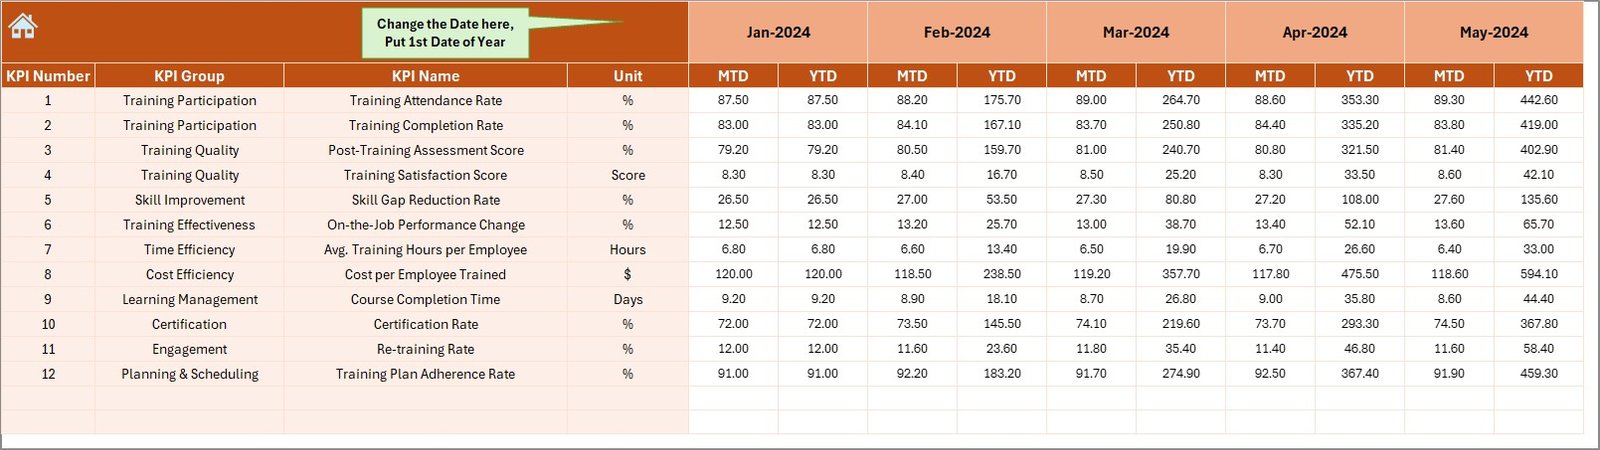
Designed for practical input, this worksheet:
- Allows users to input actual MTD and YTD training data.
- Enables month adjustments from cell E1.
Target Sheet Tab
Dedicated to goal-setting, this worksheet:
- Allows monthly input of target numbers for each KPI.
- Tracks MTD and YTD targets efficiently.
Previous Year Number Sheet Tab
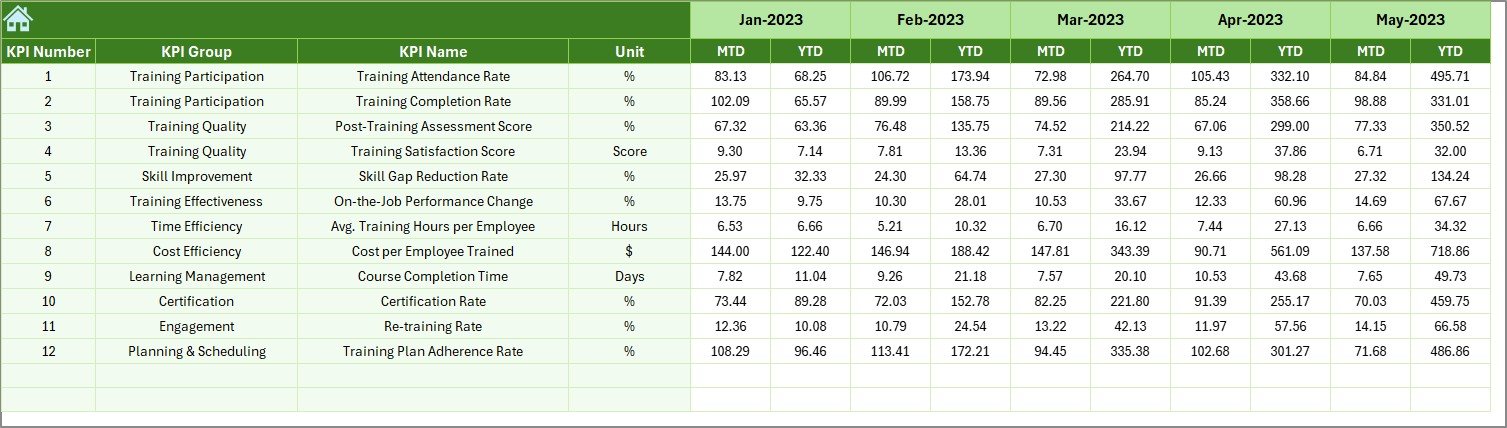
For comparative analysis, this sheet:
- Enables entry of previous year’s training performance.
- Facilitates year-over-year performance comparisons.
Click to Purchases Project Management Training and Development KPI Dashboard in Excel
KPI Definition Sheet Tab
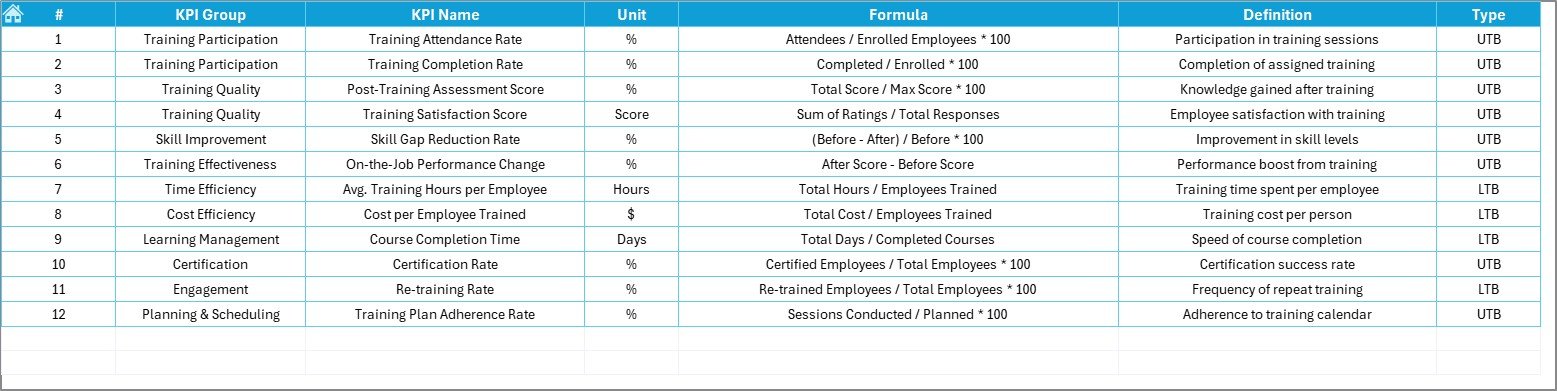
This sheet provides clarity on KPIs, enabling users to define:
- KPI Names
- KPI Groups
- Units of Measurement
- KPI Formulas
- Clear definitions
Advantages of Using the Project Management Training and Development KPI Dashboard
Using a KPI Dashboard offers numerous benefits:
- Immediate Insights: Quickly assess training effectiveness and identify areas for improvement.
- Time Efficiency: Automated calculations save significant reporting time.
- Enhanced Decision-Making: Easy-to-read visuals and real-time data help in informed decisions.
- Clear Communication: Visual KPIs improve team communication regarding training expectations and outcomes.
- Historical Comparisons: Easily compare current performance against past data.
Best Practices for the Project Management Training and Development KPI Dashboard
To maximize the benefits of your dashboard, follow these best practices:
- Regular Updates: Frequently update actual data to maintain dashboard accuracy.
- Clear KPI Definitions: Clearly define each KPI to ensure consistent understanding among team members.
- Monthly Reviews: Regularly review the dashboard with your team to align training goals with organizational objectives.
- Training Integration: Use insights from the dashboard to continuously refine and improve training programs.
- Accessible to All Stakeholders: Ensure all relevant stakeholders have access to the dashboard to foster transparency.
How to Effectively Implement the Dashboard?
Here’s a straightforward approach for effective dashboard implementation:
- Define Clear KPIs: Clearly define what you want to measure.
- Gather Historical Data: Collect previous training records for comparative analysis.
- Train Your Team: Ensure everyone knows how to use the dashboard.
- Regularly Monitor Progress: Continuously monitor data and make necessary adjustments.
- Feedback Integration: Use feedback to constantly refine KPIs and training strategies.
Conclusion
Leveraging the Project Management Training and Development KPI Dashboard in Excel transforms how your organization evaluates and improves its training initiatives. It offers invaluable insights, saves substantial reporting time, and facilitates data-driven decisions that propel your team’s effectiveness forward.
Frequently Asked Questions with Answers
Q1: What exactly are KPIs in training and development?
Answer: KPIs (Key Performance Indicators) in training measure effectiveness, attendance, participant engagement, skill development, and the overall impact on organizational performance.
Q2: Can this dashboard be customized?
Answer: Absolutely. The Excel-based dashboard allows complete customization to fit your specific organizational needs.
Q3: Who should use this dashboard?
Answer: Project Managers, Training Managers, HR Professionals, and team leaders who are responsible for tracking and improving training programs should use this dashboard.
Q4: How often should I update the dashboard?
Answer: Regular updates (weekly or monthly) are recommended to maintain accuracy and real-time insights.
Visit our YouTube channel to learn step-by-step video tutorials
Click to Purchases Project Management Training and Development KPI Dashboard in Excel