In today’s fast-paced logistics and supply chain environment, tracking the right metrics can make or break your project timelines. That’s exactly where the Supply Chain and Logistics Project Timeline KPI Dashboard in Excel becomes your secret weapon. This powerful, ready-to-use Excel template empowers managers, planners, and logistics professionals to monitor essential KPIs, visualize trends, and take timely actions that keep your supply chain running smoothly.
In this detailed article, we will break down everything you need to know about this Excel dashboard, including its features, advantages, best practices, and frequently asked questions. Whether you’re new to KPI dashboards or an Excel pro, this guide is your roadmap to smarter logistics management.
Click to Purchases Supply Chain and Logistics Project Timeline KPI Dashboard in Excel
What is a Supply Chain and Logistics Project Timeline KPI Dashboard?
A Supply Chain and Logistics Project Timeline KPI Dashboard is an interactive Excel-based tool that helps track and analyze Key Performance Indicators (KPIs) related to supply chain projects. It covers performance metrics across various timeframes like Month-to-Date (MTD) and Year-to-Date (YTD), offering comparisons with target and previous year data.
By using this dashboard, supply chain professionals can:
- Gain quick insights into project progress
- Identify performance gaps
- Make data-driven decisions to avoid delays
Key Features of the Excel Dashboard
This KPI dashboard template includes 7 interactive worksheet tabs to give you a complete view of your logistics operations:
Home Sheet
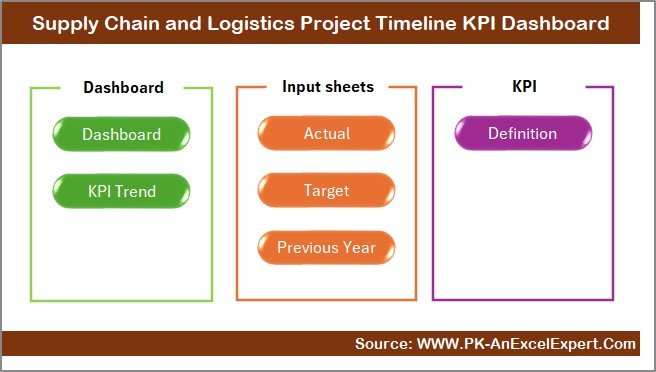
- Works as a smart navigation index
- Includes 6 buttons for quick access to other sheet tabs
Dashboard Sheet
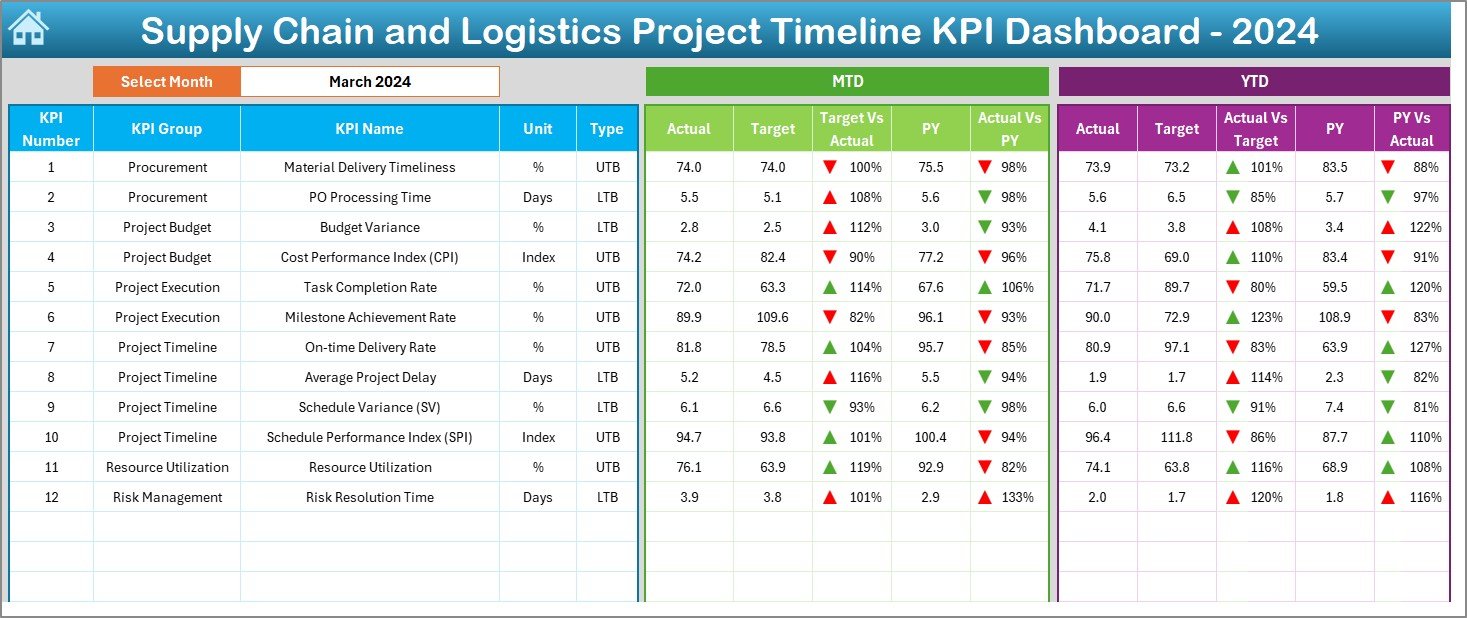
- Select the reporting Month via dropdown in cell D3
- Displays MTD and YTD Actual, Target, and Previous Year data
- Uses conditional formatting (up/down arrows) for easy visual comparison
- Highlights Target vs Actual and PY vs Actual in one glance
KPI Trend Sheet
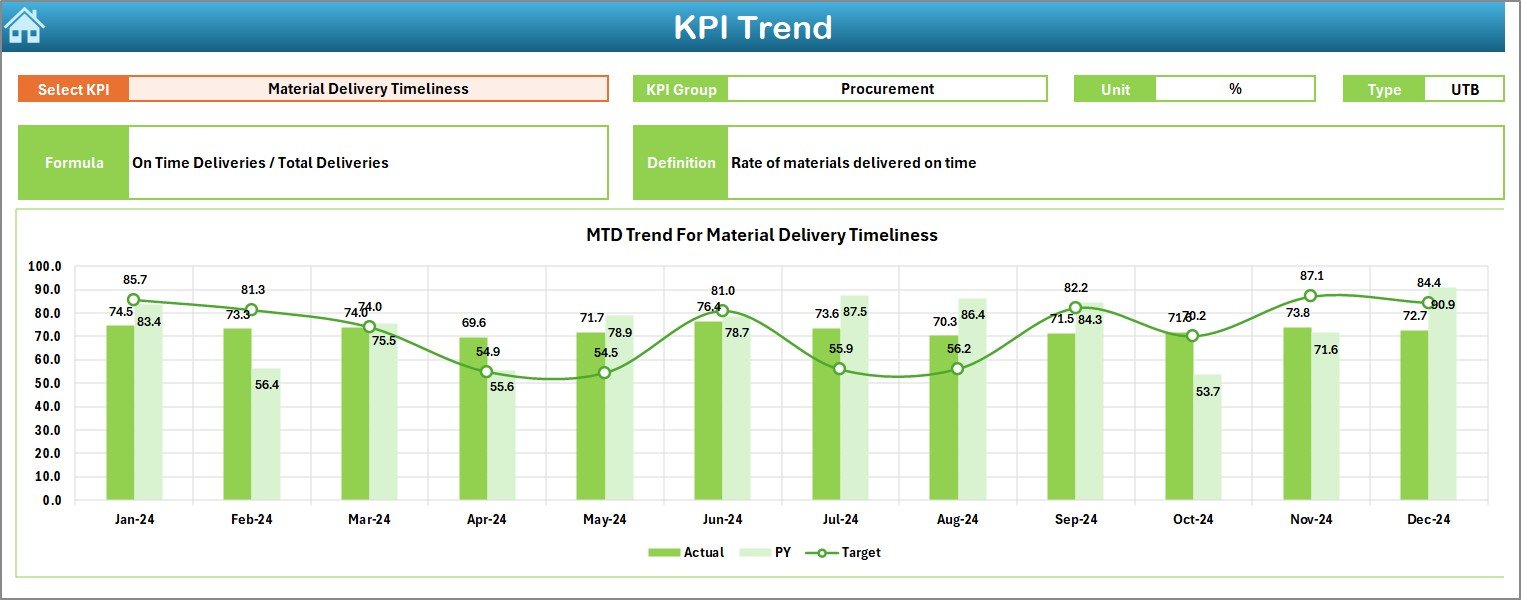
- Select any KPI from cell C3
Shows important details:
- KPI Group
- Unit
- Type (LTB or UTB)
- Formula
- Definition
- Includes trend charts for MTD and YTD values
Click to Purchases Supply Chain and Logistics Project Timeline KPI Dashboard in Excel
Actual Numbers Input Sheet
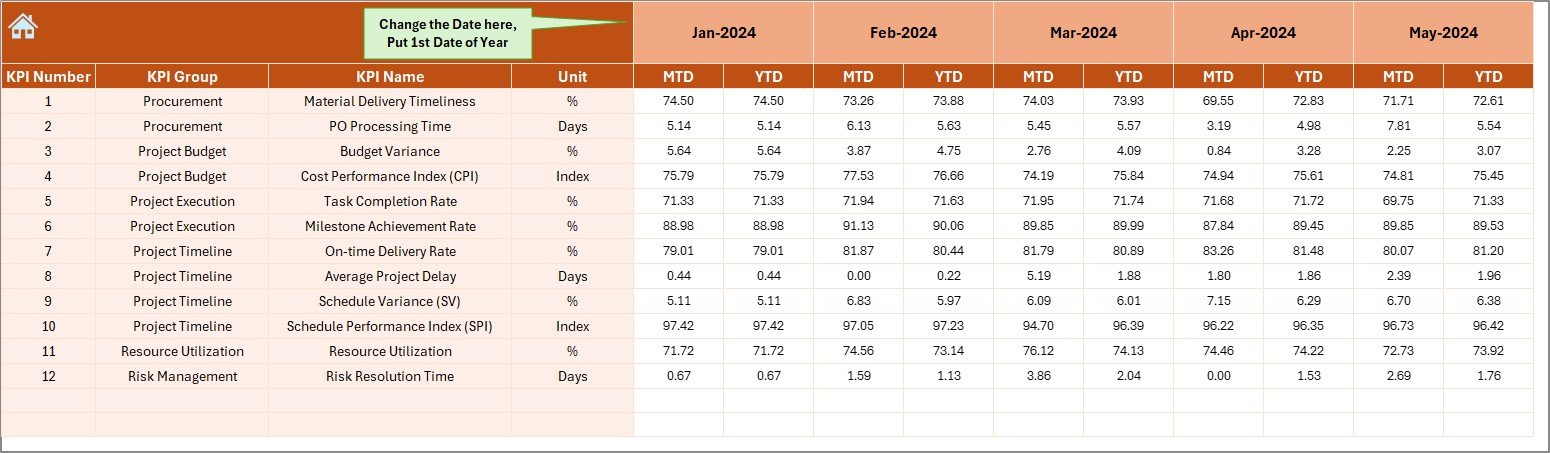
- Enter MTD and YTD actual values for each KPI by month
- Change the start month from cell E1 for custom reporting
Target Sheet Tab
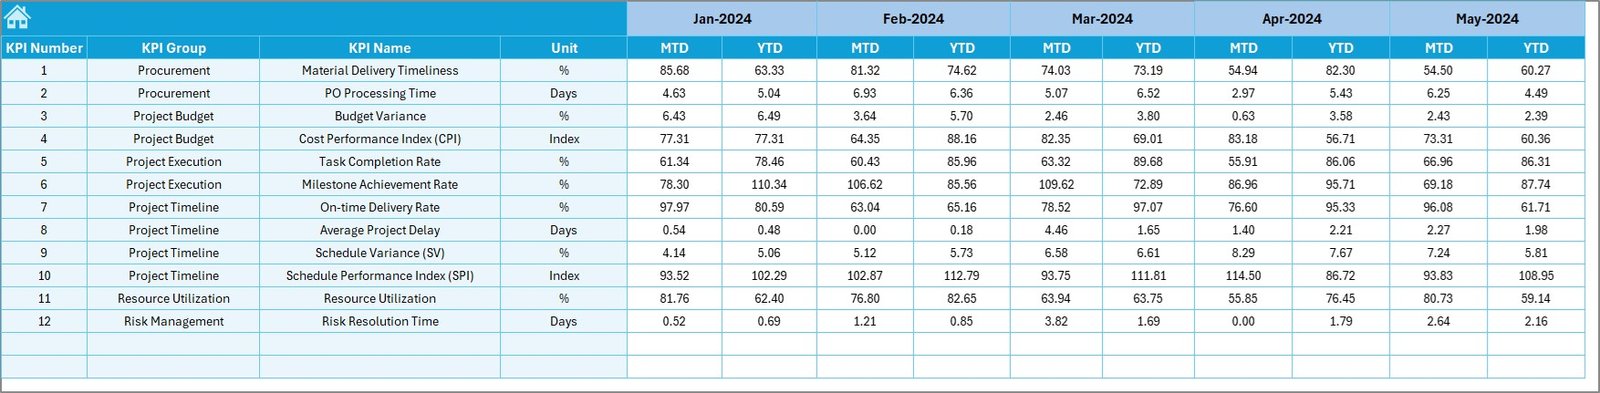
- Input monthly Target values (MTD and YTD) for each KPI
Previous Year Number Sheet Tab
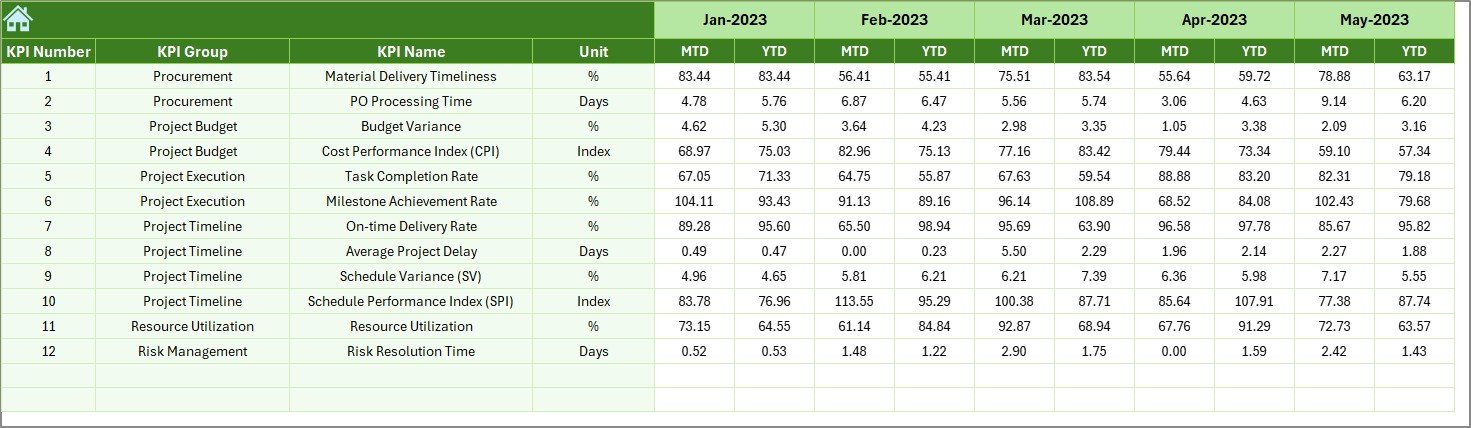
- Enter last year’s MTD and YTD data for each KPI for comparison
KPI Definition Sheet Tab
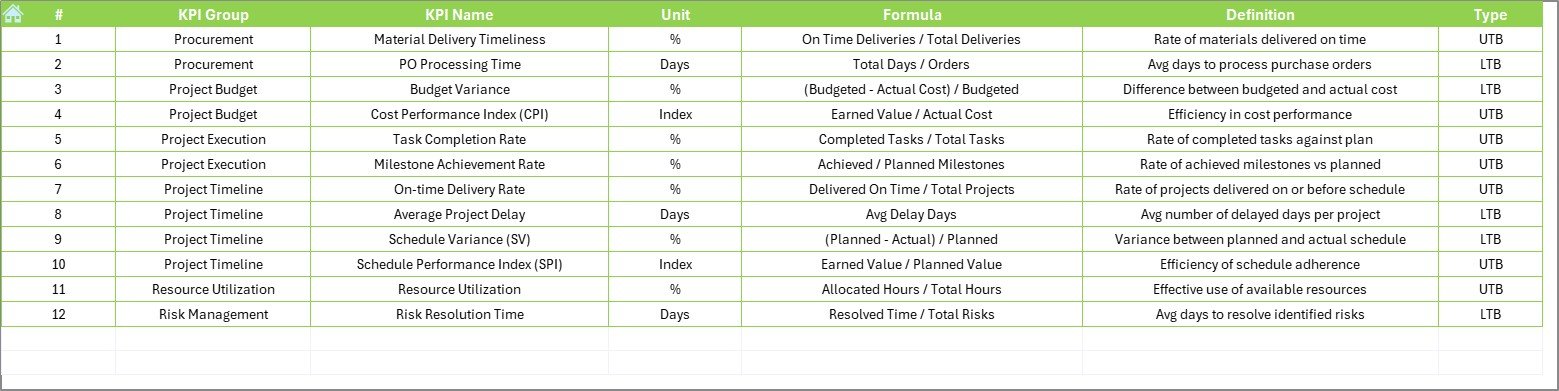
- Enter KPI Name, Group, Unit, Formula, and Definition
- Keeps your KPI calculations transparent and documented
Advantages of Using This KPI Dashboard
✨ Real-Time Visibility
It allows real-time tracking of KPI performance for any selected month, so you’re never in the dark.
🔄 Comparative Insights
Compare actuals vs targets and previous year values side-by-side, with visual cues to make quick decisions.
🔬 Centralized Data
Consolidates project timeline data across months and years in one structured file.
🌟 Fully Customizable
You can modify KPIs, formulas, or layouts to match your organization’s unique supply chain needs.
Best Practices for Using the KPI Dashboard
To get the most out of your Supply Chain and Logistics Project Timeline KPI Dashboard, follow these best practices:
✅ Define KPIs Clearly
Ensure that all KPIs are clearly defined in the KPI Definition Sheet, with proper units, formulas, and whether they are “Lower the Better” or “Upper the Better.”
✅ Keep Data Consistent
Enter all values (Actual, Target, PY) consistently each month to maintain trend accuracy.
✅ Regularly Review Trends
Use the KPI Trend Sheet to monitor dips or spikes in performance and investigate causes immediately.
✅ Automate Data Entry (Optional)
Consider adding VBA or Power Query automation for input sheets to reduce manual effort.
✅ Backup Monthly
Always save a backup after updating monthly data, especially before overwriting values.
Why Excel for Supply Chain Dashboards?
Many wonder why Excel still holds strong in supply chain analytics. The answer is simple:
- ✅ Widely available
- ✅ Easy to use
- ✅ Supports formulas, charts, and conditional formatting
- ✅ Allows deep customization without coding
If your team knows Excel, you already have a powerful reporting tool at your fingertips.
Use Cases: Where Can You Apply This Dashboard?
- 🚚 Transportation Planning
- 🏢 Warehouse Scheduling
- 🌾 Vendor Supply Coordination
- 🚧 Project Delay Analysis
- 🏦 Inventory Fulfillment
Whether you’re running a local warehouse or coordinating multi-country logistics, this dashboard offers instant clarity.
How to Get Started?
- Download the Excel template
- Review the KPI Definition Sheet
- Fill in Target, Actual, and PY data
- Select a month on the Dashboard Tab
- Start analyzing your metrics visually!
You’ll be amazed at how quickly you spot trends and delays using this tool.
Conclusion
Managing supply chain projects without data is like sailing without a compass. With the Supply Chain and Logistics Project Timeline KPI Dashboard in Excel, you gain a clear, actionable view of how your supply chain performs across timelines.
This dashboard helps you stay proactive, avoid surprises, and deliver projects on schedule. The best part? You don’t need any fancy software or expensive tools. Just Excel, some well-structured data, and this ready-to-use dashboard template.
Make it a core part of your logistics toolkit today.
Frequently Asked Questions (FAQs)
1. What are the most common KPIs for supply chain project timelines?
Common KPIs include On-Time Delivery, Inventory Turnover, Project Completion Rate, and Order Cycle Time.
2. Can I add more KPIs to the dashboard?
Absolutely! You can easily add more KPIs by updating the KPI Definition Sheet and expanding the input and trend sheets accordingly.
3. Is this Excel dashboard compatible with older versions of Excel?
Yes. It works with Excel 2013 and above. However, for best performance, use Excel 2016 or later.
4. Do I need coding knowledge to use this dashboard?
Not at all. The dashboard is designed for users with basic Excel knowledge. Everything works through formulas and dropdowns.
5. How often should I update the dashboard?
You should update the dashboard every month to maintain accurate trends and comparisons.
Click to Purchases Supply Chain and Logistics Project Timeline KPI Dashboard in Excel
Visit our YouTube channel to learn step-by-step video tutorials