In today’s fast-paced business world, sustainability is no longer just a buzzword—it’s a necessity. Organizations across industries are under pressure to demonstrate their commitment to environmental, social, and governance (ESG) goals. But how can businesses monitor, measure, and report sustainability effectively?
That’s where the Sustainability Reporting KPI Dashboard in Power BI becomes a powerful tool.
This article explores everything you need to know about setting up, using, and optimizing a sustainability dashboard in Power BI—whether you’re a sustainability officer, business analyst, or executive decision-maker. Let’s dive in.
Click to Purchases Sustainability Reporting KPI Dashboard in Power BI
What is a Sustainability Reporting KPI Dashboard in Power BI?
A Sustainability Reporting KPI Dashboard in Power BI is a ready-to-use business intelligence tool that helps organizations track, analyze, and visualize key performance indicators (KPIs) related to their sustainability initiatives. Built with Microsoft Power BI and powered by structured Excel data inputs, this dashboard transforms raw sustainability metrics into insightful visuals that drive action.
Unlike traditional reporting methods, Power BI dashboards offer dynamic visuals, real-time filtering, and deep-dive capabilities—all while maintaining a user-friendly interface.
Key Components of the Sustainability Dashboard
The dashboard is composed of three main Power BI pages and is connected to an Excel file with structured input. Let’s break down each page and its function.
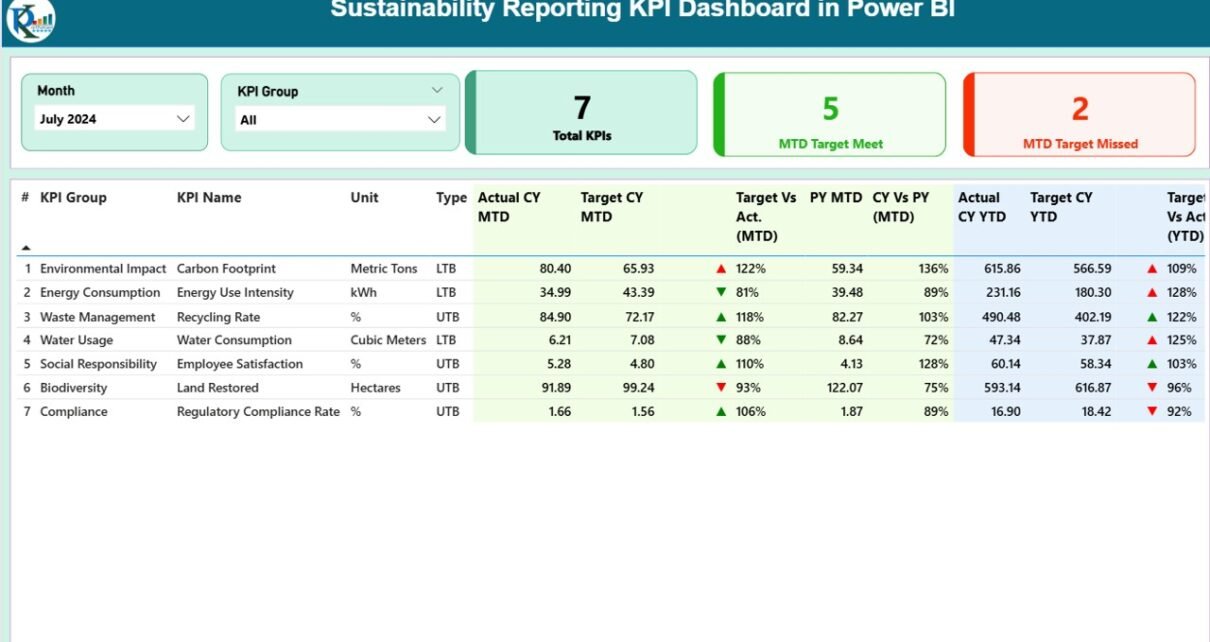
Summary Page
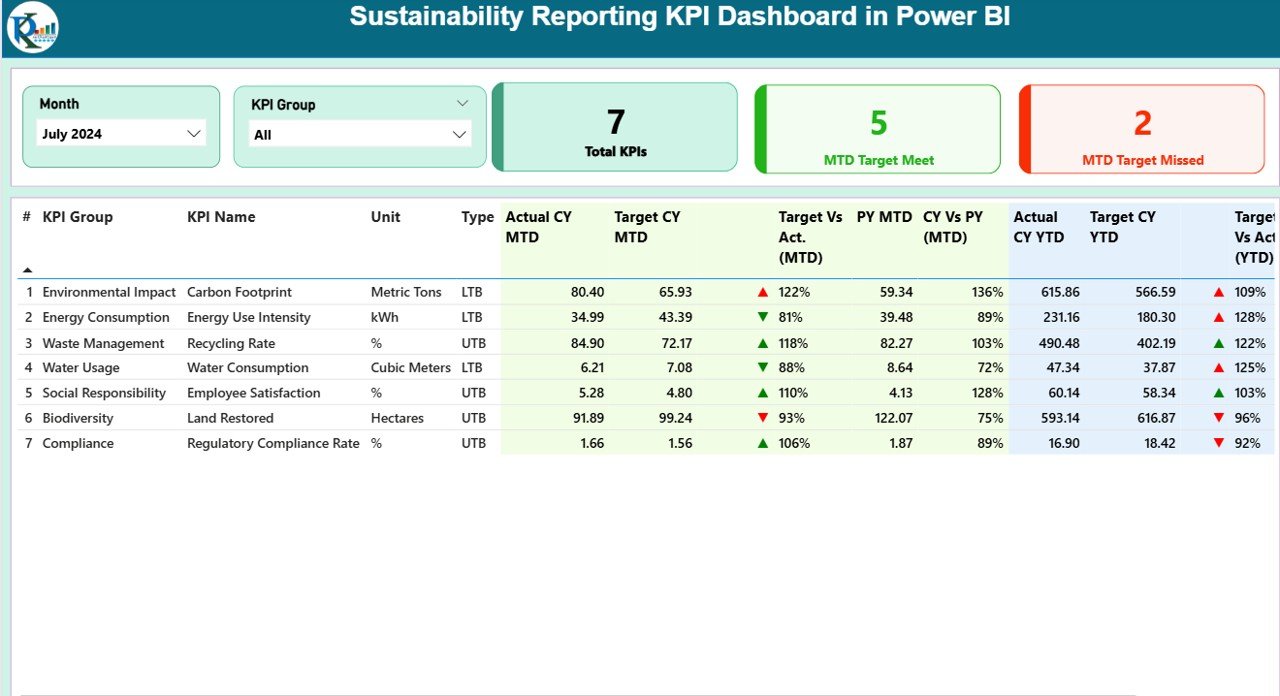
This is the main page where users land and interact with the dashboard. It features:
-
Month & KPI Group slicers on top for filtering data
3 Summary Cards:
- Total KPIs
- MTD Target Met Count
- MTD Target Missed Count
Detailed KPI Table Includes:
-
KPI Number: A unique sequence for each KPI
-
KPI Group: Category like Emissions, Waste, Energy, Water, Social, Governance
-
KPI Name: Clear title of the KPI
-
Unit: Measurement unit (e.g., tons, liters, %, kWh)
-
Type: LTB (Lower the Better) or UTB (Upper the Better)
-
Actual CY MTD / YTD: Current year month-to-date or year-to-date actual numbers
-
Target CY MTD / YTD: Current year MTD or YTD targets
-
MTD / YTD Icon: ▲ (green) for met or ▼ (red) for missed
-
Target vs Actual % (MTD/YTD): Displays performance as a percentage
-
Previous Year (PY) MTD / YTD: Historical values from the same period
-
CY vs PY % (MTD/YTD): Measures performance improvement over last year
With intuitive icons and visual alerts, this page helps teams quickly identify which KPIs need attention.
KPI Trend Page
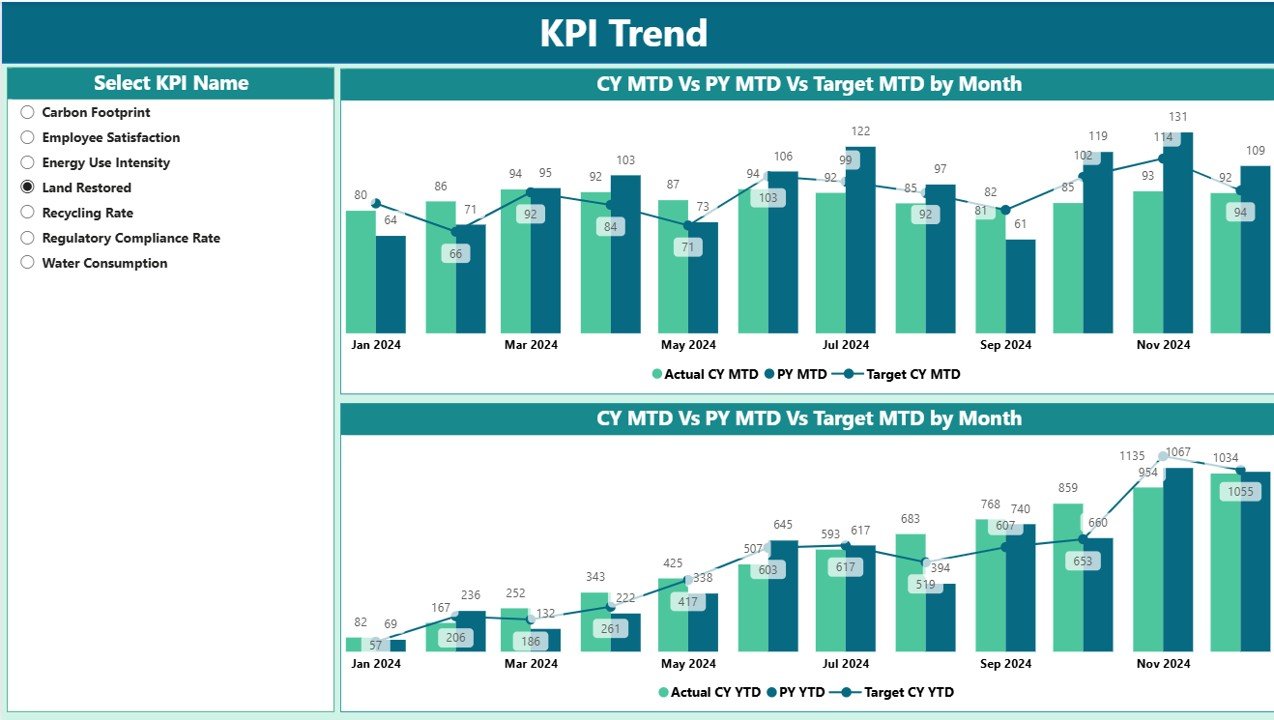
This page includes:
Combo Charts showing:
- Actual CY, PY, and Target for MTD
- Actual CY, PY, and Target for YTD
-
KPI Slicer on the left panel for selecting specific KPIs to analyze
This visualization helps monitor trends over time, understand seasonality, and compare current vs past performance in real-time.
Click to Purchases Sustainability Reporting KPI Dashboard in Power BI
KPI Definition Page (Drill-Through Page)
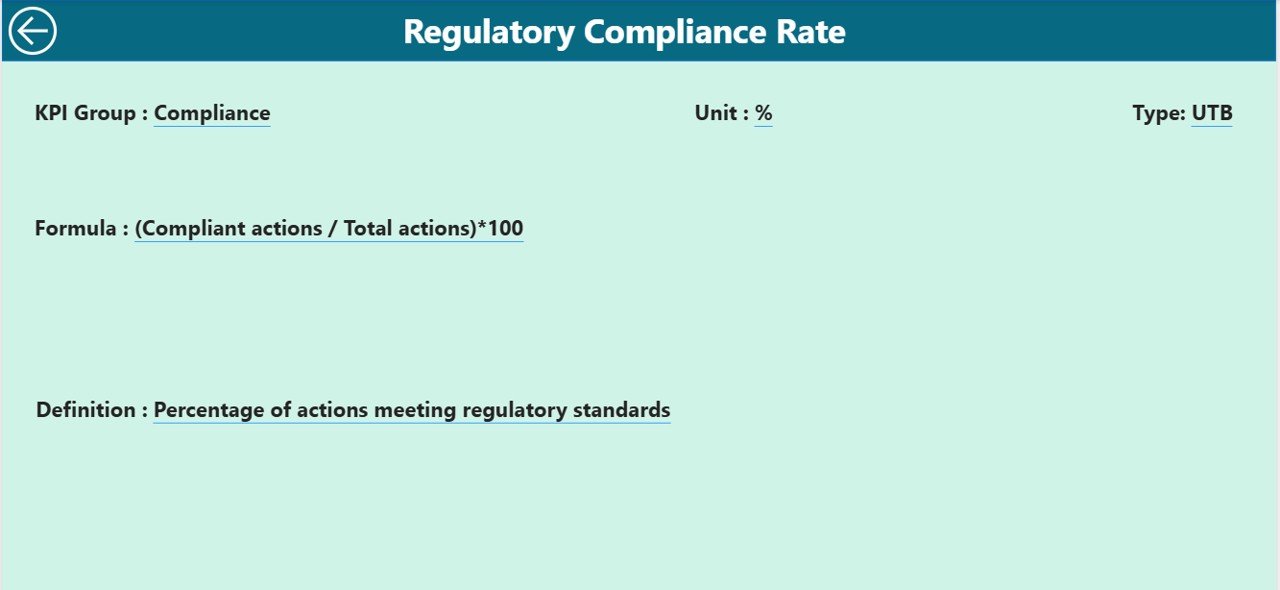
This hidden page is accessible via drill-through from the Summary Page. It includes:
-
KPI Number
-
KPI Group
-
KPI Name
-
Unit
-
Formula
-
KPI Definition
-
Type (LTB/UTB)
Users can return to the main page using the back button in the top-left corner.
Data Structure: Excel as the Backbone
This dashboard relies on a structured Excel file, which acts as the backend for all KPI inputs.
1. Input_Actual Sheet
-
Columns: KPI Name, Month (first day of the month), MTD Actual, YTD Actual
-
Users enter real values from operational or ESG systems
2. Input_Target Sheet
-
Columns: KPI Name, Month, MTD Target, YTD Target
-
Targets set by leadership or sustainability managers
3. KPI_Definition Sheet
-
Columns: KPI Number, KPI Group, KPI Name, Unit, Formula, Definition, Type
-
Acts as a data dictionary for users and auditors
Together, these sheets ensure data integrity and seamless updates through Power BI Refresh.
Advantages of a Sustainability Reporting KPI Dashboard
Using a dashboard like this offers a wide range of benefits:
📌 1. Real-Time Insights
-
Easily compare actuals with targets and previous year data
-
Use icons for quick visual cues on performance
📌 2. Drill-Down Functionality
-
Go from a high-level summary to detailed KPI definitions in just one click
📌 3. Streamlined Data Entry
-
Use Excel as the single point of data entry—no coding needed
📌 4. Clear Visuals
-
Slicers, combo charts, and performance tables enhance user understanding
📌 5. Customization Flexibility
-
Adapt KPI names, groups, and targets based on your industry needs
📌 6. Supports ESG Compliance
-
Track Scope 1, 2, and 3 emissions, water usage, recycling rates, and more
📌 7. Cost-Effective
-
Avoid expensive third-party tools by using Power BI and Excel
Who Should Use This Dashboard?
This dashboard is ideal for:
-
Sustainability Managers
-
ESG Reporting Teams
-
CSR Officers
-
Compliance Analysts
-
Operations Managers
-
Consulting Firms
Whether your company is large or small, if sustainability matters, this dashboard can support your initiatives.
How to Use the Dashboard Effectively
To make the most out of your Sustainability Reporting KPI Dashboard in Power BI, follow these steps:
Step 1: Define Your KPIs
Use the KPI Definition sheet to establish what you want to measure, how, and why.
Step 2: Enter Monthly Data
Update the Input_Actual and Input_Target sheets regularly with new data.
Step 3: Refresh Power BI
Click on “Refresh” in Power BI Desktop to sync updated Excel inputs.
Step 4: Review the Summary Page
Filter by KPI Group and Month to see what’s on track and what needs attention.
Step 5: Deep Dive with Trends
Use the KPI Trend page to analyze how performance has evolved.
Step 6: Drill for Definitions
Click through to the KPI Definition page to view underlying logic or formulae.
Best Practices for the Sustainability Reporting KPI Dashboard
To ensure you get the most value, consider these best practices:
✔ Keep Data Updated
-
Set monthly reminders to update the Excel file
✔ Use Standard KPI Definitions
-
Ensure consistent naming, units, and formulae across the team
✔ Leverage Drill-Through Wisely
-
Teach users how to access and interpret KPI definitions
✔ Maintain a Version History
-
Keep backups of past data for auditing and comparisons
✔ Align KPIs with ESG Goals
-
Use globally recognized frameworks like GRI, SASB, or TCFD
✔ Automate Refresh (Optional)
-
Set up Power BI Gateway to refresh the dashboard automatically from SharePoint or OneDrive
✔ Communicate Insights
-
Share snapshot exports with stakeholders regularly
Why Use Power BI for Sustainability Reporting?
Power BI offers several advantages over Excel-only tools or manual reporting:
-
Interactive slicers and filters
-
Seamless integration with Excel
-
Scalable for multiple users
-
Rich visual storytelling
-
Supports mobile and desktop views
-
Ability to embed reports in SharePoint or websites
Moreover, with Power BI’s drill-down and bookmarking features, you can turn raw sustainability numbers into compelling stories for stakeholders and board meetings.
Real-World Use Cases
Let’s look at some use cases of this dashboard:
📈 Manufacturing Firm
Tracks energy consumption, carbon emissions, and waste reduction goals
🏫 University
Monitors water usage, sustainability programs, and student engagement KPIs
🏢 Corporate Office
Tracks recycling efforts, paperless transitions, and employee training hours
🛒 Retail Chain
Measures Scope 3 emissions from logistics and packaging sustainability
🌐 Consulting Firm
Provides client-specific ESG dashboards for monthly review
Conclusion
Sustainability is no longer optional—it’s essential. Organizations that measure, track, and act on their sustainability KPIs are not only improving the planet but also building resilient and future-ready businesses.
The Sustainability Reporting KPI Dashboard in Power BI gives you the tools you need to manage this responsibility effectively. It combines the power of Excel’s simplicity with Power BI’s analytical strength, delivering clear, visual, and actionable insights.
If your organization wants to elevate its sustainability performance, this dashboard is a must-have solution.
Frequently Asked Questions (FAQs)
Q1: What software do I need to use this dashboard?
Answer: You need Microsoft Power BI Desktop (free) and Microsoft Excel. The dashboard reads data directly from the Excel file.
Q2: Can I customize the KPIs?
Answer: Yes! You can edit the KPI Definition sheet to add or remove KPIs, change formulas, or update units.
Q3: Is this dashboard suitable for ESG reporting?
Answer: Absolutely. You can track KPIs across environmental, social, and governance (ESG) dimensions.
Q4: What if I have more than one year of data?
Answer: You can keep adding monthly data in the Excel sheets. The dashboard updates automatically when refreshed.
Q5: How do I track performance vs. target?
Answer: The dashboard shows icons (▲ / ▼) and percentage comparisons for both MTD and YTD figures against targets.
Q6: Can I use this for non-profit organizations?
Answer: Yes. The structure is flexible and can be adapted for non-profits, universities, municipalities, and more.
Q7: What is the difference between UTB and LTB KPIs?
Answer: UTB (Upper the Better) means a higher number is good—e.g., recycling rate. LTB (Lower the Better) means a lower number is better—e.g., carbon emissions.
Q8: Is there a way to automate the data update process?
Answer: Yes. You can use Power BI’s data gateway to auto-refresh your dashboard when Excel is stored on OneDrive or SharePoint.
Visit our YouTube channel to learn step-by-step video tutorials