Running a theme park successfully goes beyond thrilling rides and long lines—it requires strategic planning, real-time decision-making, and data-driven insights. Whether you’re monitoring ticket sales, guest satisfaction, safety incidents, or food & beverage performance, Key Performance Indicators (KPIs) are your best friends.
That’s where the Theme Park KPI Dashboard in Power BI enters the scene. 🎯 This powerful visualization tool brings all your park performance metrics into one interactive and easy-to-understand dashboard. In this comprehensive article, you’ll learn:
Click to Purchases Theme Park KPI Dashboard in Power BI
-
What the Theme Park KPI Dashboard in Power BI is
-
How it works
-
Its components and data flow
-
Key advantages and best practices
-
Use cases and strategic impact
-
Plus, a helpful FAQ at the end
What Is the Theme Park KPI Dashboard in Power BI?
The Theme Park KPI Dashboard in Power BI is a dynamic and ready-to-use business intelligence solution built using Microsoft Power BI. It is designed to monitor, track, and evaluate all critical KPIs across a theme park’s operations. From foot traffic to food sales, from ride uptime to customer satisfaction—this dashboard empowers stakeholders with real-time insights to improve efficiency, profitability, and guest experience.
This dashboard pulls data from an Excel-based source file and processes it across three well-structured Power BI pages:
-
Summary Page
-
KPI Trend Page
-
KPI Definition Page
Let’s explore each one in detail. 👇
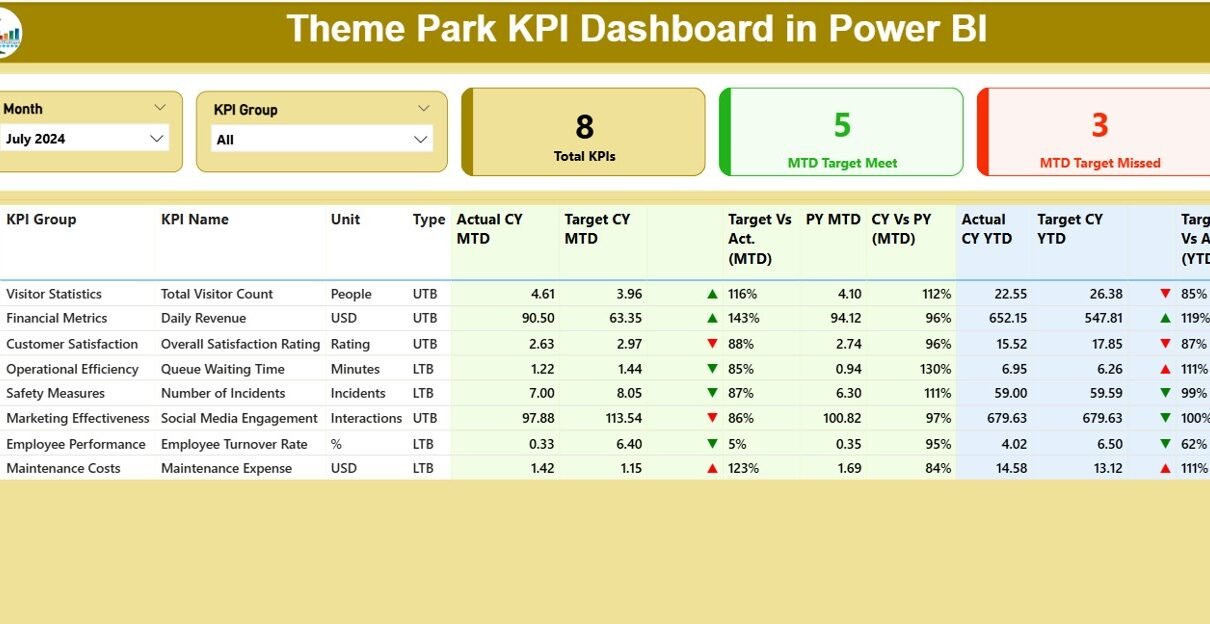
Summary Page – The Command Center
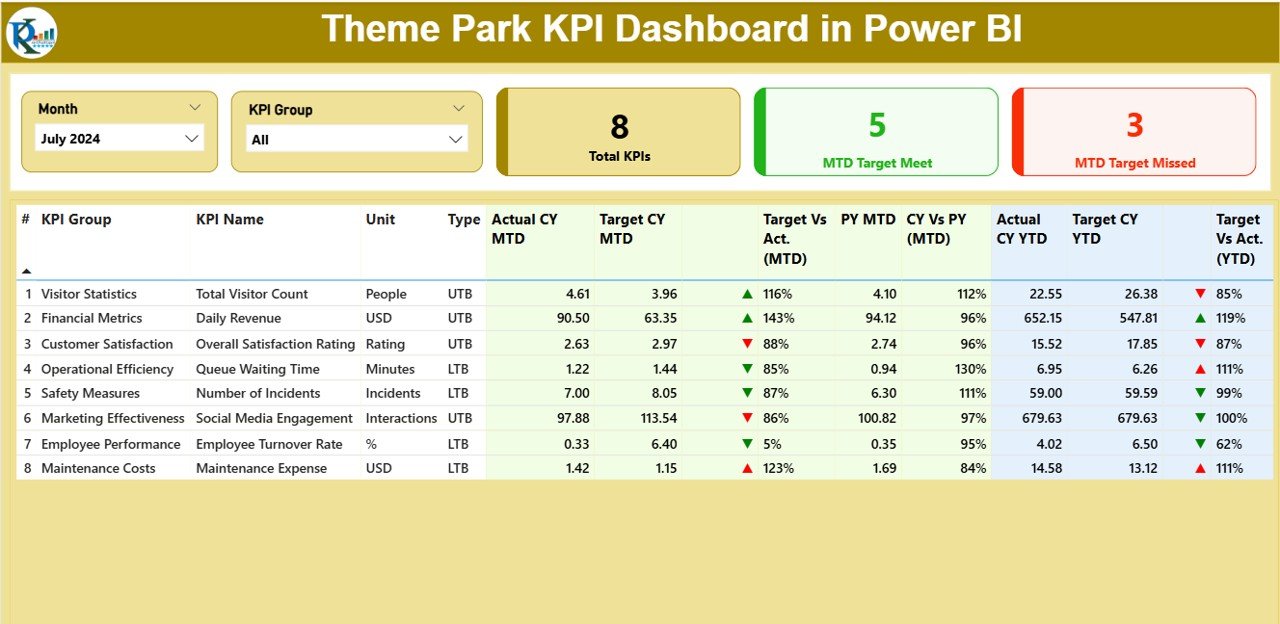
The Summary Page is the heart of the dashboard. It provides a bird’s-eye view of how your theme park is performing against predefined targets, both Month-to-Date (MTD) and Year-to-Date (YTD).
Key Features of the Summary Page:
-
Month and KPI Group Slicer: Filter KPIs by month and category
KPI Cards:
✅ Total KPI Count
🟢 MTD Target Met
🔴 MTD Target Missed
KPI Trend Page – Visualize the Story Behind the Numbers
The KPI Trend Page turns raw metrics into meaningful stories.
🧩 Components of the KPI Trend Page:
-
KPI Selector Slicer: Choose any KPI from a dropdown
-
Combo Charts (2):
- Chart 1: MTD comparison (Current Year, Previous Year, Target)
- Chart 2: YTD comparison (Current Year, Previous Year, Target)
These charts help you spot trends, seasonality patterns, and performance dips—so you can respond proactively.
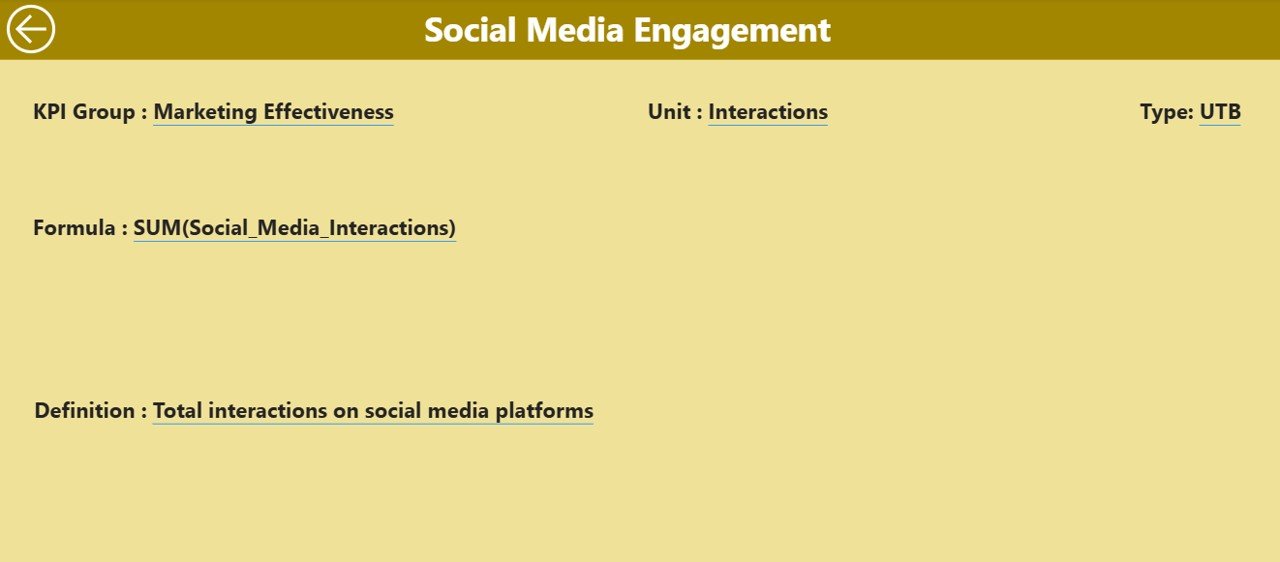
KPI Definition Page – Understand the ‘Why’ Behind the ‘What’
This is a drill-through page (hidden by default), accessible by right-clicking any KPI on the summary table.
Details Captured on This Page:
-
KPI Number
-
KPI Group
-
KPI Name
-
Unit of Measurement
-
KPI Formula
-
KPI Definition
-
Type: LTB or UTB
A Back Button at the top-left allows smooth navigation back to the Summary Page.
Click to Purchases Theme Park KPI Dashboard in Power BI
Excel Data Source – Structured and Easy to Update
This dashboard connects to a structured Excel file that includes three key worksheets:
1. Input_Actual Sheet:
-
Fill in Actuals for each KPI
-
Enter the KPI Name, Month (first day), MTD, and YTD
2. Input_Target Sheet:
-
Input Target values for each KPI
-
Use the same month format and KPI names
3. KPI Definition Sheet:
Add or update:
- KPI Number
- Group
- Name
- Unit
- Formula
- Definition
- Type (LTB/UTB)
Updates in Excel auto-refresh the Power BI dashboard—keeping it up-to-date with real-time performance.
Advantages of Theme Park KPI Dashboard in Power BI
Here are the major benefits of using this Power BI dashboard in your theme park operations:
✅ Centralized View
-
All KPIs in one place for better transparency
🚀 Real-Time Tracking
-
Make quick decisions with up-to-date numbers
🎯 Target Monitoring
-
Instantly see where you hit or miss goals
📉 Historical Analysis
-
Compare current performance with last year’s
📊 Visual Insights
-
Easy-to-understand charts and icons
🔄 Easy Integration
-
Works seamlessly with Excel data
👥 Role-Based Accessibility
-
Share with leadership, operations, and finance teams
Best Practices for Using the Theme Park KPI Dashboard
To get the most out of your dashboard, follow these best practices:
📝 1. Standardize KPI Naming
Ensure KPI names match exactly across Excel sheets to avoid mismatches in Power BI.
🧮 2. Classify KPI Type (LTB or UTB)
Classify correctly to show the right indicator (▲ or ▼) and avoid misinterpretation.
📅 3. Use the First Day of the Month
Always input the month as the first date (e.g., 01-Jan-2025) for consistency.
📊 4. Keep Formulas Transparent
Define KPI formulas clearly in the KPI Definition sheet to help others understand how metrics are calculated.
🔁 5. Refresh Data Regularly
Set up a refresh schedule in Power BI to sync with the Excel file daily or weekly.
🎨 6. Use Filters Intelligently
Use slicers (Month, Group, KPI) to drill down into meaningful segments of your operations.
🧩 7. Train Your Team
Conduct short training sessions to help department heads understand how to use and interpret the dashboard.
Who Can Use the Theme Park KPI Dashboard?
This dashboard can be a game-changer for multiple roles in the theme park ecosystem:
-
Park Managers: For daily operational oversight
-
Finance Team: To track revenue, costs, and ROI
-
HR Department: For staffing efficiency KPIs
-
Maintenance Team: For equipment uptime analysis
-
Guest Services: To monitor satisfaction scores
-
F&B Managers: To analyze food and merchandise sales
-
Marketing Team: To evaluate campaign-driven visits
Why Power BI for Theme Parks?
Power BI is the ideal tool for theme parks because it:
-
Connects easily to Excel, SQL, cloud sources, and APIs
-
Provides real-time dashboards
-
Is mobile-friendly—check KPIs on the go
-
Allows drill-through analysis and detailed filters
-
Enables interactive sharing across teams and roles
Conclusion: Turn Data into Action
The Theme Park KPI Dashboard in Power BI is more than just a set of charts—it’s a strategic tool to drive performance, enhance guest satisfaction, and boost operational efficiency. When used effectively, this dashboard can help you turn data into action and decisions into measurable success.
Start today by plugging in your data and experiencing the power of visual analytics for your theme park.
Frequently Asked Questions (FAQs)
1. Can I customize the KPIs in the dashboard?
Yes, you can fully customize KPIs by updating the Excel file, specifically the KPI Definition and Input sheets. Power BI will reflect changes after refresh.
2. Do I need Power BI Pro to use this dashboard?
No, you can use Power BI Desktop (free) to view and interact with the dashboard. However, sharing via Power BI Service may require Pro licensing.
3. What does LTB and UTB mean in KPI types?
LTB = Lower the Better (e.g., Downtime)
UTB = Upper the Better (e.g., Attendance)
4. How frequently should I update the Excel data?
Ideally, update the Excel sheets weekly or monthly based on your reporting needs. Set up scheduled refreshes if using Power BI Service.
5. Can I connect this dashboard to a database instead of Excel?
Yes, Power BI supports multiple data sources like SQL Server, SharePoint, or even web APIs. You just need to match the data structure.
6. Can I filter data by department or team?
Yes. The KPI Group slicer on the Summary Page helps filter data by department, category, or performance area.
7. Is the dashboard mobile-friendly?
Absolutely. Power BI has native apps for iOS and Android that allow mobile viewing of the dashboard
Visit our YouTube channel to learn step-by-step video tutorials